XAUUSD BREAKDOWN FOR NEXT WEEK LONG Hello Traders, This the TVC:GOLD Breakdown from Weekly to daily to the 4H analysis, we find nice setups to enter for a long entry continuation as we noticed the OANDA:XAUUSD past two weeks analysis was in a strong bullish Momentum, so we stick at the bullish movement till it prove us the contrary so we have the Longs Entry Setups :
- Setup 1 : The Entry Price is on the actual higher low of the market structure + Imbalances on a 4H viewpoint and a nice price reduction of 79% in 1H
- Setup 2 : We have a Daily Order block Left + Imbalances + Some Liquidity above + Discounted price on a higer scale timeframe.
- Setup 3 : We have a Daily Order block Left + Daily Imbalances + a lot of Liquidity above + Discounted price on a higer scale timeframe.
Personnally i will look into the 2 Setups it make more sense to me and align with my trading plan, what about you which setup do you agree with it ?
DISCLAIMER: I am not a financial adviser. The Analysis on my channel are for educational purposes only
Forexsignalservice

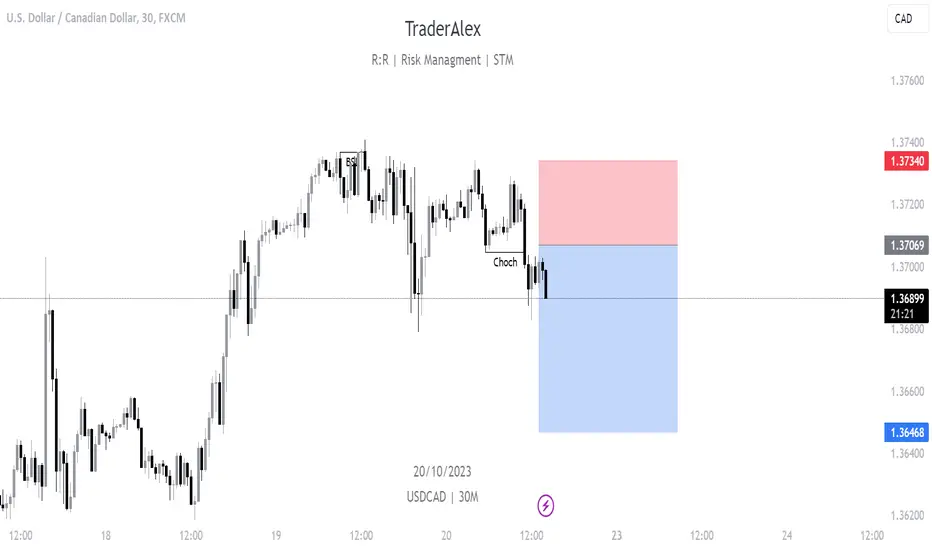
USDCAD Sell IdeaI really like this setup we have on usdcad.. i am going to sell this at 1.37069 .... entry tp and sl on the chart
GBPUSD SHORT SETUP ON A 1H TF Hello traders, this is a possible short setup for FX:GBPUSD , the overall trend still bearish there's no confirmation yet to get on a bullish movement it may be just a pullback for the moment! IF you agree comment Below!

USDCAD DAILY BREAKDOWN FROM A HIGHER TIMEFRAME VIEWPOINT Hello Traders, This the Daily Breakdown for FX:USDCAD on The daily timeframe we already took the monthly and weekly analysis you can check it on #Related ideas what new on this daily analysis!
The daily analysis we find our Daily setup entry on a discounted o price with a clear P.O.I below the FVG " Fair value Gap " or IMB, that what we found and we also indentified the daily range and our next Target which is 1.3670. We gonna refine the OrderBlock on the 4H So stay Tuned For it!!

The Greatest Forex Scalping Indicator EVER $$MartyBoots here. I have been trading for 16 years and I am here to share my ideas with you to help the Crypto community.
This is the greatest forex scalping indicator ever .. If you can show me a better one I would love to see it

WTI CRUDE OIL OUTLOOK Good day, traders.
Today, we'll be looking at WTI crude oil. I anticipate a break of the 80.80 prior high and a return to the 80 zone, after which we will seek for bullish confirmations to place a buy order.
Keep in mind: No confirmation, no admission.
❤️Please, support my work with like, thank you!❤️

Technical analysis for CADCHFGood day, traders.
We'll be keeping an eye on the CADCHF on a daily timescale for any potential breakouts and retests of the strong support zone at 0.6500 that might lead to the triggering of sell orders or rejection from the zone that could lead to the triggering of buy orders.

DREAMS FOREX | NZDJPYHello hustlers..
This is trend change trade..
Use good trade management only thing important in Trading is how you manage your trade...
FROM 1:4 RISK REWARD RATIO...
Enjoy...

EURUSD Breakout TradeEURUSD moving in Channel range now wait for breakout to trade or place your buy stop and sell stop.
Manage risk according to your account size.

SILVER Analysis 30July2023With the formation of a new LL in the wave structure, it is certain that the possibility of greater bearish continuation. It is possible that currently a complex correction wave is formed to determine the wave (2) where Wave 2 is always a correction wave. If you want to do a short, you can do it when the price approaches LH

USDCAD Analysis 30July2023The possibility of a significant movement in the next few days for this pair. If you look a week ago this pair is more likely to accumulate with a structure like sideways. I am still sure that there is an opportunity to be limited to the SND D1 area below before this pair returns to bullish.

AUDUSD Analysis 30July2023If this analysis is true that currently forming Wave C, then the possibility after Wave C is perfectly formed, there will be a fairly high bullish. I prefer to look for opportunities to Long by waiting for some reversal signs that might be formed next week.

EURUSD Analysis 30July2023This pair is in a strong support area for closing last week. Where the price is stuck by trendline as support and trying to penetrate SR Flip. If the price goes down again the closest target is SND below. Meanwhile, if the price responds positively to trendline, then the price is likely to be bullish again with the QM area as a target

GBPUSD Analysis 30July2023After the price responds positively to the SND area, there is a limited bullish correction and the price is back down to form a new LL. The biggest possibility of prices will continue the trend bearish up to the price range of 1,24000

EURUSD | Rebound Resistance & Bottom Channel LineRecent market news & movements, lead to a sharp decline .
In this chart analysis, we'll be examining the price action of EURUSD , focusing on a recent rebound that occurred at the bottom channel line & at 1.09700 resistance zone . The EURUSD pair experienced a notable price drop, but following some key developments, it has found support at the lower boundary of the descending channel, presenting potential trading opportunities.
My goal is 1.09980

GER40 / DAX Analysis 26July2023Ger40 / Dax entered the initial correction period. If you see Wave A has the same length as Wave C, then the possibility that is happening at this time is the formation of Wave (X), after Wave (X) occurs, the price will return to the target with the target up to the trendline below. There is a possibility that the price drops not to the trendline area, by forming complex correction.

GBPJPY Analysis 26July2023Seeing the correction of this pair in the last 3 days has not shown a sign of correction will end. There is a possibility of complex correction with the composition of zig-zag wave. There are several limits where the price will return to bearish if it passes through a particular area.

EURUSD Trade PlanWait for 50% fib level resistance and take entery of sell or place your sell limit order.
Manage your risk according to account size!

SILVER Analysis 24July2023I see this commodity positively bullish, now the price is stuck in the SND area and I try to provide Fibo Retracement, and the results are quite supporting this analysis to find the long area. There are 2 SND areas that are quite striking here, where the SND area intersects with Fibo 0.618 and 0.236, and the 0.236 Fibo area is also close to the bullish trendline, quite interesting?

GOLD Analysis 24July2023Last weekend Gold fell more than bullish trendline, it could be that at this time the price entered into the correction period. If you see, the price is held strong enough in the resistance area which in my opinion is also a liquidity area. Usually areas like this in the future will be pierced. Therefore, I try to add Elliot notation to this analysis chart, assuming that currently the correction period enters Wave 4, then the price will at least be stuck in SND which intersects with Wave 1 and then will continue bullish again

AUDUSD Analysis 24July2023If you see this, a double top can occur and the current price forms a bearish channel pattern. Added with Elliot Wave notation, the possibility that happens is in the A-B-C correction period. Find an opportunity for short when the price is corrected bullish approaching the trendline

EURUSD Double Top Chart PatternThe EUR/USD pair may face potential downside risks as a bearish outlook emerges, primarily due to the formation of a double top pattern on the 1-hour timeframe. This pattern typically indicates a potential trend reversal and suggests that the buying momentum may be weakening.
With the double top pattern in place, there is a higher probability of a downward price movement in the EUR/USD pair. The first target of 1.0840 indicates a potential decline towards that level, while the suggested stop loss at 1.0954 acts as a safeguard against further losses.
Looking forward to read your opinion about it!

EURJPY Breakout Trade IdeaEURJPY Breakout Trade, place buy and sell stop.
Manage your risk according to Account Size!
