Market next move ⚠️ Disruption Analysis of the Chart
1. False Breakout Risk
The price is currently within an ascending channel, which is often seen as bullish.
However, the recent candlesticks show smaller bodies with wicks on top, indicating buyer exhaustion.
A false breakout above the upper trendline or support around 1.3632 could trap buyers before a sharp reversal.
2. Low Volume Confirmation
Volume peaked earlier but has significantly decreased in the last few candles.
Weak volume during a price rise signals a lack of conviction, increasing the likelihood of a pullback.
3. Resistance Flip Not Confirmed
The level around 1.3600 is marked as resistance-turned-support, but there is no strong retest confirmation yet.
If price revisits this zone and fails to bounce, this support could break, leading to a downside reversal.
4. Divergence Watch
While not visible in this static image, if you overlay RSI or MACD, there could be signs of bearish divergence (price making higher highs while momentum indicators make lower highs).
This is often a leading indicator of trend weakening.
Forextarget

Market next target 🔁 Disrupted Analysis (Bullish Scenario Instead of Bearish)
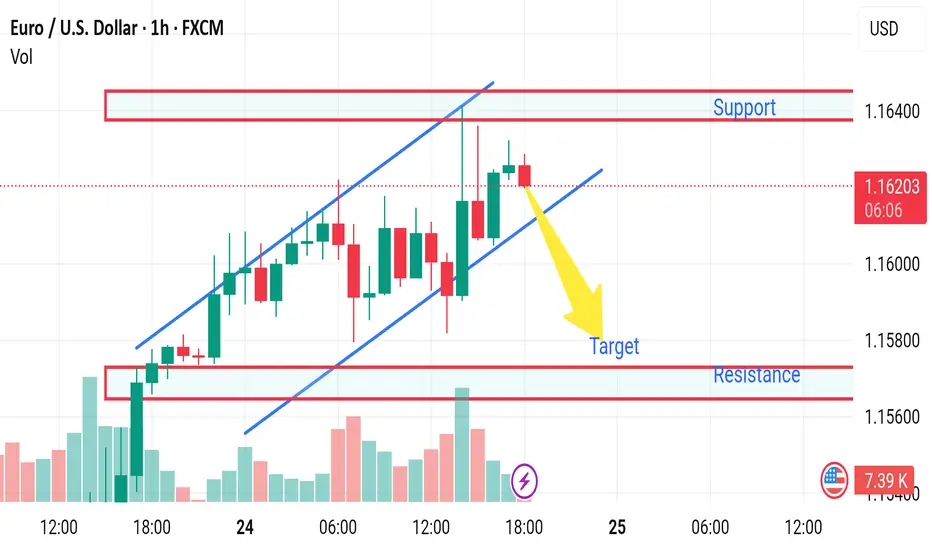
1. Price in an Upward Channel:
The price remains within a clear ascending channel, respecting both upper and lower bounds.
The bearish arrow prematurely predicts a breakdown while no support break has occurred.
2. Strong Bullish Momentum:
Price is making higher highs and higher lows, a textbook bullish structure.
The recent dip respected the lower trendline and was followed by strong green candles.
3. Volume Confirmation:
Notice the increasing bullish volume on the recent push higher.
That suggests buyers are still in control, contradicting the bearish prediction.
4. Invalidation of Bearish Breakdown:
Until the lower blue trendline is clearly broken with volume, the bearish target is speculative.
Support is holding at 1.1610–1.1600 zone, which may become a launchpad for further gains.
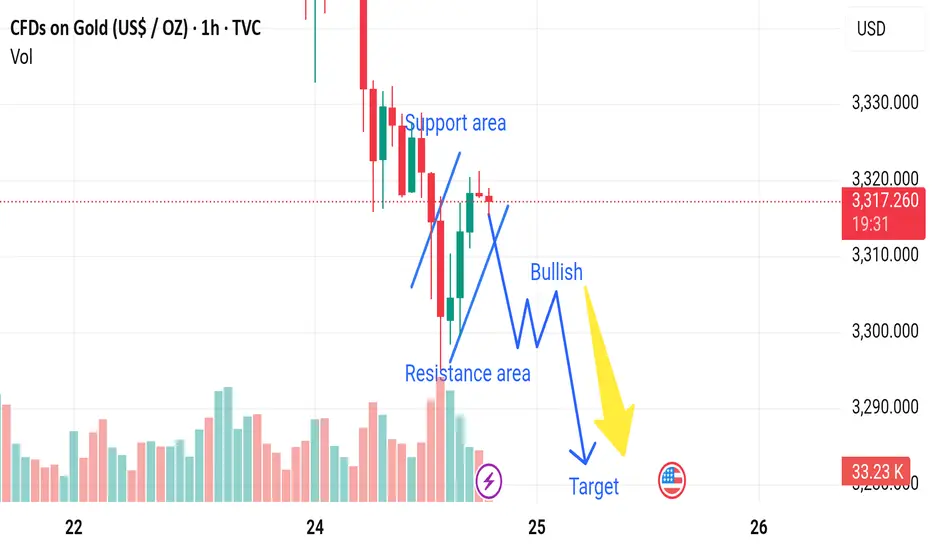
Market next move 🔁 Disrupted Analysis (Bullish Scenario Instead of Bearish)
1. Support Holding Firm:
The analysis assumes the price will drop after failing resistance, but the current price action is showing higher lows, suggesting accumulation.
The support area has been tested multiple times, showing strength.
2. Volume Analysis Contradiction:
Recent green volume bars indicate buying interest at lower levels.
No significant volume spike on the last downward leg, suggesting lack of strong selling pressure.
3. Potential Inverted Head and Shoulders:
The current formation could be the right shoulder of an inverted head and shoulders pattern, a classic bullish reversal setup.
If confirmed, this could lead to a breakout above the resistance area, not a drop.
4. Trendline Breakout Watch:
There's a potential bullish breakout of the descending trendline.
A break above 3,320 USD could invalidate the bearish thesis and suggest a target near 3,340–3,350 USD.

Market next target 🔁 Disrupted Analysis (Bullish Scenario Instead of Bearish)
1. Support Holding Firm:
The analysis assumes the price will drop after failing resistance, but the current price action is showing higher lows, suggesting accumulation.
The support area has been tested multiple times, showing strength.
2. Volume Analysis Contradiction:
Recent green volume bars indicate buying interest at lower levels.
No significant volume spike on the last downward leg, suggesting lack of strong selling pressure.
3. Potential Inverted Head and Shoulders:
The current formation could be the right shoulder of an inverted head and shoulders pattern, a classic bullish reversal setup.
If confirmed, this could lead to a breakout above the resistance area, not a drop.
4. Trendline Breakout Watch:
There's a potential bullish breakout of the descending trendline.
A break above 3,320 USD could invalidate the bearish thesis and suggest a target near 3,340–3,350 USD.
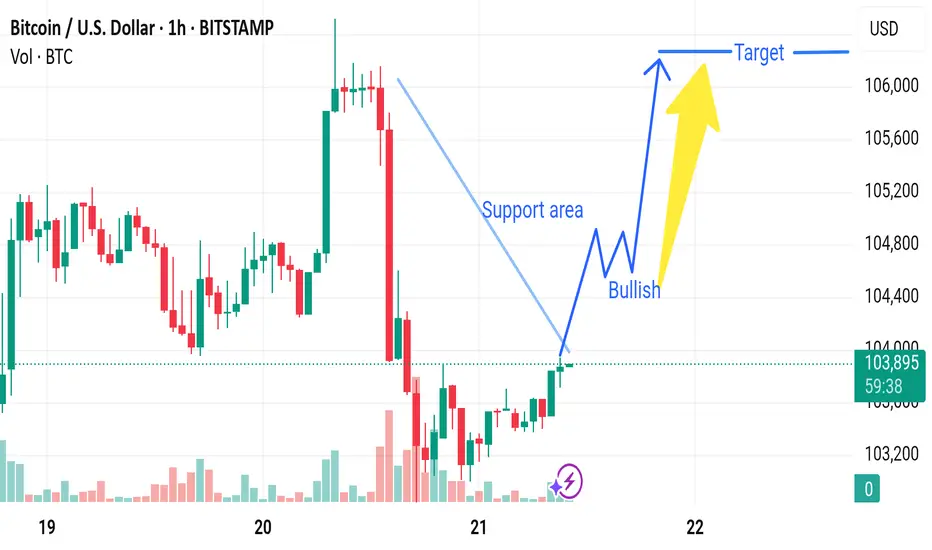
Market next target 🔄 Disruption Analysis:
1. Weak Support Confirmation
The chart marks a "Support area," but there is no strong confirmation (e.g., a hammer or engulfing bullish candle with high volume).
Support zones are more reliable with multiple prior bounces; here, it seems newly identified and not yet validated.
2. Bearish Volume Signature
During the recent decline (before the support), the red volume bars are significantly larger, indicating strong selling pressure.
The recovery candles near support have low volume, which may signal lack of conviction from bulls.
3. Lower Highs Formation
Prior to the drop, we see a series of lower highs, hinting at weakening bullish momentum.
This could suggest a potential bearish continuation, especially if price fails to break above the last local high (~106,000).
4. Possible Bearish Retest
Instead of a bullish breakout, the current price might just be retesting the broken support-turned-resistance.
This is a common bull trap scenario where prices bounce slightly before resuming downward.
Market next move Disruption to Bullish Scenario:
1. Resistance Zone Around 1.1540 – 1.1550
The price is approaching a psychological and potential resistance level around 1.1540–1.1550.
If the bulls fail to break this zone convincingly, a rejection could lead to a pullback or reversal.
2. Bearish Divergence in Volume
Despite upward movement in price, the volume doesn't show a strong bullish breakout. If momentum weakens while price rises, it might indicate a bearish divergence.
3. Rising Wedge Formation
The current price channel resembles a rising wedge, which is typically a bearish pattern.
A breakdown from this pattern (below the “support area” trendline) could trigger a sell-off toward 1.1500 or lower.
4. Economic Data or News Risk
Any sudden USD strength due to economic reports, Federal Reserve commentary, or geopolitical tension could flip the sentiment instantly.
Icons below the chart hint at upcoming news from the Eurozone or U.S., which could lead to volatility.
5. Overbought Condition
If technical indicators like RSI or MACD (not shown in this chart) are in overbought territory, a correction or profit-taking may happen soon.

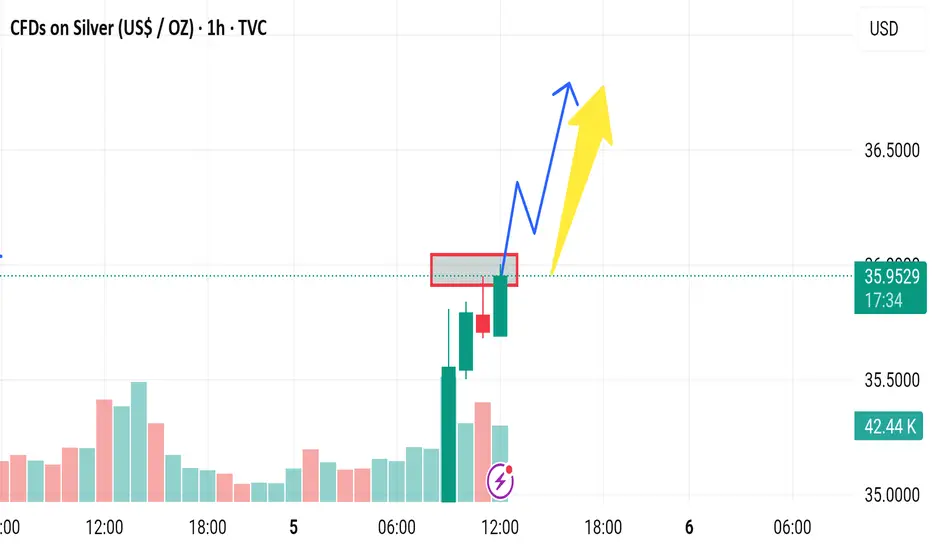
Market next move 🔄 Disruption: Bullish Setup Building?
🧠 Problems With Bearish Interpretation:
1. Volume Surge Might Be Re-Accumulation:
Volume at the purple lightning symbol is rising — this could signal buyer interest, not distribution.
Green candles in this zone suggest aggressive buying on dips.
2. Failed Breakdown Earlier:
Price had a strong drop but bounced sharply, recovering nearly all losses.
That type of V-recovery often traps early shorts, leading to a rally.
3. Resistance Retest Might Be Breakout Setup:
The red box marks resistance, but price is consolidating just below it.
That’s typically bullish if no strong rejection occurs — classic “base before breakout.”
4. No Lower Low Yet:
Market structure still holding.
Until price breaks below ~$35.80, the bearish thesis remains speculative.
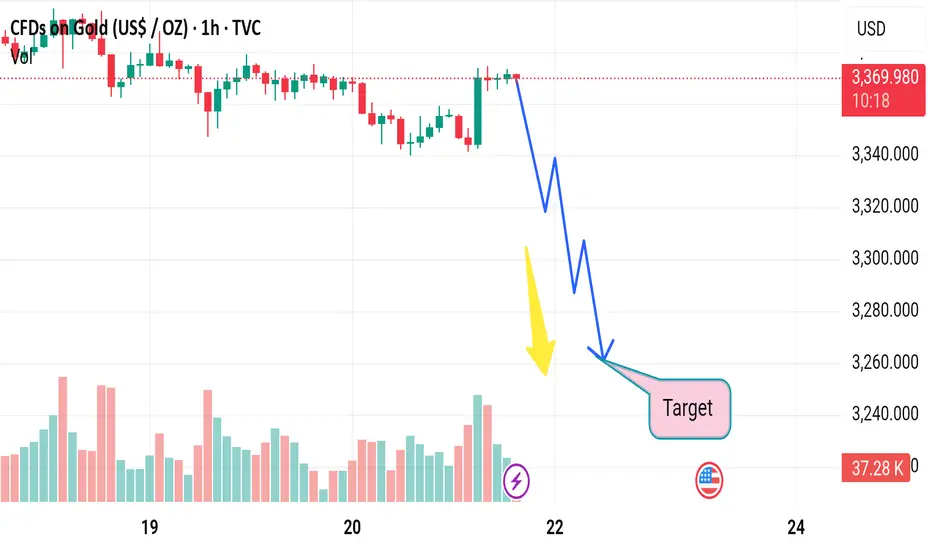
Market next target 📉 Original View (Bearish Outlook):
Predicts a downward move from around $3,370 to the target near $3,250.
Sharp drop illustrated with zigzag downward arrows.
Yellow arrow highlights growing volume — likely interpreted as early selling pressure.
---
🔄 Disruption: Bullish Reversal or Trap Setup
🧠 Problems With Bearish Thesis:
1. Volume Spike Might Indicate Demand:
The yellow arrow highlights a volume surge, but this might be buyer absorption, not selling dominance.
If this volume came during a wick-heavy candle or hammer, it suggests buying interest at lows.
2. No Break of Major Support Yet:
Price is still above $3,350, a key psychological and technical zone.
No clear breakdown has occurred — the downtrend is assumed, not confirmed.
3. Oversold Momentum?
Momentum indicators (not shown) may reveal oversold conditions, making a short-term rebound more probable.
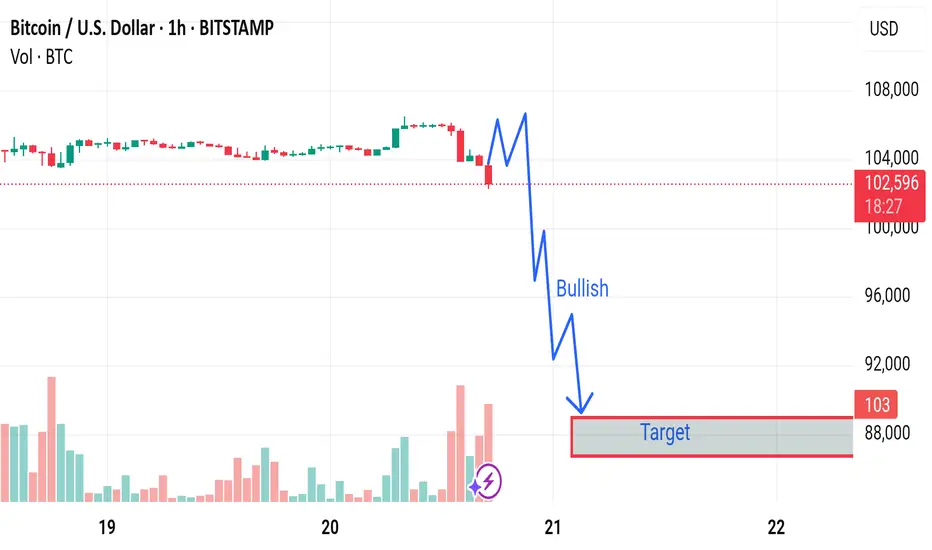
Market next move 🔄 Disrupted Analysis: Bullish Counter-Scenario
🧠 Original Bias:
The chart predicts a strong bearish move, with a target around 88,000 USD.
The label "Bullish" seems misleading as it’s placed in a steep downward move.
---
📉 Issues With the Original Analysis:
1. Volume Misinterpretation:
Increasing red volume could indicate capitulation or a temporary panic sell-off, not necessarily the start of a new trend.
A bounce could follow if buyers step in.
2. Support Zone Ignored:
The analysis overlooks any previous support levels in the 100k–98k range, where buyers may be waiting.
3. No Confirmation for Breakdown:
The chart does not show a completed breakdown of a key structure or trendline.
The blue squiggle assumes a breakdown will happen, but no technical confirmation is visible.
---
📈 Disruption Scenario: Bullish Reversal Possible
Rejection from 102k zone could be a liquidity grab, not the start of a downtrend.
Hidden bullish divergence on RSI or MACD (not shown here) could support a bounce.

Market next forecast 🔄 Disrupted Analysis: Bullish Counter-Scenario
🧠 Original Bias:
The chart predicts a strong bearish move, with a target around 88,000 USD.
The label "Bullish" seems misleading as it’s placed in a steep downward move.
---
📉 Issues With the Original Analysis:
1. Volume Misinterpretation:
Increasing red volume could indicate capitulation or a temporary panic sell-off, not necessarily the start of a new trend.
A bounce could follow if buyers step in.
2. Support Zone Ignored:
The analysis overlooks any previous support levels in the 100k–98k range, where buyers may be waiting.
3. No Confirmation for Breakdown:
The chart does not show a completed breakdown of a key structure or trendline.
The blue squiggle assumes a breakdown will happen, but no technical confirmation is visible.
---
📈 Disruption Scenario: Bullish Reversal Possible
Rejection from 102k zone could be a liquidity grab, not the start of a downtrend.
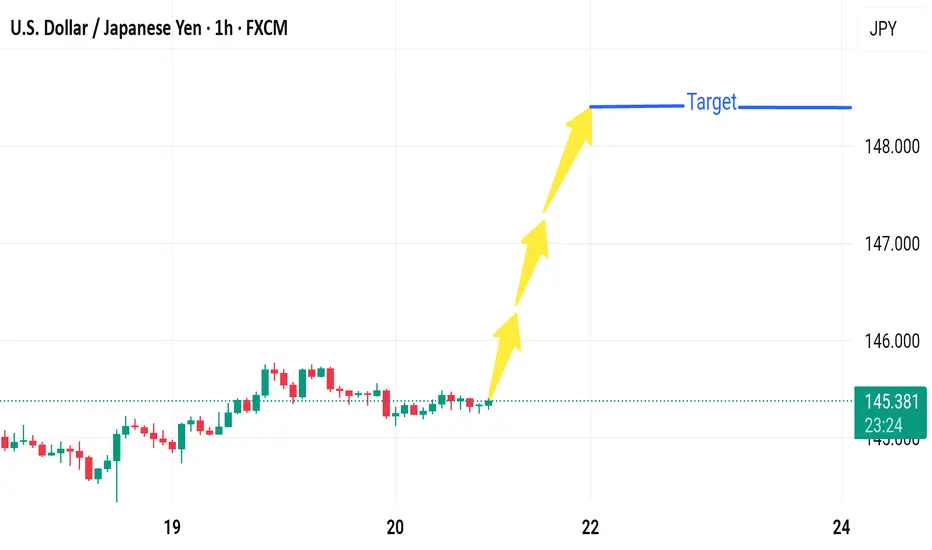
Market next move 🔻 Disruptive Analysis – Bearish Scenario
1. Resistance Rejection:
Price has stalled around 145.40, showing hesitation.
The target area (~148.000) hasn't been tested yet, and prior attempts to break higher may face heavy resistance from institutional sell orders or prior supply zones.
2. Range-Bound Structure:
Current price action shows consolidation — multiple small-bodied candles.
Lack of volume or momentum may indicate accumulation or distribution — not necessarily a bullish breakout setup.
3. Potential Bearish Triggers:
If price breaks below 145.00, a short-term bearish move could occur toward:
144.30 – recent swing low support.
143.80 – demand zone based on prior accumulation.
4. Macro Disruptors:
Surprise BoJ intervention or hawkish policy tone could strengthen the Yen.
A dovish Fed statement or poor U.S. economic data could drag USD down sharply.
---
📉 Alternate Scenario Chart Sketch (Hypothetical):
148.000 ──────── (Target denied - strong resistance)
↑
Rejection
↓
145.000 ──────── (Breaks support)
↓
144.300 ──────── (First bearish target)
↓
143.800 ──────── (Deeper retracement zone)
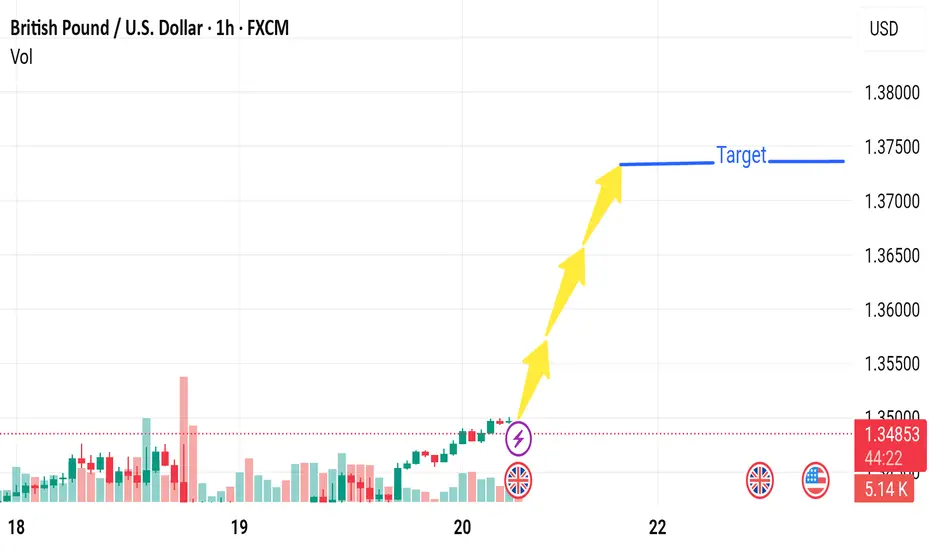
Market next target
🔻 Bearish Disruption Analysis
1. Overbought Conditions / RSI Exhaustion
The recent bullish momentum appears strong, but it could be entering overbought territory, especially on the 1-hour chart.
A correction may follow if technical indicators like RSI or MACD start diverging.
2. Resistance Zone at 1.35000 - 1.35500
The price is nearing a historical resistance area around 1.3500–1.3550, where sellers have previously stepped in.
Without strong volume or a news catalyst, this zone may reject further upside movement.
3. Low Volume Breakout
The breakout visible before the arrows is accompanied by relatively moderate volume, which can indicate a false breakout or bull trap.
4. Fundamental Uncertainty
Upcoming U.S. or UK economic data (indicated by the flags on the chart) could disrupt the expected bullish move.
Example: A strong USD labor report or hawkish Fed comment could reverse the GBP/USD rally.
Market next move 🟥 Disrupted Analysis: Bearish Divergence on EUR/USD (1H)
Weak Support Zone:
The price labeled as "Support" was never a well-tested zone. It appears to be a minor structure, and the bounce lacks strong confirmation or significant volume.
Volume Decline During Rise:
The recent upward candles show shrinking volume, a sign that the buying momentum is weakening, not strengthening. Bulls are losing energy.
Potential Double Top Formation:
If price action near current levels stalls, a double top could form, which is a classic bearish reversal pattern. Watch for rejection below 1.1550.
Bearish Target Zone (if reversal begins):
First target: 1.1450 (minor support)
Break below that opens 1.1370 zone (volume support area)
---
📉 Disrupted Price Path (Opposing the Yellow Arrow)
Rejection
↓
┌─────────┐
│ ▼
│ Pullback to "Support"
▼ │
Breakdown │
▼ │
Target Zone ▼

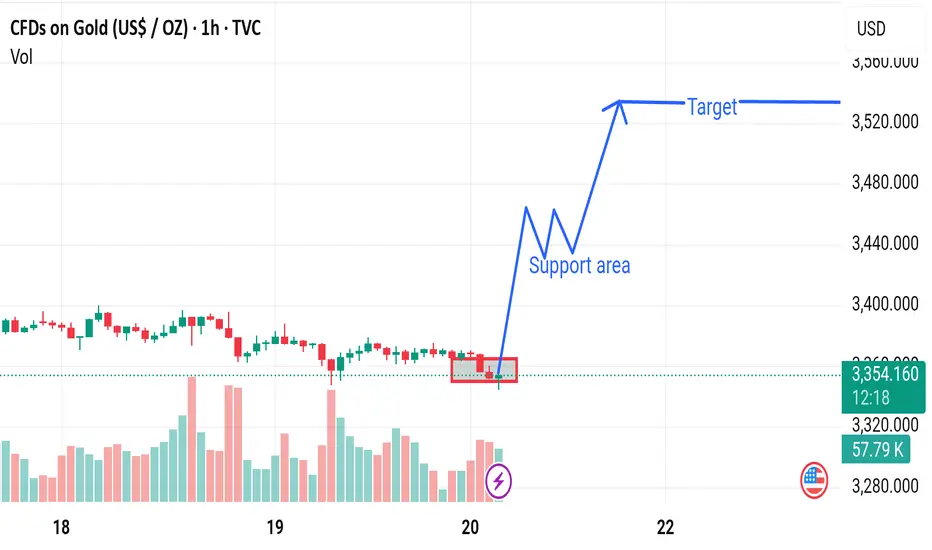
Market next target Disrupted Analysis: Bearish Outlook on Gold CFDs (1H Chart)
Support Breakdown Imminent:
The price is repeatedly testing the support area marked in red. Instead of holding strong, this indicates weak buyer interest. Volume is not spiking in support, showing no accumulation behavior.
Volume Divergence:
Despite prices consolidating near support, volume is decreasing, suggesting lack of conviction from bulls. This often precedes bearish breakdowns.
Bearish Targets:
If the current level at 3,352.990 breaks down decisively:
Immediate target: 3,320.000
Extended bearish move: 3,280.000 (prior demand zone)
Price Action Signals:
Lower highs forming consistently.
No bullish engulfing or reversal candles in sight.
Stronger bearish momentum candles (long red bodies with volume).
---
📉 Suggested Disruption Chart Path (Instead of Bullish Arrow):
Support Area
↓
┌───────┐
│ │
▼ │
Breakdown │
▼ │
Retest Fail │
▼ │
Bearish Slide▼
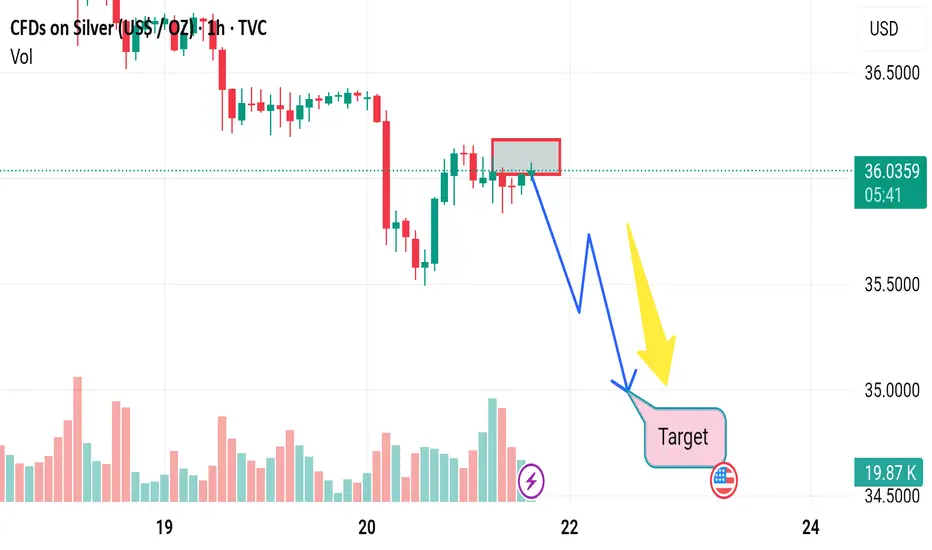
market next move 🔻 Bearish Disruption Perspective:
1. Breakdown of the Support Zone
The highlighted red box is acting as support.
However, multiple retests of this zone indicate weakening support.
If price breaks below ~$35.50 decisively, it could trigger a bearish continuation.
2. Low Volume on Recent Candles
Volume appears to be declining during the latest consolidation phase.
A bullish breakout ideally requires increasing volume, which is not evident here.
This could indicate lack of buyer interest at this level.
3. Downtrend Momentum
The price is in a clear short-term downtrend (series of lower highs and lower lows).
Without a strong reversal signal (like a hammer, bullish engulfing), expecting a breakout may be premature.
4. Fundamental Risk Factors
Silver often reacts strongly to:
Interest rate decisions
USD strength
Inflation data

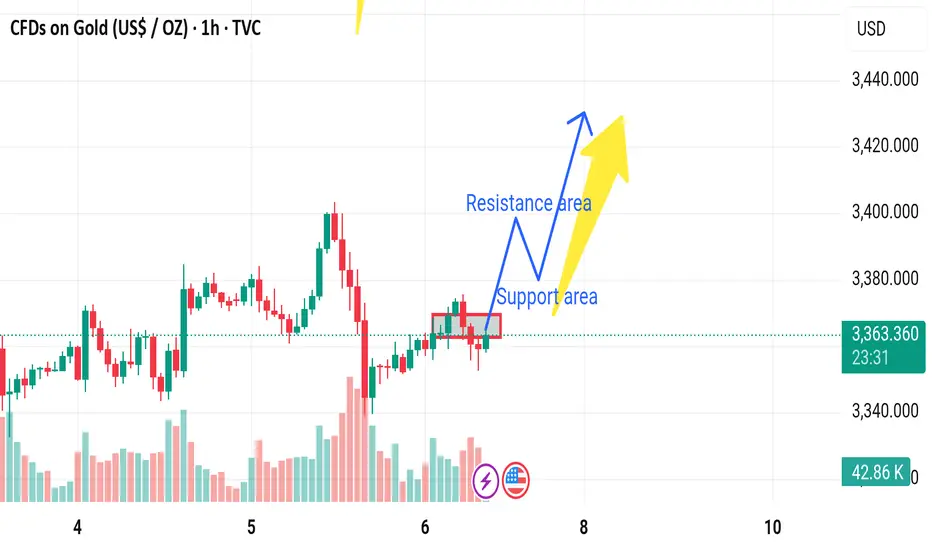
Market next move Bearish Disruption Analysis:
1. False Breakout Risk:
The current price is consolidating in a tight range.
The support area may fail to hold due to low volume and indecision (notice the decreasing volume in recent candles).
2. Lower High Formation:
A potential lower high is forming compared to the peak from earlier on June 5.
This could signal a trend reversal or weakening bullish momentum.
3. Volume Divergence:
The bullish candles have lower volume than previous strong moves, indicating a lack of strong buying interest.
4. Support Breakdown Scenario:
If price breaks below the marked support area (~3360), we could see:
Drop toward the 3340 area (next visible support).
Acceleration if stop-losses are triggered below the support zone.
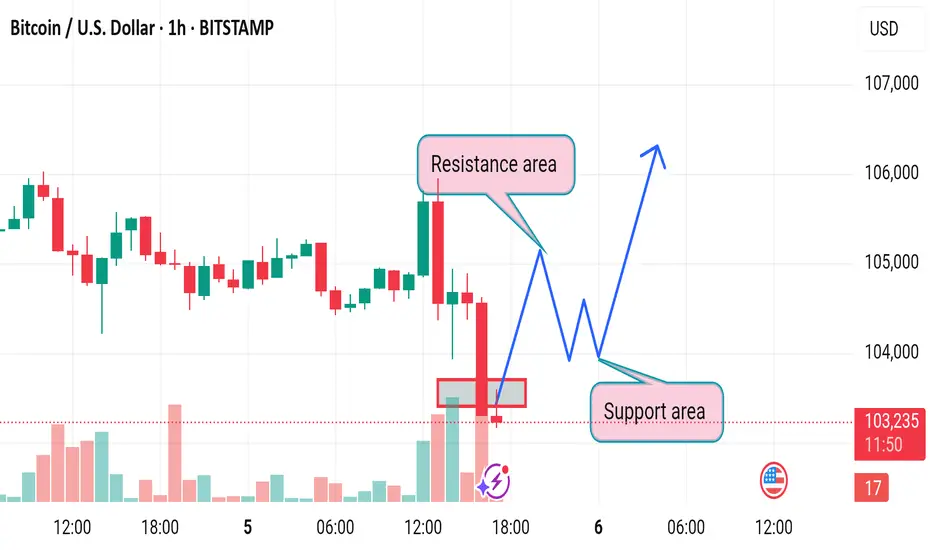
Market next move 🔍 Original Interpretation:
Support Zone: The red rectangle suggests a support level between ~102,800 and ~103,300.
Bullish Bias: The blue arrow anticipates a bounce from this zone, potentially forming a higher low before continuing upward.
Bearish Bias: The red arrow marks a potential resistance, predicting rejection and a move lower if the bullish breakout fails.
---
⚠️ Disruptive Analysis:
1. False Support Breakout Risk:
A false breakdown beneath the support zone could trigger panic selling before a rapid recovery (fakeout).
Traders might place stop-losses just below the box — a perfect target for market makers before price reverses.
2. Volume Deception:
Volume increased during the sell-off but did not show strong absorption by buyers (green volume wasn't dominant).
This suggests sellers still dominate and a continuation lower could occur before any bounce.
3. Lower Highs Formation:
The last few green candles failed to break the previous highs, indicating weaker buying strength.
Price may form a lower high, hinting at a short-term bearish trend.
4. Macro Trend Consideration:
If this is just a retracement within a larger downtrend, the bounce could be short-lived.
Broader market sentiment or macro news could push BTC toward 100,000 support or lower.
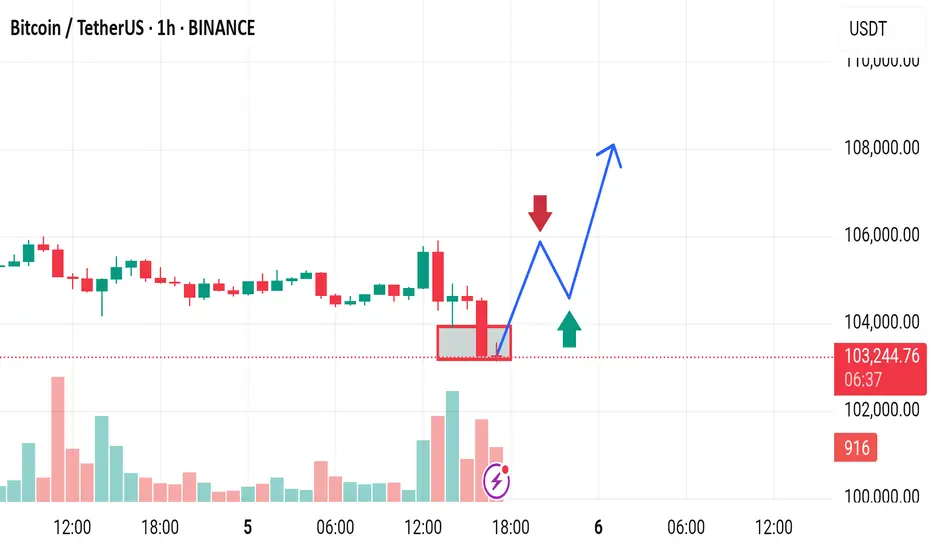
Market next move Disruptive Bearish Scenarios:
1. Support Area Breakdown
The recent strong bearish candle with high volume shows aggressive selling pressure.
If the price fails to hold above the support area and closes below it, especially on high volume, it could invalidate the bullish recovery.
> Bearish Alternative: Price breaks below 103,000, retests it as resistance (bearish flip), and continues down toward 101,000–100,000.
---
2. Lower High Trap
The projected bounce could form a lower high below the 106,000 resistance, creating a classic bearish structure.
> Disruption Path: After a minor recovery toward 104,500–105,000, sellers regain control, and BTC resumes the downtrend.
---
3. Fake Support Bounce
The support area could create a fake-out bounce, tricking long traders before a sharper reversal.
The move up may lack follow-through due to diminishing bullish volume.
Market next move Disruption Points:
1. Bullish Accumulation Underway
The recent candles show higher lows and lower volume on red candles, suggesting selling pressure is decreasing.
> Disruptive scenario: Price may bounce off minor support (around 1.3560–1.3570) and form a higher low, triggering a bullish rally back above 1.3620.
---
2. Fake Bearish Setup (Liquidity Trap)
The three arrows predicting a drop might represent a classic retail trap where too many anticipate the same direction.
> Contrary idea: A false breakdown below 1.3550 may occur just to collect stop-losses, followed by a strong reversal upward.
---
3. Divergence Risk
If momentum indicators (e.g., RSI, MACD) show bullish divergence while price moves sideways or dips, it may signal an upcoming bullish impulse.
> Disruption: Downward arrows may be misinterpreting consolidation as weakness rather than a setup for continuation of the previous uptrend.
---
4. Fundamental Wildcard
The chart shows an upcoming U.S. economic event, likely to impact the dollar.
If the data is weak for the USD, GBP/USD could surge sharply, invalidating the bearish scenario.

Market next target 🧨 Disruption Points:
1. Overbought Condition / RSI Divergence
Even though the price is surging (+3.30%), there could be an overbought condition forming.
If RSI or other momentum indicators (not shown here) diverge, it might signal weakness in bullish momentum.
> Disruptive idea: Price may fake the breakout (blue arrow) and then sharply reverse, trapping late buyers.
---
2. False Breakout Trap
The red-box area could be a liquidity zone where smart money might induce a fake breakout before dumping.
> Alternative path: Price breaks above temporarily (as in blue path), but then reverses violently back into the range, forming a “bull trap.”
---
3. Volume Anomaly
The volume appears to be decreasing on recent bullish candles after the initial spike.
This suggests that the uptrend may be losing strength, making the yellow arrow scenario less likely.
> Contrary outlook: Lack of volume confirmation could mean a sideways consolidation or reversal is more probable.
---
4. News/Event Risk (Fundamental Disruption)
The chart shows an upcoming economic event (U.S. flag icon), possibly Non-Farm Payrolls (NFP), interest rate news, or CPI.
These events could cause extreme volatility and invalidate all technical patterns.

Market next move 🔍 Bearish Disruption Perspective
1. Supply Zone Rejection
The red box marks a strong resistance zone. Current price action shows rejection at that level (long upper wicks).
This signals that sellers are defending this zone, increasing the likelihood of a false breakout.
2. Exhaustion After Strong Rally
The massive green candle just before the resistance may have exhausted short-term buying power.
Without a clear consolidation or volume surge, the price could reverse or retrace to gather strength.
3. Volume Discrepancy
Volume spikes with price often suggest conviction. However, this chart shows moderate volume on the test of resistance—not enough to confirm breakout strength.
4. Bearish Candlestick Pattern
The small red candle following the green surge could be forming a bearish engulfing or rejection candle, depending on the close.
Market next move 🔍 Disruptive Technical Perspective
1. Overextension After Rally
The current sharp upward move may be overextended.
Lack of consolidation suggests the rally may be unsustainable without a pullback to test support.
2. Volume Divergence
While price is rising, the volume bar at the most recent candle is not increasing proportionally.
This signals weakening momentum, which often precedes a reversal or consolidation.
3. Unconfirmed Breakout
The chart doesn't clearly show a confirmed breakout above a significant resistance zone.
This could indicate a potential fakeout rather than a true breakout.
4. Potential Double Top Formation Risk
If price stalls near current levels and pulls back, a double top pattern might form—often a bearish reversal signal.
A drop back below $3,380 could trigger heavy selling.
