Market next move
1. False Breakout / Bull Trap Risk
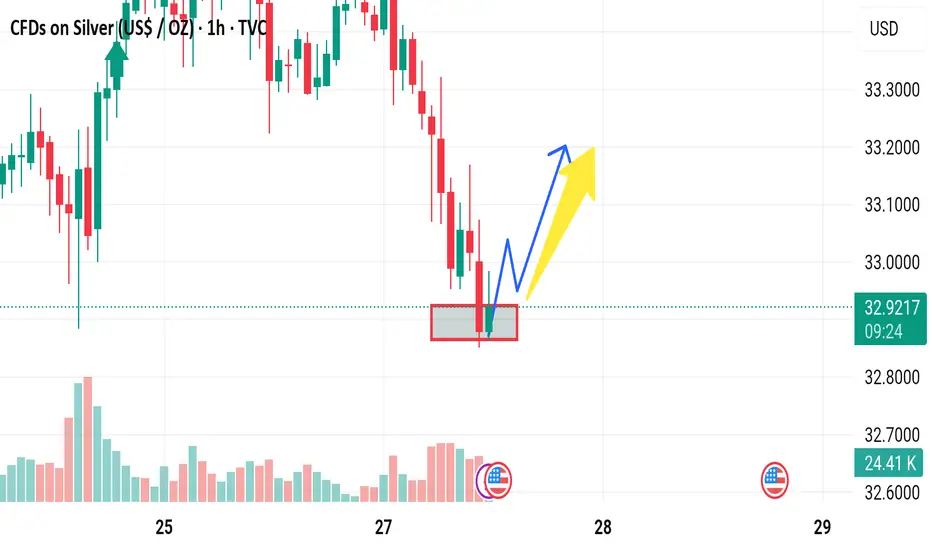
Observation: Price just touched the support and bounced slightly.
Disruption: If buyers fail to push above the next resistance (around 32.95–33.00), it could be a bull trap.
Implication: The bounce might just be a short-covering rally before another leg down.
---
2. Weak Buying Volume
Observation: The bounce lacks strong green volume bars so far.
Disruption: Weak volume on the bounce suggests limited buyer conviction.
Implication: Without a volume surge, the upward move could fizzle out quickly.
---
3. Lower High Structure
Observation: The trend before the support touch is clearly down.
Disruption: This bounce may only form a lower high before continuation lower.
Implication: The larger trend remains bearish unless 33.20+ is reclaimed with strength.
---
4. Fundamental Headwinds
Disruption: Any upcoming data like strong USD, rising interest rates, or weak industrial demand could push silver down despite technical setups.
Implication: Bullish setups could fail fast due to macroeconomic pressure.
Forextarget
Market next move
1. Potential Bear Trap Scenario
Observation: The highlighted consolidation area could be a support zone.
Disruption: If the price quickly reclaims and holds above this zone (around 3,292), it could be a bear trap. This might attract buyers looking for a false breakdown reversal.
Implication: This could lead to a short-term rally instead of continuation lower.
---
2. Volume Divergence
Observation: Despite the breakdown, the selling volume seems to taper off compared to the previous heavy down move.
Disruption: Lower volume on a breakdown can signal weakening bearish momentum. Price might consolidate or even reverse.
Implication: Watch for bullish volume spikes as a sign of reversal interest.
---
3. Oversold RSI or Momentum Indicators
Disruption: If momentum indicators like RSI (not visible on this chart) show oversold conditions, this may suggest a relief bounce is more likely than further immediate downside.
Implication: Short-term traders could get trapped if they short too late.
---
4. Fundamental Triggers
Disruption: Any sudden positive news for gold (e.g. economic uncertainty, lower bond yields, central bank demand) can reverse this technical setup quickly.
Implication: Be cautious trading solely on technicals in sensitive markets like gold.

Market next target ---
Bearish Disruption Analysis
1. False Breakout Zone (Red Box Area):
The price is revisiting the red box area (potential supply/resistance zone). If it fails to break and close above this zone convincingly, it may signal a bull trap.
Previous attempts to push higher were rejected around this level, showing seller strength.
2. Lower High Formation Risk:
The recent upward move might form a lower high compared to the high from the 25th.
If price reverses below $33.30–$33.20, it could trigger more downside momentum, potentially targeting the $33.00 or even $32.80 level.
3. Volume Divergence:
Notice the decline in volume as price attempts to rise. Lower buying volume may indicate weak bullish conviction, which increases the risk of a downturn.
4. Bearish Candlestick Reversal Pattern:
If any bearish engulfing or shooting star candlestick forms near resistance, it would support a bearish reversal case.

Market next move
Disruption of the Bullish Bias:
1. False Breakout Risk
The area marked with a red rectangle might be showing signs of consolidation, but there's a possibility that the bullish breakout is a bull trap.
Volume does not strongly confirm a breakout; note that the volume on the recent upward candles is not significantly higher than the surrounding bars — often a sign of weak buyer conviction.
2. Resistance Overhead
BTC is approaching the psychological level of 110,000, which may act as resistance.
Price action shows several small-bodied candles with wicks, indicating indecision or rejection from higher levels.
3. Bearish Divergence Potential
If paired with RSI or MACD indicators (not visible in this image), there might be signs of bearish divergence — price making higher highs while the indicator makes lower highs.
4. Liquidity Sweep Scenario
The recent wick into the highlighted zone could be a liquidity sweep — grabbing stop-losses before reversing downward.
This would support a bearish move contrary to the bullish forecast.
5. Market Sentiment & Fundamentals
Ignoring macro events such as Fed decisions, ETF movements, or regulatory news can be dangerous. If bearish news breaks out, technical setups can fail fast

Market next target Original Analysis Summary:
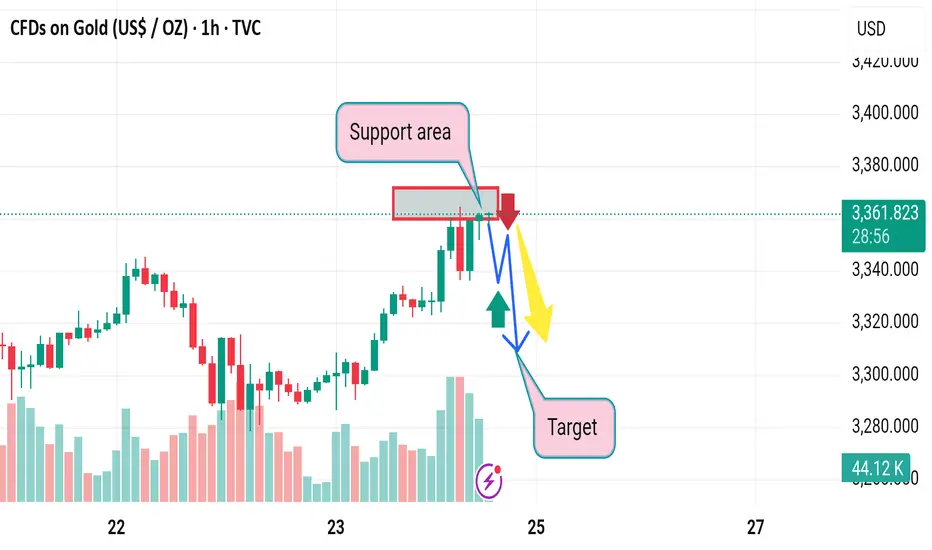
Support Area Identified: Around 3335.
Expected Scenario: Bounce from support leading to a bullish move toward the "Target" zone.
Two Paths Shown: A direct bounce (yellow) or a fakeout/drop below support followed by a bullish reversal (blue arrow).
---
Disruption Analysis: Bearish Scenario
1. Support Breakdown:
Instead of bouncing at the support area (~3335), the price fails to hold and breaks down below.
Increased volume or bearish momentum could lead to this breakdown.
2. New Target Zone:
If support is broken, the next key demand zone may lie around 3300 or below, making that the new target.
Traders expecting a bounce may get trapped (bull trap), adding to sell pressure.
3. Invalidation of Bullish Setup:
The presence of consecutive lower highs leading into the support area could indicate weakening bullish momentum.
A retest of the broken support as new resistance would confirm the shift in structure (support becomes resistance).

Market next target Original Analysis Summary:
Support area at ~1.1400 holding price.
Expectation: Bounce off support and continuation to higher target.
Arrows indicate a bullish bias after minor retracement.
---
Disruptive Bearish Interpretation:
1. Exhaustion at Top:
Strong upward rally could be showing signs of buying exhaustion, especially after the sharp vertical move.
The current top wick suggests rejection from higher levels.
2. Bearish Reversal Candles:
If a shooting star or bearish engulfing pattern forms near the target area, it could signal a reversal.
The current candle shows a long wick, which often precedes pullbacks.
3. False Breakout Risk:
The price could have broken above a resistance level only to trap breakout buyers before reversing downward.
This would trigger a move below the red box (support area).

Market next target 1. Mislabeling of Support Area
The red box is labeled as a support area, but price is approaching from below, not above—so technically, this should be called a resistance area.
Until price closes above it with volume, it cannot be assumed to act as support.
---
2. Volume Misinterpretation
The volume does not strongly support a breakout. The latest green bars are not significantly larger than prior volume, implying limited bullish conviction.
Lack of volume surge through resistance is often a false breakout indicator.
---
3. Single Scenario Bias
The analysis shows only an upside (bullish) projection, ignoring bearish possibilities.
If price gets rejected from resistance, there’s a strong chance of a pullback to $33.00 or lower, especially with weak momentum.
---
4. No Confirmation Indicators
The chart lacks confirming technical indicators like RSI, MACD, or trendlines to validate the bullish scenario.
Price could be forming a lower high, indicating a possible continuation of the downtrend.

Market next target
1. Misinterpretation of Support Area
Claimed support area has already been broken previously (left of the red box), so it's no longer strong support—it might be better viewed as resistance now.
The bounce from this zone could be a liquidity trap or a fakeout, rather than genuine buying interest.
---
2. Overreliance on a Single Target Zone
The chart implies a clear target zone below, but no Fibonacci, moving average, or volume profile is shown to validate this zone.
A better analysis might include additional tools (like RSI, Bollinger Bands, or Fibonacci levels) to confirm this as a realistic target.
---
3. Volume Analysis Oversight
There is a volume spike on the most recent bullish candles, which could indicate strong buying interest, contradicting the downtrend expectation.
This might suggest a potential breakout above resistance instead of a fall.
---
4. No Risk Management Consideration
The chart lacks stop-loss levels or invalidation points, which is crucial for trading strategies.
Without a clear invalidation, the trade idea becomes more speculative.
---
5. Alternative Scenario Missing
A bullish breakout scenario (above resistance zone) isn’t given enough weight.
Given the recent strength, there is a strong case for continuation upward if the price closes above the red box with volume.
Market next move Current Analysis Summary:
Bullish Outlook: The chart suggests a bullish trend after price moves above a marked support area.
Price Scenarios:
Red arrow: Pullback to support.
Blue arrow: Bounce back upward.
Yellow arrow: Continuation of the bullish trend.
---
Disruption of the Analysis:
1. False Breakout Risk:
The move above the support zone might be a false breakout. Volume does not appear significantly increased during the breakout, which is typically needed to confirm real breakout momentum.
2. Volume Confirmation Lacking:
Although some volume is present, the breakout does not show a clear volume spike to validate strong buying interest, which challenges the bullish bias.
3. Resistance Overhead Ignored:
No mention of overhead resistance. The price may face selling pressure near 1.35000, a likely psychological and technical resistance area.
4. Over-reliance on Simple Support Zone:
The support zone is too narrowly defined. If the price dips below it slightly, it could still be a healthy retest, not a reversal, which the red arrow path implies prematurely.

Market next move
1. Overreliance on Basic Support/Resistance
Issue: The analysis uses a simple support/resistance concept without clear validation (e.g., no multiple touches or volume confirmation).
Disruption: Support could easily break if there's insufficient volume or strong bearish sentiment, invalidating the buy signal.
---
2. Lack of Confirmation Indicators
Issue: There's no use of confirmation tools like RSI, MACD, or moving averages.
Disruption: Entering a "Buy" based purely on support without a reversal signal (like bullish divergence or candle patterns) increases risk.
---
3. Premature Target Setting
Issue: The target is drawn quickly after a minor dip, with no fib levels, pivot points, or historical resistance considered.
Disruption: The price might face resistance before reaching the “Target,” especially around previous highs or psychological levels.
---
4. Ignoring Downside Risk
Issue: The scenario assumes price will bounce back but doesn’t show a stop-loss or contingency for a breakdown.
Disruption: If price breaks the "Support" zone, it could trigger a stronger bearish move—this risk is not accounted for.
---
5. Misleading Arrows
Issue: Arrows (red, yellow, blue) seem speculative and oversimplified.
Disruption: They imply a clear path, which can mislead traders into thinking price action follows linear logic—real markets are more chaotic.

Market next move Disruption (Bearish/Contrarian Outlook):
1. Bearish Divergence:
If RSI or MACD (not shown) is diverging (price making higher highs, indicator making lower highs), this could signal weakness in the uptrend.
2. Rising Wedge Pattern:
The channel might be interpreted as a rising wedge, which is often a bearish reversal pattern, especially if volume declines as price rises.
3. Strong Resistance Zone:
The red rectangular zone could act as major resistance, potentially causing a false breakout or rejection rather than continuation.
4. Volume Discrepancy:
Despite the bullish move, if volume is not increasing proportionally, it might indicate a lack of conviction.
5. Potential Breakdown Path:
Price breaks below the support zone (blue trendline).
Falls to test the previous consolidation zone around $3,300 or lower.
Bearish Scenario Path (Disrupted View):
Red arrow moves sharply down through support.
New target: $3,300 or lower (next visible support).

BTCUSD (BTC/USD) highlights a consolidation phase within clearly defined support and resistance zones, with price currently poised for a potential move upward.
Key Technical Zones:
- Resistance Area: Around 95,576, which has been tested multiple times with rejections—indicating strong supply.
- Support Level: Strong buying interest observed near the 92,500 region, keeping the structure intact.
- FVG (Fair Value Gap): The price filled the FVG recently, suggesting equilibrium and potential for another leg up.
Current Outlook:
- Price is holding above the FVG and is attempting a bullish rebound.
- If price maintains support above the recent lows, we may see continuation toward the target at 95,576.
Next Target: 95,576
Watch For: Rejection at resistance or volume confirmation to validate a breakout.

Xauusd sell now The Fib retracement outline shows that we could see a push towards $2,260 next at least before some semblance of support That coming from the Fib retracement level The next key stop after that might be a push towards
Xauusd sell now 2295_2300
Tp 2290
Tp 2280
Tp2260
So 2310

XAUUSD BUY STRONG BUY NOW MORE SELL TODAY BUY BUY GOLD CONTINUE Gold probed above for the second time, inflated by increased safe haven demand following Israel’s attack on Iran early Friday
Although the spike above the metal’s price reached was so far short lived, near-term focus remains at the upside, as fears of further escalation in the region will continue to fuel demand
Technical picture is firmly bullish as indicators are in bullish setup and recent dips were contained by rising
XAUUSD BUY NOW_2380_2375
TP_2390
TP_2400
TP_2450
Sl_2368

BTCUSD BUYING LONG team members just waiting Given that the momentum indicators are heavily tilted to the downside, Bitcoin could revisit its March bottom of In case of a downside violation, there is no prominent support until the resistance zone of

EURUSD sell now just hold onto them EURUSD session on Friday but managed to recover to the area In the absence of high tier data releases, investors will keep a close eye on headlines surrounding the Iran Israel conflict

GBPJPY now sell GBPJPY signaling a trendless market. Similarly the RSI continues to hover around confirming the current indecisiveness of market participants. More importantly, the stochastic oscillator is trying to edge above its moving average, but such a move needs to pick up pace in order to be seen as a strong signal

Eur/UsdHello traders! In my opinion, in short term this pair is buy.
Target:
Buy 1.0733 ; 1.0790
Be careful and wait for a confirmation!
Don`t forget to look at the economic calendar!
MAKE MONEY AND ENJOY LIFE 💰
THANK YOU!
GOOD LUCK!
🙏🏻🙏🏻🙏🏻

usdcadThe possibility of a further decline with the breaking of the trend line and the withdrawal of liquidity below it and a decline to 1.27 is very likely.


audjpy 1h shortThis signal is seen in 1 hours. As you know, the signal is not suitable for people who want to finish the transaction quickly.

EURUSD H4BUY ENTRY @1.09359
STOP LOSS@ 1.08518
TAKE PROFIT@1.10630
Market Update (Looking to Long)
Like and Subscribe
Thank you
Please support our analysis with a like or comment!

EURUSD SHORTS 📉📉📉As i told i would like to LONG USD this week, a perfect opportunity present on EU only if price reaches 1.13500 where we have an important sell area, imbalance fill on h4 + bearish orderblock all of them being located in a premium area on fibonaci that sets perfect sells entry. The market structure is bearish on HTF and we will go with the FLOW not AGAINST. DXY is bullish on HTF.
What do you think ? Comment below.. 📉📉📉
