lower interest rate will boost the gold read the caption “The next move probably hinges on this week’s PCE Index release. Evidence of further disinflation in the U.S., which would ease fears of prices accelerating or at least re-anchoring at a higher level, would be very bullish for gold.”
Gold prices hit a record high last week after Fed policymakers indicated they still expected to reduce interest by three-quarters of a percentage point
Forextrader

Usdjpy do anything but downfall read the caption On the 4 hour chart, we can see that the price recently broke out of the trendline that was defining the uptrend since the 146.50 level. We can also notice that we had a double top at the resistance level, but the price will need to break below the neckline at 150.36 to confirm it. This recent breakout should point to at least a pullback into the neckline, but the consolidation skewed the picture,

Gbpusd dropping and dipping only option read the caption Intraday bias in GBP/USD stays neutral, as consolidations from 1.2574 continues. Risk will stay on the downside as long as 55 4H EMA (now at 1.6901) holds. Below 1.2574 will resume the fall from 1.2891 to 1.2516 structural support first. Decisive break there will suggest that rise from 1.2032 has completed at 1.2891 already, and turn near term outlook bearish.

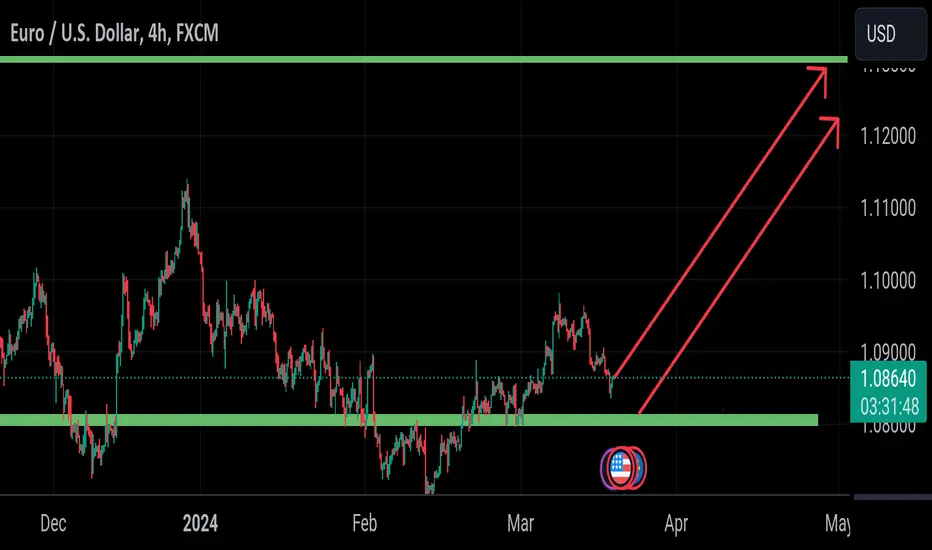
eurusd analysis show us big bullish read the caption The best approach I can see working here today would be to look for a long scalp from a bounce off the support at $1.0831 or a short scalp from a bounce off the resistance at $1.0854
In the unlikely even that the price reaches $1.0921 today, that could be a great entry point for a short swing trade if we start to see a bearish reversal from that level

Audusd crash soon to hit new low level read the caption The AUD/USD pair bounced off last Friday’s lows and is climbing but faces a key resistance level at 0.6551, the confluence of the 50 and 200-day moving averages (DMA). Further upside is seen once breached. The next supply zone would be the 100-DMA at 0.6588, ahead of 0.6610. On the other hand, sellers' failure at 0.6560 would sponsor a leg-down

Gold will hit another peak level read the caption As the gold market is expected to consolidate around its recent record highs, investors are finding value in other areas of the precious metals market as it could be silver’s turn to run, according to some analysts.
While relatively calm; however, there are some signs investors are finally paying attention to the market as the gold/silver ratio looks to end the week at its lowest point so far this year. The ratio is currently trading around 85.50 points., down sharply from the 89 points seen at the start of the week

AUD/JPY Short, EUR/JPY Short and CAD/JPY ShortAUD/JPY Short
Minimum entry requirements:
• If 3 touch 1H continuation or 2 touch 1H continuation with 3 touch structural approach, 15 min risk entry within it.
EUR/JPY Short
Minimum entry requirements:
• If 3 touch 1H continuation or 2 touch 1H continuation with 3 touch structural approach, 15 min risk entry within it.
CAD/JPY Short
Minimum entry requirements:
• If 3 touch 1H continuation or 2 touch 1H continuation with 3 touch structural approach, 15 min risk entry within it.

CAD/JPY Short and NZD/JPY ShortCAD/JPY Short
Minimum entry requirements:
• 1H impulse down below most recent low.
• If 3 touch 15 min continuation, 5 min risk entry within it, or reduced risk entry on the break of it.
NZD/JPY Short
Minimum entry requirements:
• If 3 touch 1H continuation or 2 touch 1H continuation with 3 touch structural approach, 15 min risk entry within it.

CAD/JPY ShortCAD/JPY Short
Minimum entry requirements:
• 1H impulse down below most recent low.
• If 3 touch 15 min continuation, 5 min risk entry within it, or reduced risk entry on the break of it.

Gbpusd do any thing to go sell read the caption The GBPUSD has completed its down and up "lap" that saw the pair move from an Asian session high at 1.273052 to a low in the European session at 1.2677 (and briefly below the 200 bar MA on the 4-hour chart at 1.2673), and then back up to a US session high at 1.2733 The current price is trading at 1.27206
That the new session high, the price did extend above the 100-bar moving average on a 4.-hour chart currently at 1.27285. So like at session lows, the price will move the 4-hour moving average by a few pips only to fail

Usdchf clear show us to big sell read the caption Sellers in the USDCHF tried to extend it to the downside in the early New York session, but were thwarted by swing area support between 0.88187 and 0.88241. The low price reached 0.88225 before bouncing back to the upside.
That move higher has now taken out the prior high for the day at 0.8854 and now looks toward the high price from last week and Friday trade at 0.88523 as the next target to get to and through to give the buyers more confidence

Euro wants to cross gbp keep go with buy read the caption The EURUSD coming into the US session had bounced near the 200-day MA and the 50% midpoint and looked toward the 100-day MA at 1.08548
The price did break above that 100-day MA, and in doing so, moved up to test the next target at 1.08655. That level is home to swing levels going back to February (see red numbered circle on the chart below). Sellers leaned and pushed back to the 100-day MA
Usdjpy selling pressure read the caption USDJPY is churning chart paper just above the 149.01 handle as investors gear up for a central-bank-heavy week. The Bank of Japan (BoJ) is expected to deliver an update on its negative interest rate regime early in the Tuesday market session after Japan’s spring wage negotiations showed the highest wage increases in over three decades. The Federal Reserve (Fed) also expected this week and will drop its latest Dot Plot summary of interest rate projections on Wednesday

xauusd h4 candle seeing above 2194 read the caption Meanwhile, the markets are still pricing in the possibility that the Fed will begin its rate-cutting cycle as early as June. This, along with ongoing geopolitical tensions, could offer some support to the safe-haven Gold price and help limit losses. Traders might also refrain from placing aggressive directional bets ahead of the crucial two-day FOMC policy meeting starting this Tuesday. Investors will look for cues about the Fed's rate-cut path

NZD/JPY ShortNZD/JPY Short
Minimum entry requirements:
• 1H impulse down below area of value.
• If 2 touch 15 min continuation, 5 min risk entry within it, or reduced risk entry on the break of it.

Nzdusd head is up blindly go with buy read the caption Monday's trading, NZD/USD remained largely unchanged around 0.6084 while the pair showed ongoing sell-off pressure. However, subtle hints of an imminent near-term reversal are beginning to show up on the hourly chart as bears may step out to consolidate their movements

Audusd it's not sell guys it's biggest drop here a opportunity In light of the upcoming Reserve Bank of Australia (RBA) meeting, the expected cautious approach of the central bank could act as an important contention zone for the AUD, as investors see the bank’s forward guidance to remain unchanged as well as its mention that further rate hikes should not be ruled out. It is worth mentioning that the RBA remains

Gbpusd dipping level read the caption Monday that the price action looked bullish and the support at $1.2839 looked strong, so I was seeking a long trade from a bullish bounce off this level.
However, my analysis was not effective, as the price headed down to $1.2839 but kept going lower without
The price has taken more of a bearish turn over the past few days, with the US Dollar getting stronger at the expense of almost all other currencies, including the British Pound

GBP/USD Short, AUD/USD Short, EUR/USD Short and CHF/JPY shortGBP/USD Short
Minimum entry requirements:
• If 3 touch 1H continuation or 2 touch 1H continuation with 3 touch structural approach, 15 min risk entry within it.
AUD/USD Short
Minimum entry requirements:
• Tap into area of value.
• 1H impulse down below area of value.
• If 2 touch 15 min continuation, 5 min risk entry within it, or reduced risk entry on the break of it.
EUR/USD Short
Minimum entry requirements:
• Tap into area of value.
• 1H impulse down below area of value.
• If 2 touch 5 min continuation, reduced risk entry on the break of it.
• If 2 touch 15 min continuation, 5 min risk entry within it, or reduced risk entry on the break of it.
CHF/JPY Short
Minimum entry requirements:
• 1H impulse down below most recent low.
• If 2 touch 5 min continuation, reduced risk entry on the break of it.
• If 2 touch 15 min continuation, 5 min risk entry within it, or reduced risk entry on the break of it.

Xauusd will rip the buyers read the caption All up, these numbers probably won’t shift the dial on interest-rate expectations, with the first reduction now thought likely to be in June. However, they do underline that the inflation threat remains visible and that near-term rate reductions of any kind can’t be seen as certain yet. Some expected early rate cuts at the start of this year. Now the second half of 2024 seems like the earliest possible date.
Yielding nothing, gold might be expected to do better when investors see lower rates and lower yields ahead,

EURUSD done the buy it's Sell read the caption eurusd price actions from 1.1274 are viewed as a corrective pattern to rise from 0.9534 (2022 low). Rise from 1.0442 is seen as the second leg. While further rally could cannot be ruled out, upside should be limited by 1.1273 to bring the third leg of the pattern. Meanwhile, sustained break of 1.0696 support will argue that the third leg has already started for 1.0446 and possibly below.

Bitcoin poised again hit to 74k on this time buyers can make B$price revisited the $64,800 level, dipping below $65,000, for the first time since March 6, on Binance. BTC’s price correction was a significant one as it liquidated several long and short positions in derivatives markets.
While $125 million in long positions were liquidated, $27.68 million in shorts were crushed by the asset’s recovery, according to CoinGlass data. While Bitcoin price corrected to the $66,000 level last week, meme coins likely gained from capital rotation

Silver look like a snake it will hunt the target hunt is supportAs the gold market is expected to consolidate around its recent record highs, investors are finding value in other areas of the precious metals market as it could be silver’s turn to run, according to some analysts.
While relatively calm; however, there are some signs investors are finally paying attention to the market as the gold/silver ratio looks to end the week at its lowest point so far this year. The ratio is currently trading around 85.50 points., down sharply from the 89 points seen at the start of the week.
It now takes 85.50 ounces of silver to equal the value of one ounce of gold. The ratio historically trades between 50 to 60 points. The drop in the ratio comes as silver prices end the week near a three-month high above $25 an ounces
