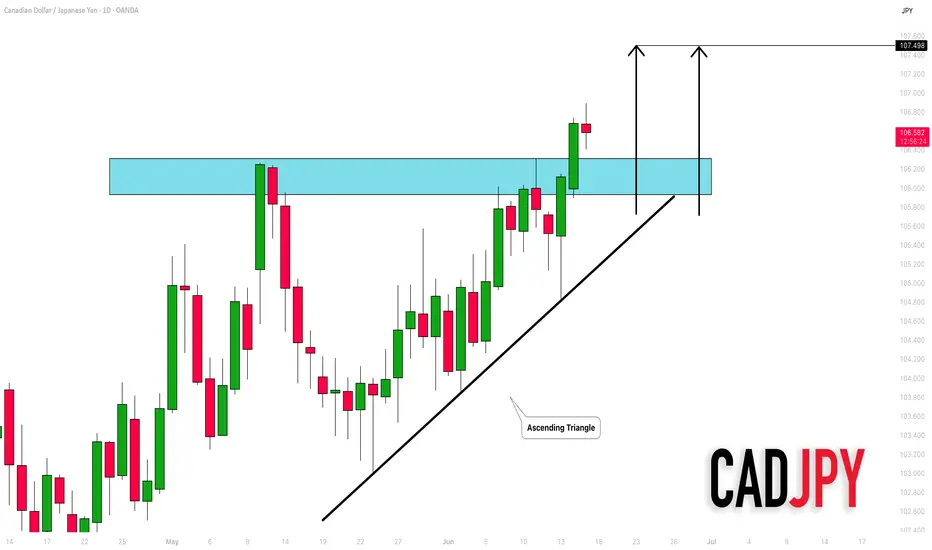
CADJPY: Important Breakout 🇨🇦🇯🇵
CADJPY successfully violated a resistance of an ascending triangle
pattern on a daily time frame.
The broken structure turns into a strong support now.
The pair may continue rising after a pullback.
Next goal - 107.5
❤️Please, support my work with like, thank you!❤️
Forextrading
GBPUSD SHORT FORECAST Q2 W25 D17 Y25GBPUSD SHORT FORECAST Q2 W25 D17 Y25
Professional Risk Managers👋
Welcome back to another FRGNT chart update📈
Diving into some Forex setups using predominantly higher time frame order blocks alongside confirmation breaks of structure.
Let’s see what price action is telling us today!
💡Here are some trade confluences📝
✅Weekly order block
✅15' order block
✅Intraday 15' break of structure
✅Tokyo ranges to be filled
🔑 Remember, to participate in trading comes always with a degree of risk, therefore as professional risk managers it remains vital that we stick to our risk management plan as well as our trading strategies.
📈The rest, we leave to the balance of probabilities.
💡Fail to plan. Plan to fail.
🏆It has always been that simple.
❤️Good luck with your trading journey, I shall see you at the very top.
🎯Trade consistent, FRGNT X

An update on my NAS100 trade idea I shared over the weekend.I analyzed over the weekend and ended up breaking down a weak high, my mistake was not considering some of the information the chart was communicating at that time.
I ended up not getting any entry opportunity on the POI I was targeting. As I was waiting, I noticed I was looking for entry on the push of a weak high which was now acting as an inducement then reevaluated my analysis and noticed price was going to look for liquidity above that weak high.

Gold Trading Strategy June 16There is not much surprise when the price gap up appeared on Monday morning there is no barrier that can stop the price of gold from increasing towards ATH. Gold has a slight adjustment in Tokyo session after the price gap up touched the round resistance zone 3450.
The adjustment may extend to 3413 in European session. This is a BUY zone with the expectation that Gold will regain the ATH hook. If broken, there will be some Scalping buy zones but the risk is quite high so to be safe, wait for 3398.
In the long term, 3463 acts as temporary resistance for a reaction phase before Gold returns to its all-time high. Maybe before that, 3490 will have another price reaction before reaching the peak.
Resistance: 3428 (Scalping) - 3444 - 3463 - 3490
Support: 3413- 3298

Try a R/R1 BuyThis signal is based on a 60% win rate backtested strategy...
1st order:
Buy @ 3418.3
SL: 3410
TP: 3426
2nd order:
Buy Limit @ 3414
SL: 3410
TP: 3426
Manage your Risk...

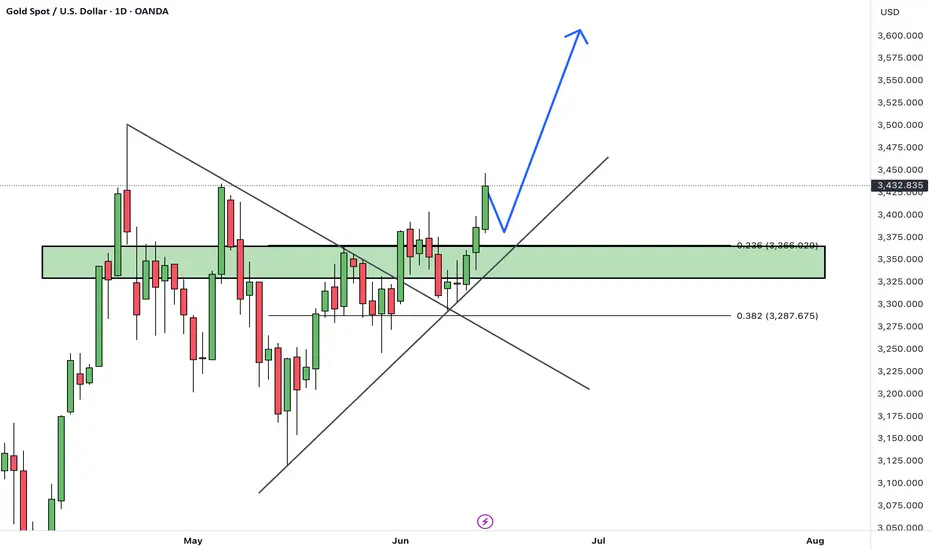
XAUUSD Hello Traders! 👋
What are your thoughts on GOLD?
Gold has broken above a major resistance level, and price has closed firmly above this zone, signaling strong bullish momentum and a shift in market sentiment.
We expect a brief pullback in the short term, followed by a resumption of the upward move toward higher targets and new highs.
As long as price remains above the identified support level, the bullish outlook remains valid.
Is gold ready for its next leg up after the pullback? Share your thoughts below! 🤔👇
Don’t forget to like and share your thoughts in the comments! ❤️
AUDCHF: Pullback From Resistance 🇦🇺🇨🇭
There is a high chance that AUDCHF will retrace from a key daily resistance.
As a confirmation, I see a strong rejection on an hourly time frame.
Goal - 0.5267
❤️Please, support my work with like, thank you!❤️
I am part of Trade Nation's Influencer program and receive a monthly fee for using their TradingView charts in my analysis.

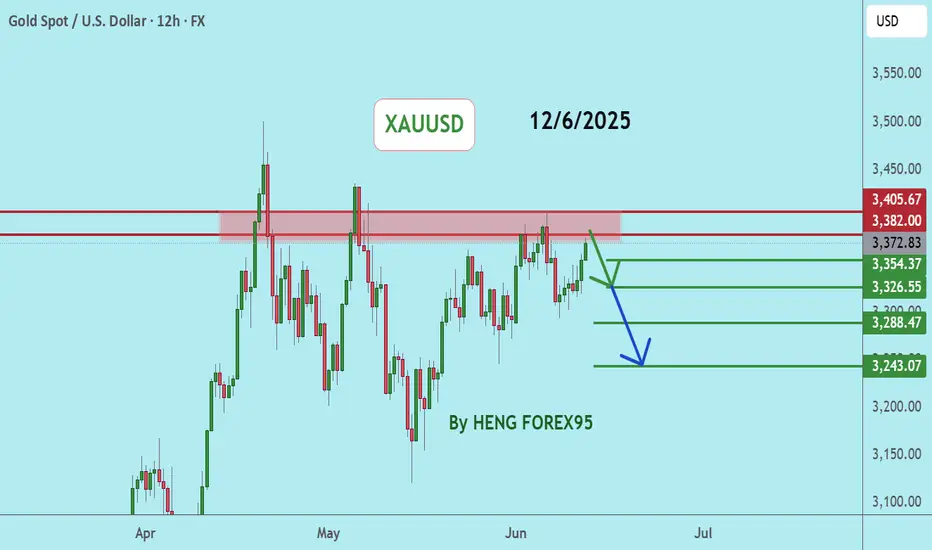
XAUUAD UPDATE 16- 6 +2025The chart you provided is a 45-minute time frame analysis for Gold CFDs (US$/OZ). Here's a breakdown of the key elements and what they suggest:
---
Current Price
$3,414.93, down -18.42 (-0.54%)
---
Analysis Summary
Price Action
The price has recently rejected from a resistance zone (around $3,445–$3,450).
It is currently pulling back, heading downward from this resistance.
Support Zones Highlighted
Multiple horizontal yellow zones mark previous support/resistance levels.
The key immediate support level lies near $3,400–$3,405.
A deeper support area is visible around $3,360–$3,365, and further below near $3,320.
---
Forecast Indication (Based on Markings)
A short-term pullback (blue arrow up) may retest the breakdown level (~$3,430).
Then, a potential drop toward the next support at $3,360 is expected (blue arrow down).
A bearish continuation scenario is emphasized with a red downward arrow, suggesting price may head further down to the $3,320 area if $3,360 fails to hold.
---
Implications for Traders
Bearish Bias: Suggested by the forecast arrows and recent resistance rejection.
Potential Setup:
Short on pullback near $3,430 (if price fails to reclaim this zone).
Target: $3,360 and possibly $3,320.
Stop-loss: Above $3,450 resistance.
---
Would you like a trading plan or signal based on this analysis?

EURUSD: Move Up Ahead?! 🇪🇺🇺🇸
EURUSD nicely respected the underlined key horizontal support.
A strong rejection from that and a formation of a bullish imbalance candle
indicate a highly probably bullish continuation next week.
Goal - 1.1608
❤️Please, support my work with like, thank you!❤️
I am part of Trade Nation's Influencer program and receive a monthly fee for using their TradingView charts in my analysis.

Gold Price Analysis June 13Yesterday's D1 candlestick increased, confirming the continuation of the uptrend. Following that uptrend, the Asian session saw a strong increase in price to the highest peak of 3443. If there is still confirmation from the h4 candlestick above 3395, today will still be a bullish candlestick with a large amplitude at the end of the day.
After reaching the highest peak of the month, Gold is having a downward correction at the end of the Asian session. This correction lasts until the support of 3397 to have a good BUY signal. In case you want to SELL, you must wait for a 50% test of the previous full-force downtrend H1 candle (around 3434) and the continuation of the Selling side.
If the 50% test does not appear, you must reverse to find a BUY Breakout point. Note that the False break at the peak of 3343 should wait for confirmation of the small-frame DOW wave to enter the order, which will be safer for this morning's break.
If you get a BUY order, the target will be 3364 and this area will have a profit-taking reaction from the Buyers, causing the price to decrease. Gold may touch the threshold before ATH 3394 and there will be a reaction.
In the opposite direction, there is a sweep to 3376, which is considered the daily support zone and you can buy in this area.
All SELL signals are considered obstacles, so set a short target and a new BUY signal sets a long expectation.

Markets Crash: Gold Soars, Crypto Dips!Israel’s strikes on Iran shook markets—Bitcoin and stocks tanked, gold soared. What’s next? Let’s unpack the best trading moves for this chaos!
Hey traders, Skeptic here!👋 Yesterday’s Israeli strikes on Iran’s military and nuclear sites, plus high-profile casualties, sent markets into a tailspin. If your positions got stopped out today, don’t sweat it—that’s normal in this mess. Today, I’m breaking down the most likely scenarios for financial markets, especially stocks and crypto, with no FOMO, no hype, just reason. Stick with me to navigate this storm!
📉Right now, markets are screaming risk-off . Stocks like the S&P 500, indices, and crypto like Bitcoin are bleeding as buyers have zero confidence. Everyone’s piling into safe-haven assets like gold, the Japanese yen, and the Swiss franc. Last night’s news triggered sharp drops in Bitcoin and SPX500, while gold’s rallying hard. This is classic flight-to-safety behavior, and it’s why your stops might’ve been hit. Let’s dive into the geopolitical scenarios driving this and then get to the charts.
📍First, the big picture.
Scenario one: Iran retaliates for Israel’s strikes, and we’re stuck in a tit-for-tat escalation for weeks. Markets stay risk-off, stocks and crypto keep sliding, and safe havens like gold thrive.
Scenario two: The US-Iran nuclear talks on Sunday, June 15th, lead to a deal, tensions cool, and markets stabilize. If those talks fail, I’m not optimistic— recent US inflation relief, might’ve pushed the Federal Reserve toward rate cuts to boost markets. Without de-escalation, rate cuts won’t save risky assets, and we’re looking at muted growth for crypto and stocks.
But if a deal happens, markets could rip—Bitcoin might hit $130K short-term and even $170K as the bull run’s ceiling. For now, uncertainty rules, so let’s see what the charts say.
👀 Let’s start with Bitcoin on the daily.
The first major support is $100K-$101K. If we lose that, we’re looking at a 3-4 month time-based correction . I know some of you see Bitcoin’s dip and think it’s a bargain, but hold up—if tensions escalate, breaking $100K-$101K is almost guaranteed. We could slide to $95K (0.382 Fibonacci retracement) or even $86K (0.618 retracement). No buying until Tuesday’s clarity—too risky. Shorting? Also a bad idea. After this sharp drop, where do you put your stop-loss? An 8% stop is the minimum, which trashes your risk-reward ratio. Best move? Sit tight, no positions, and wait for the dust to settle.
📈 Gold’s the star in this risk-off market.
On the 4-hour, as we said in last week’s watchlist, it broke the descending channel’s ceiling at 3333.86 and pulled back. Using our trick of cloning the prior channel and placing it above, it’s reacting perfectly at the new channel’s midline. A break above 3434.35 could push us to the channel ceiling at 3550.13 . Personally, I’d wait for more ranging here before going long—stops are too wide right now for a clean entry. If you caught our 3340 long trigger from the watchlist, you’re sitting pretty— just hold . Gold’s got more upside potential, but if you’re not in, don’t FOMO. Wait for a better setup.
🎯 Our EUR/USD long trigger from last week’s watchlist at 1.14555 was a winner
if you took it, you hit your risk-reward target and likely locked in profits. Nice work! The new long trigger is a break above 1.16142 resistance. No short triggers here, just like gold. With both major and secondary trends screaming uptrend, shorting against the flow is nonsense. I’d wait for key levels to break and confirm a bearish shift before even thinking about shorts. Trade with the trend, always.
📝our plan: Gold longs above 3434.35 target 3550.13; hold 3340 entries or wait for a range. EUR/USD longs above 1.16142, no shorts. Risk max 1% per trade, set alerts, and stay patient—geopolitical chaos means no FOMO moves.
I hope for a day with no wars, where we can focus on what matters—building value and humanity.🤍
That’s today’s breakdown, traders!
If this helped, smash that Boost button and Follow for more no-hype analysis. Drop a comment—what’s your next move? Want a coin or market analyzed? This is Skeptic, stay safe, protect your capital, and see you next time! <3

Mitigation Block in Forex Trading: What It Is and How to Use It?What a Mitigation Block Is, and How You Can Use It When Trading Forex?
Understanding specific market mechanisms like mitigation blocks may enhance strategic decision-making. This article delves into the concept of mitigation blocks, detailing their definition, function, and practical application within forex.
Definition and Function of a Mitigation Block
A mitigation block in forex trading refers to a specific order block on a chart that indicates where previous movements have stalled and reversed, marking it as a potential area for future market turns. This concept within the Smart Money framework is crucial for traders looking to manage their positions by taking advantage of strategic entry and exit points.
The idea behind these areas is rooted in the dynamics of supply and demand within forex. When a currency pair reaches a level where buyers or sellers have previously entered the market in force, causing a reversal, it suggests a potential repeat of such actions when the price returns to the area.
Characteristics and How to Identify a Mitigation Block
Mitigation blocks can be bullish or bearish, each with distinct characteristics:
- Bearish Mitigation Block: This type forms during an uptrend and is identified by a significant peak followed by a decline and a failed attempt to reach or surpass the previous high, creating a lower high. When prices drop below the previous low, the order block above the low becomes mitigation. It may be characterised by an increase in selling volume as the price approaches the level, signalling resistance and a potential downward reversal.
- Bullish Mitigation Block: Conversely, a bullish type is established during a downtrend. It is characterised by a significant trough, followed by a rise to form a higher low, and a failure to drop below the previous low. As the pair moves up, the order block below the high marks mitigation one. This area often shows an increase in buying volume as the price approaches, indicating support and a potential upward reversal.
Mitigation Block vs Breaker Block
Mitigation and breaker blocks are both significant in identifying potential trend reversals in forex trading, but they have distinct characteristics that set them apart. A mitigation block forms after a failure swing, which occurs when the market attempts but fails to surpass a previous peak in an uptrend or a previous trough in a downtrend. The pattern indicates a loss of momentum and a potential reversal as the price fails to sustain its previous direction.
On the other hand, a breaker block is characterised by the formation of a new high or low before the market structure is broken, indicating that liquidity has been taken. This means that although the trend initially looked set to continue, it quickly reverses and breaks structure.
In effect, a breaker appears when the market takes liquidity beyond a swing point before reversing the trend. A mitigation appears when the price doesn’t move beyond the trend’s most recent high or low, instead plotting a lower high or higher low before reversing the trend.
How to Use Mitigation Blocks in Trading
Areas of mitigation in trading can be essential tools for identifying potential trend reversals and entry points. When they align with a trader's analysis that anticipates a reversal at a certain level, it can serve as a robust confirmation for entry.
Traders can effectively utilise these zones by simply placing a limit order within the area once it is considered valid. Validation occurs after a new peak or trough is established following the initial failure swing that forms the mitigation area.
If a liquidity void or fair-value gap is present, the trader may look for such a gap to be filled before their limit order is triggered, potentially offering a tighter entry. Stop losses might be placed beyond the failure swing or the most extreme point.
Furthermore, if a mitigation block is identified on a higher timeframe, traders can refine their entry by switching to a lower timeframe. This approach allows for a tighter entry point and potentially better risk management, as it offers more granular insight into the momentum around the area.
Common Mistakes and Limitations
While these blocks are valuable for forex trading, they come with potential pitfalls and limitations that traders should know.
- Overreliance: Relying solely on mitigation blocks without corroborating with other trading indicators can lead to misjudged entries and exits.
- Ignoring Context: Using these zones without considering the broader market conditions may result in trading against a prevailing strong trend.
- Misinterpretation: Incorrect identification can lead to erroneous trading decisions, especially for less experienced traders.
- False Signals: Mitigation blocks can sometimes appear to signal a reversal but instead lead to a continuation of the trend, trapping traders in unfavourable positions.
The Bottom Line
Understanding mitigation blocks offers traders a strategic edge in navigating the forex market. They can be vital for recognising potential price reversals and improving trading outcomes.
FAQs
What Is a Mitigation Block?
A mitigation block in forex trading is an order block that identifies potential reversal points. It signals where a currency pair has previously stalled, indicating strong buying or selling pressure, suggesting a potential for similar reactions in future encounters with these levels.
How Do You Identify a Mitigation Block?
Mitigation blocks are identified by analysing charts for areas where previous highs or lows were not surpassed, leading to a reversal. Traders look for a sequence of movements, including a swing high or low followed by a retracement that fails to exceed the previous swing.
What Is the Difference Between a Breaker Block and a Mitigation Block?
While both indicate potential reversals, a breaker block forms when the price makes a new high or low before reversing, suggesting a temporary continuation of the trend. In contrast, a mitigation block forms without creating a new extreme, indicating a direct loss of momentum and an immediate potential for reversal.
This article represents the opinion of the Companies operating under the FXOpen brand only. It is not to be construed as an offer, solicitation, or recommendation with respect to products and services provided by the Companies operating under the FXOpen brand, nor is it to be considered financial advice.

NZDCHF: Another Pullback Trade 🇳🇿🇨🇭
I see one more pullback opportunity on NZDCHF.
My confirmation is an ascending triangle pattern
formed on a key horizontal support.
Goal - 0.4896
❤️Please, support my work with like, thank you!❤️
I am part of Trade Nation's Influencer program and receive a monthly fee for using their TradingView charts in my analysis.

EUR/USD Short and GBP/USD ShortEUR/USD Short
Minimum entry requirements:
- If tight non-structured 15 min continuation forms, 5 min risk entry within it if the continuation is structured on the 5 min chart or reduced risk entry on the break of it.
- If tight structured 15 min continuation forms, reduced risk entry on the break of it or 15 min risk entry within it.
- If tight non-structured 1H continuation forms, 15 min risk entry within it if the continuation is structured on the 15 min chart or reduced risk entry on the break of it.
- If tight structured 1H continuation forms, 1H risk entry within it or reduced risk entry on the break of it.
GBP/USD Short
Minimum entry requirements:
- If tight non-structured 1H continuation forms, 15 min risk entry within it if the continuation is structured on the 15 min chart.
- If tight structured 1H continuation forms, 1H risk entry within it.

USDJPY: Bottom formation successful. Strong buy.USDJPY is neutral on its 1D technical outlook (RSI = 46.191, MACD = -0.020, ADX = 12.744) as it is consolidating around the 1D MA50. This is the bottom formation process straight after rebounding on the S1 Zone. The wider pattern is a Descending Triangle and the bottom formation suggests that the new bullish wave is about to be initiated. Go long and target the 0.618 Fibonacci level (TP = 153.500).
## If you like our free content follow our profile to get more daily ideas. ##
## Comments and likes are greatly appreciated. ##

XAUUSD, GoldGold is in a correction phase. If the price cannot break through the $3429 level, it is expected that the price will drop. Consider selling in the red zone.
🔥Trading futures, forex, CFDs and stocks carries a risk of loss.
Please consider carefully whether such trading is suitable for you.
>>GooD Luck 😊
❤️ Like and subscribe to never miss a new idea!
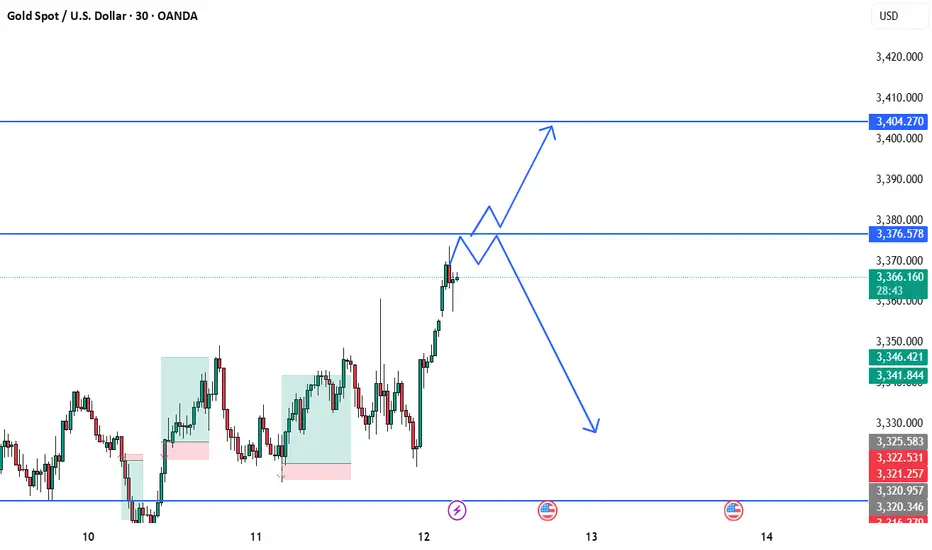
BEST XAUUSD M30 BUY AND SELL SETUP FOR TODAY Gold has shown a strong bullish push, breaking above recent consolidation and approaching a key resistance zone around $3,376. ⚔️ This area will be decisive — if price holds above it and confirms support, we could see a further rally toward $3,404. 📈✨ However, failure to sustain above this level could trigger a bearish rejection, pulling the market back toward the $3,330–$3,340 range. 📉🔄 Traders should wait for clear price action confirmation before entering. React, don’t predict! 🎯🧠
BEST XAUUSD M30 BUY SETUP FOR TODAYPrice is showing signs of bullish strength after reclaiming key demand zones near 3,310.926–3,315.098 🟦. The recent CHoCH (Change of Character) and strong bullish reaction from the demand block suggests a potential move toward the 3,360 resistance area 🔼. Buyers are likely stepping in with momentum, aiming for a break above previous highs 📉➡️📈. As long as price stays above the 3,315 support, the bullish scenario remains valid — watch for continuation toward higher highs. 🚀💹

EURUSD: Perfect spot to short.EURUSD is bullish on its 1D technical outlook (RSI = 62.082, MACD = 0.004, ADX = 31.112) as it is trading inside a Channel Up since the May 12th low. The 4H RSI sequence suggests that based on the Channel's first bullish wave, the market is now on the 4th count, which was previously the top (as close to the 1.786 Fibonacci extension as possible). We turn bearish here, targeting the 0.786 Fib level at the bottom of the Channel Up (TP = 1.13550).
See how our prior idea has worked out:
## If you like our free content follow our profile to get more daily ideas. ##
## Comments and likes are greatly appreciated. ##

EURGBP Potential Bullish Reversal OpportunityEURGBP price action seems to exhibit signs of a potential Bullish Reversal on the shorter timeframes if the price action forms (and sustains) a credible Higher High with multiple confluences from key Fibonacci and Support levels.
Trade Plan :
Entry @ 0.8459
Stop Loss @ 0.8375
TP 0.9 - 1 @ 0.8534 - 0.8540

USD/CHF ShortUSD/CHF Short
Minimum entry requirements:
- Corrective tap into area of value.
- 4H risk entry or 1H risk entry after 2 x 1H rejection candles.
Minimum entry requirements:
- Tap into area of value.
- 1H impulse down below area of value.
- If tight non-structured 5 min continuation follows, reduced risk entry on the break of it.
- If tight structured 5 min continuation follows, reduced risk entry on the break of it or 5 min risk entry within it.
- If tight non-structured 15 min continuation follows, 5 min risk entry within it if the continuation is structured on the 5 min chart or reduced risk entry on the break of it.
- If tight structured 15 min continuation follows, reduced risk entry on the break of it or 15 min risk entry within it.

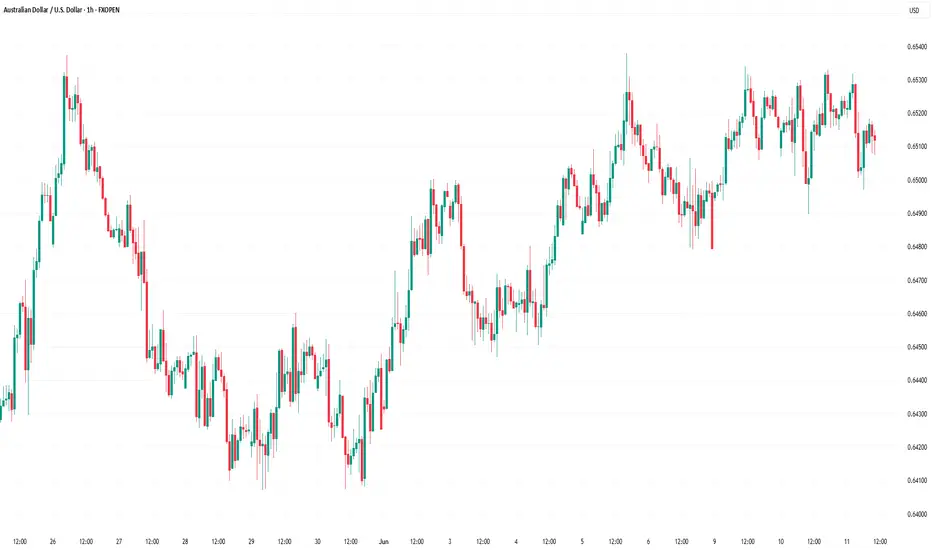
AUD/USD Aims Steady IncreaseAUD/USD Aims Steady Increase
AUD/USD started a decent increase above the 0.6450 and 0.6500 levels.
Important Takeaways for AUD USD Analysis Today
- The Aussie Dollar rebounded after forming a base above the 0.6400 level against the US Dollar.
- There is a connecting bullish trend line forming with support at 0.6510 on the hourly chart of AUD/USD at FXOpen.
AUD/USD Technical Analysis
On the hourly chart of AUD/USD at FXOpen, the pair started a fresh increase from the 0.6450 support. The Aussie Dollar was able to clear the 0.6500 resistance to move into a positive zone against the US Dollar.
There was a close above the 0.6500 resistance and the 50-hour simple moving average. Finally, the pair tested the 0.6535 zone. A high was formed near 0.6533 and the pair recently started a consolidation phase.
There was a move below the 0.6520 level. The pair dipped below the 23.6% Fib retracement level of the upward move from the 0.6489 swing low to the 0.6533 high.
On the downside, initial support is near the 0.6510 level. There is also a connecting bullish trend line forming with support at 0.6510. It is close to the 50% Fib retracement level of the upward move from the 0.6489 swing low to the 0.6533 high.
The next major support is near the 0.6480 zone. If there is a downside break below the 0.6480 support, the pair could extend its decline toward the 0.6450 level.
Any more losses might signal a move toward 0.6420. On the upside, the AUD/USD chart indicates that the pair is now facing resistance near 0.6535. The first major resistance might be 0.6550. An upside break above the 0.6580 resistance might send the pair further higher.
The next major resistance is near the 0.6600 level. Any more gains could clear the path for a move toward the 0.6650 resistance zone.
This article represents the opinion of the Companies operating under the FXOpen brand only. It is not to be construed as an offer, solicitation, or recommendation with respect to products and services provided by the Companies operating under the FXOpen brand, nor is it to be considered financial advice.
GBPUSD ANALYSISAfter seeing the previous daily candle close bearish and below support, we could expect the move to continue since the 4hr also has structural type move pushing to the downside
