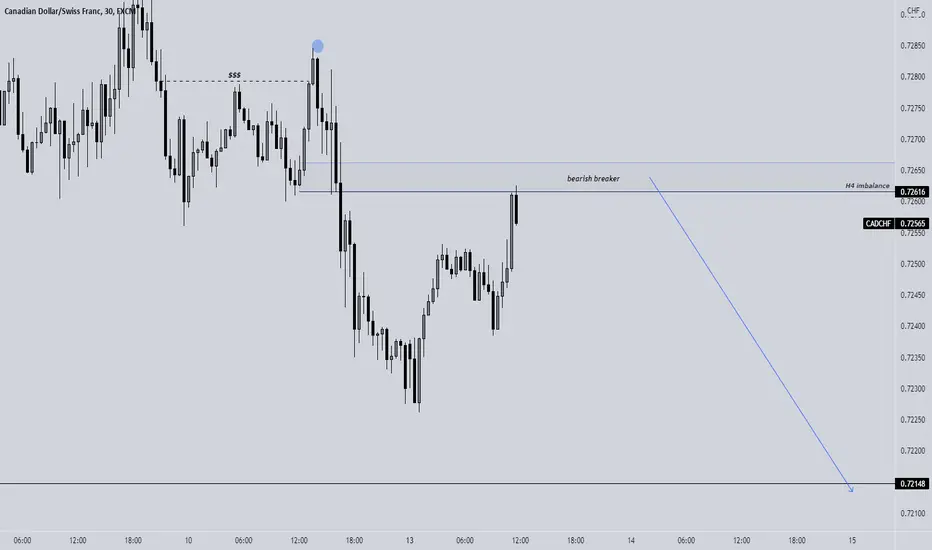
CADCHF SHORTS 📉📉📉I expect bearish price action on this pair as price is rejecting a bearish breaker on a m30 and filling the bearish imbalance h4, we are in a bearish market strucuture on a HTF.
What do you think ? Comment below..
Forextradingzones
USDJPY LONGS 📉📉📉Expect bullish price action on this pair as i look for bullishness in USD, we made a bullish BOS that means price is going for the buy side liquidity areas and filling the bearish imbalances to rebalance the price of the asset. 115.600 should be hit this week i think if we have enough volatility
What do you think ? Comment below..

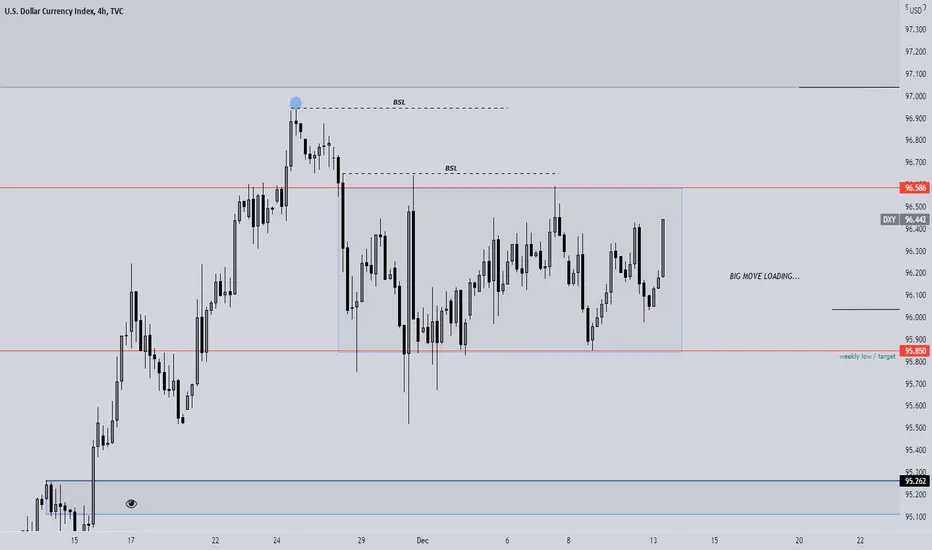
DXY big move loading...There is a BIG MOVE LOADING on USD chart. We have an accumulation area from 26 November that means the smart money are not taking serious positions due FOMC this week. The price should explode to the upside or downside on the FOMC release be carefull.
Also the retail heard is SHORTING USD so that means the change of being bullish there is more than bearish
What do you think ? Comment below..
AUDJPY SHORTS 📉📉📉Price took out liquidity above 81.500 where a lot of retail stops resided. We made a failure swing high that means bulls dont have momentum and bears gather momentum, i expect JPY to be strong this week. I would like to see there a strong bearish momentum candle on h4 CLOSED that means bears took 100% control.
What do you think ? Comment below..

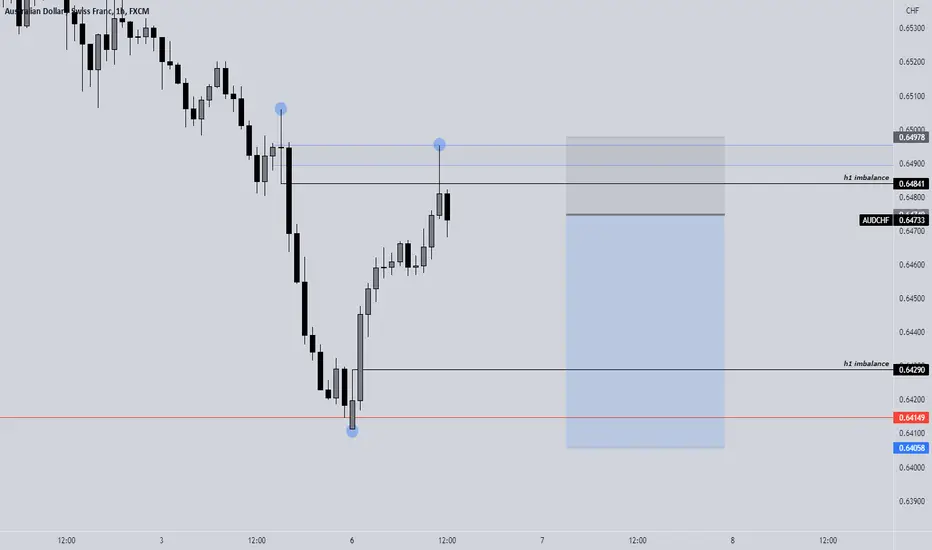
AUDCHF SHORTS 📉📉📉Price should start the selloff from this area as liquidity has been taken above 0.66000 where a lot of stops resided. Rejected a nice orderblock bearish h4 area ( resistance) and confirmed with a strong bearish momentum, we have as well a trendline liquidity area where a of traders put their stops and price should go there, i target 4-5R on this trade.
What do you think ? Comment below..

GBPAUD LONGS 📉📉📉Expect the price to make a bull run there, we made a failure swing low that means bears lose in momentum and bulls gather in momentum. Rejected a D1 imbalance area with a daily closure, a lot of bearish imbalances that should be filled this week, i wait for a h4 bullish candlestick confirmation for further upside
What do you think? Comment below..

JPY BASKET LONGS 📉📉📉Expect JPY bullishnes as we are in a bullish market structure on a HTF premise, rejecting right now a bullish orderblock h4 ,, support area ,, we filled the bullish imbalances and right now should see another leg to the upside.

CADCHF SHORTS 📉📉📉We are in a bearish market structure on a HTF premise, price is rejecting right now a bearish breaker area. We have a lot of bullish imbalances that price will tend to fill this days.
LETS GO TO THE DOWNSIDE?
Do you agree ?

GBPJPY SHORTS INTRA-DAY 📉📉📉 Price reject a bearish orderblock area on H1/M30 TF, we are in a bearish market structure. Yesterday price made the BOS bearish that signs that we are in a bearish move and right now should expect another leg to the downside, we have also some imbalances bullish that should be filled.
LETS GO

EURCHF SHORTS INTRADAY 📉📉📉Expect a selloff over there price filled h4 imbalance and right now is rejecting that are of interest, we have a lot of bullish imbalances that price will tend to fill in a later time.
LETS GO

AUDCHF SHORTS 📉📉📉Price is in a bearish market structure on a HTF premise, we should make another leg to the downside. Price is rejecting right now a bearish orderblock on h4 a important area of ,, resistance ,, if you will price left a lot of bullish imbalance that should retrace price lower.
What do you think ? Comment below..

EURAUD LONGS 📉📉📉Expect the price to make another leg to the upside as we are in a bullish market structure, price took out liquidity below 1.58500 rejecting a nice orderblock area on h4 TF, we have a lot of bearish imbalances that should be closed asap.
What do you think ? Comment below..

USDCHF SHORTS📉📉📉Expect sells in this area as price took out liquidity above 0.92500 the psychological barrier, we have a lot of bullish imbalances un-filled that should ,, magnetize ,, price back below this weeks open area.
What do you think? Comment below..

AUDUSD SHORTS 📉📉📉Expecting short opportunities on AU, price took out liquidity above 0.71000 and right now should make another leg to the downside. We are in a bearish orderblock h4 area as well that acts like a ,, resistance ,, for the price.
USD is very strong due fundamental reasons.
What do you think ? Comment below..

AUD/JPY
Hey guys, sorry i have been inactive over the last few weeks have had to look into my trading and see where i was messing up. It seems to me that I'm abit to eager for trades and need to take more to for conformation on my setups. But I did short the us100 until Friday where I closed and put my taking straight into this trade. we have a Range the AUD is trading in with a clear strong support and resistance with the FIb retracement tool also backing these lines. On the hourly timeframe we had a massive and strong bullish divergence on the RSI Between the 26/11 to the to the 4/12 with a engulfing bullish candle to confirm the reversal to the upside off support. I Bought Citi warrants and with my 3% target will profit 30% this trade should be done in a few days given the momentum off the support.


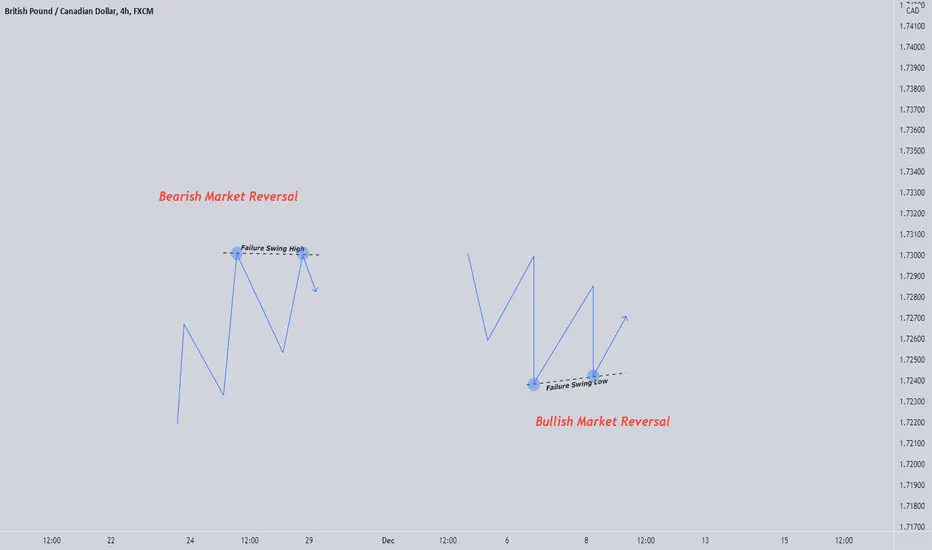
FAILURE SWING HIGH example Example 1 of failure swing high and market reversal from bullish to bearish.

FAILURE SWING HIGH vs FAILURE SWING LOWIn this example i would like to show you how to identify failure swing high and failure swing low to understand where bulls or bears are exahusted and you can catch a trend reversal.
What do you think ? Commente below..
USDCHF SHORTS📉📉📉Price took out liquidity above buy side liquidity area (bsl) a area where a lot of retail sellers put their stops and quickly reversed with a closed bearish high momentum candlestick, we should see bearish price action from this moment as the retail heard is LONG on this pair.
CHF is very strong as i said during those RISK OFF times.
What do you think? Comment below..

EURJPY SHORTS 📉📉📉Expect SHORTS for EJ only if price enters bearish orderblock h4 area 128.000 and rejects it, we are in bearish market structure on a HTF premise. JPY is very strong because of the RISK OFF sentiment we have in the markets right now.
What do you think ? Commente below..

AUDCHF SHORTS 📉📉📉Expect the price to drop from this area as we are in a bearish market structure on a HTF analysis, price filled a bearish imbalance on h4 and make a huge liquidity spike that probably took out sell stops above that area and take profit area,price rejected orderblock area ,, resistance ,, and right now we should see another leg to the downside.
CHF is very strong during those RISK OFF times .
What do you think ? Comment below..
GBPCHF SHORTS 📉📉📉Expect the price to drop from this area as we have a bearish market structure on a HTF and price rejected a bearish orderblock on h1 confirmed it with a high momentum bearish candle close, i want to see another leg to the downside on this currency pair. CHF is very strong during those times.
What do you think ? Comment below...

GBPJPY SHORTS 📉📉📉Expect the price to drop from this area, we have an imbalance fill on h4 price took out asian highs and right now should retrace lower. JPYBASKET is in a nice area for LONGS.
INTRA-DAY TRADE.
What do you think ? Comment below..
