USDCAD LONGS EDUCATIONAL 📉📉📉I wanted to provide for you an example on how price was strongly bearish during NFP day yesterday, fullfilled the imbalance rejected a bullish orderblock and then quickly reverses to the upside.
We are still bullish there both on market sentiment and on a HTF technical analysis premise, look only for buy entries.
What do you think ? Comment below..
Forextradingzones

CHFJPY SHORTS IN PLAY 📉📉📉As i told you in the previous post i took the short from orderblock + imbalance area on CHFJPY, right now we have 1.7R in profit, i expect the price to go way below sell side liquidity area that is the trendline liquidity and then collapse to 112.000 where a lot of buyers stops are.
What do you think ? Comment below..

Forex Update 03.12.2021Hello everyone, as we all know the market action discounts everything.
_________________________________Make sure to Like and Follow if you like the idea_________________________________
The dollar rose slightly on Friday, ahead of the release of the latest monthly U.S. jobs report, which might solidify a faster pace of tapering and, potentially, early interest rate hikes despite the omicron-induced uncertainties.
The Dollar Index, which measures the value of the US dollar against a basket of six other currencies, climbed 0.2 % to 96.305, slightly higher for the week. That would be the sixth weekly gain in a row.
The EUR/USD declined 0.1 % to 1.1284.
Daily Support & Resistance points :
support Resistance
1) 1.1279 1) 1.1334
2) 1.1260 2) 1.1368
3) 1.1225 3) 1.1388
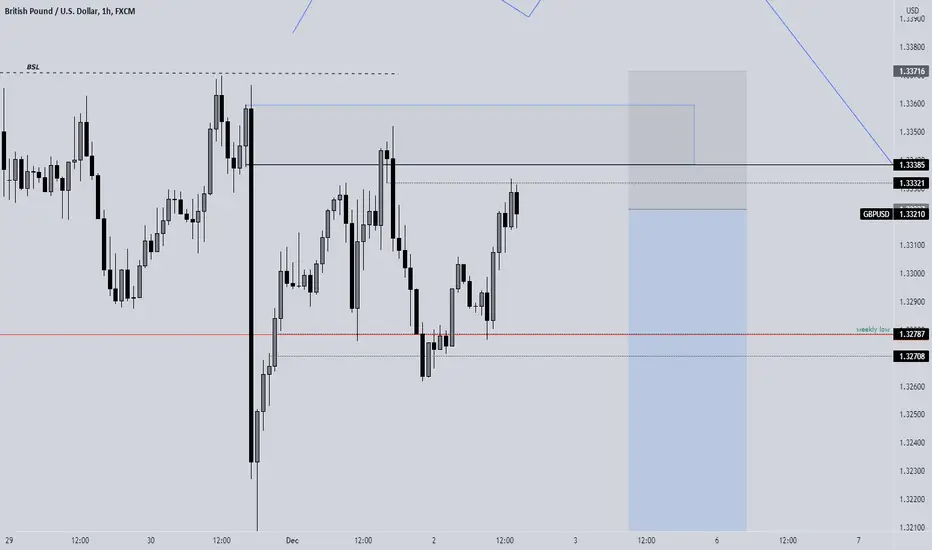
The GBP/USD dipped 0.2 % to 1.3279.
Daily Support & Resistance points :
support Resistance
1) 1.3273 1) 1.3337
2) 1.3240 2) 1.3368
3) 1.3209 3) 1.3401
The USD/JPY increased 0.2 % to 113.34.
Daily Support & Resistance points :
support Resistance
1) 112.79 1) 113.43
2) 112.43 2) 113.71
3) 112.15 3) 114.07
The AUD/USD sank 0.4 % to 0.7066, just above its 13-month low of 0.7063.
Daily Support & Resistance points :
support Resistance
1) 0.7077 1) 0.7114
2) 0.7062 2) 0.7136
3) 0.7040 3) 0.7152
The dollar gained ground this week after Federal Reserve Chair Jerome Powell testified to Congress that inflation would remain high for longer than the central bank had predicted, and that Fed policymakers would consider a faster tapering of the central bank's bond-buying program at their December meeting.
This hawkish tone was maintained on Thursday, with San Francisco Fed President Mary Daly stating it may be time to "start building a plan" to raise interest rates to battle inflation, and Richmond Fed President Thomas Barkin discussing "normalizing policy."
Money markets are once again predicting that the central bank would raise its benchmark rate by 25 basis points at its June 2022 meeting, as they did before the first news about Omicron.
The focus now shifts to the release of the monthly official jobs report in the United States for signs that the labor market is strengthening. The report's generally definitive signals, however, are likely to be muffled by the fact that it predates the advent of the new version.
Nonfarm payrolls are predicted to have climbed by 560,000 in November, up from 531,000 in October, while the unemployment rate is expected to fall to 4.5 percent from 4.6 percent in October.
However, both the ADP private payrolls on Wednesday and the initial unemployment claims on Thursday were greater than predicted, indicating that a positive surprise is a possible possibility.
This is my personal opinion done with technical analysis of the market price and research online from Fundamental Analysts and News for The Fundamental point of view, not financial advice.
If you have any questions please ask and have a great day !!
Thank you for reading.

GBPUSD SHORTS INTRA-DAY 📉📉📉Expect a short-term entry over there, price closed bearish imbalance on h1 and rejected with bearish confirmations, we are in a bearish market structure on a HTF. Retail heard are trapped long in this pair that means we will only look for sells.
What do you think ? Comment below..
DXY LONGS 📉📉📉Expect bullish price action on USD INDEX, price just made a return to the orderblock h1 filled the imbalance bullish, break the structure on the H1 TF from bearish into bullish. Targets are above 97.000
Look for buys on usdxxx pairs
Look for shorts on xxxusd pairs
What do you think ? Comment below..

GBPUSD SHORTS 📉📉📉Expect bearish price actionon this pair price rejected bearish orderblock h1 and filled a bearish imbalance, market sentiment shows us that retail heard are LONG on this pair that means we will look only for shorts. I target sell side liquidity below old low.
What do you think ? Comment below..

AUDUSD SHORTS 📉📉📉Price should start the selloff over there, AU just took out liquidity above BSL and 0.71500 we have a bearish candlestick on h4 closed that signs a potential move downside. Market Sentiment gives us a strong sell signal over there because the retail heard is around 74% LONG on this pair
What do you think ? Comment below..

GBPAUD LONGS 📉📉📉Expect LONGS on this pair, we have bullish market strucuture on a HTF. Price just filled the h4 imbalance and rejected with bullish momentum over there, expect to reach 1.88000 / 1.89000. SSL ( sell side liquitiy ) has been raided liquidity was taken out where possible market makers entered LONGS.
What do you think ? Comment below..

EURCAD SHORTS RISKY 📉📉📉Risky entry there, price took out all the buy side liquidity taking out stops on old highs ,,retail resistance,, and also took out stops on weekly high rejecting exactly from 1.45500 psychological area, price left a lot of imbalances bullish that should magnetize price back above 1.43000 / 1.42000.
What do you think ? Comment below ...

EURUSD SHORTS 📉📉📉Expect bearish price action over there, price is trading right now near a important sell area on D1 TF. We are in a bullish market structure on a HTF, price filled all the imbalances on its way up and left big imbalances bullish that will tend to fill later time, we also took the previous weekly high where a lot of liquidity lies.
What do you think ? Comment below..

JPY BASKET SHORT - TERM SHORTS 📉📉📉JPYINDEX should start the selloff in this area, price took all the liquidity above weekly high area. We can see that the bullish momentum is low already and we can see some bearish candles in formations, i expect to see the selloff at the start of NY session. This means bullish xxxjpy pairs if you have clear entries
What do you think ? Comment below ..

USDCAD SHORTS FLOATING PROFIT 📉📉📉As i told in previous posts i took a short positions up there in the bearish breaker, price is literally colapsing. I target for SSL ( sell side liquidity ) to be taken out, targeting around 4-4.5R.
HOLD IT, we have a RISK OFF market sentiment and that should support our idea because we buy CHF.
What do you think ? Comment below..

GBPCAD SHORTS RISKY 📉📉📉Expect the bearish price action from this area, i call this a risky entry because we go against HTF market structure. Price took out buy side liquidity above equal highs and above weekly highs, market makers as theory says should exit or execute their position and now price should colapse. MID-LONG TERM perspective i will look only for buys there.
What do you think ? Comment below..

USDJPY LONGS 📉📉📉As i told in my previous post i would like to LONG USD and short JPY on a short term perspective this sets a perfect opportunity to go long on UJ, but ONLY IF price will take out liquidity below weekly low 112.800, fill the imbalance in that area as well and will present bullish momentum on h4, we have a lot of price inefficiencies to close aka imbalances. I think we would cover all of them in this week.
What do you think ? Comment below..

EURUSD SHORTS 📉📉📉As i told i would like to LONG USD this week, a perfect opportunity present on EU only if price reaches 1.13500 where we have an important sell area, imbalance fill on h4 + bearish orderblock all of them being located in a premium area on fibonaci that sets perfect sells entry. The market structure is bearish on HTF and we will go with the FLOW not AGAINST. DXY is bullish on HTF.
What do you think ? Comment below.. 📉📉📉

JPY BASKET SHORT - TERM SHORTS 📉📉📉On a short term perspective(start of the week) i see JPY to make a drop back into 9200 / 9080. Price rejected a bearish orderblock on d1 and filled a daily imbalance, also took out the stops above 9300 and reversed quickly. I would like to point that best trades right now are BULLISH JPY, but if you are more riskier you can try some shorts going into the start of the week.
What do you think ? Comment below

NASDAQ SHORTS ⬇️⬇️⬇️ For the next week i expect new lows on NASDAQ below 16.000, more of a fundamental reasons then technical one. RISK OFF sentiment been pushed by new covid cases on media.

GBPCAD SHORTS ✅✅✅On into the next week i expect GCAD to drop, price just took out liquidit above buy side liquidity (BSL) equal highs+weekly highs and closed bearish below, we have multiple bullish imbalance that price will try to close next week.
For a better entry wait for a high momentum bearish candlestick on h4/d1, also what supports this idea is the correlation between usoil and cad i hope we will see a small retracement on usoil on monday so that means bullish CAD and our chart BEARISH.
Comment below what you think about.

GBPUSD Swing Trade 5R+This trade wasn't intended to be a swing trade, but I had a profit target I calculated that price would reach, so I held the trade and waited for the target while trailing my stop behind to keep me safe. I took the entry off the 70.5% Fibonacci level and rode price action down as it broke for new lows over the past 2 days. I took this trade on Wednesday 24 November and today 2 days later it hits the final profit target before the markets close for the weekend. Overall a very good trade with great profit management

AUDNZD SELLS HARDIt has broken out of 1hr structure, hence i expect the temporary upside movement to reverse at 85% FIBO level and head downwards.
Let me know what you think.

DXY TARGETED LEVEL , THIS IS FOR EDUCATION PURPOSEsome people view this level as theirhiden invalidation level which we aregoing to count it as our target point and for those sell limit order we will, take it as our taking profit zone..

GBPNZD - Short Term Short Opportunity Looking to take a quick short from the 1.93 area
Price is between the 50 - 62 fib levels + in a fair value range.
(Still holding my 1.886 buy as well)

GBPJPY, Sell Setup
Looking for a sell from 155
Confluence = -D Order Block + 62 - 70.5 Retracement
Targeting 100 pips and will leave a 20% runner.
