Market next move 🔍 Disruption/Critique of the Current Target Analysis:
1. Lack of Technical Justification:
The chart marks a “Target” level without referencing a clear technical basis (e.g., resistance, Fibonacci level, or moving average).
Without a corresponding pattern or indicator signal (e.g., breakout, double bottom, divergence), the target seems arbitrary.
2. Volume Spike Misinterpretation:
While there’s a volume spike in the last candle, it's accompanied by a bearish candle, suggesting potential selling pressure, not buying strength.
A bullish continuation would ideally require a green candle with increasing volume, which is absent here.
3. Market Context Ignored:
No consideration of broader market context such as macroeconomic news, DXY strength, or interest rate expectations which heavily impact GBP/USD.
The U.S. flag icon indicates upcoming news – trading before such events can be risky and invalidate the technical target.
4. Resistance Zone Overlooked:
The “Target” lies near the 1.3500 psychological level, which often acts as resistance. This isn’t discussed or marked.
Recent price action near that level shows rejection, making it a questionable target without strong buying confirmation
Forextradingzones

Market next move ⚠️ 1. Weak Bullish Continuation Signal
The current price action shows a rejection wick on a red candle, signaling selling pressure near the recent highs.
Despite the upward move earlier, this could be a short-term exhaustion rather than strength for further upside.
---
📉 2. No Follow-Through After Bullish Spike
There was a strong bullish candle earlier, but:
No significant follow-up to break past that level convincingly.
Price appears to have stalled or even reversed after that spike — possibly forming a bull trap.
---
🔄 3. Overhead Resistance at Target Area
The "TARGET" label sits near recent highs, which have already been rejected once.
Without clear breakout volume, this zone might act as resistance, not a logical next stop.

Market next target ⚠️ 1. Bearish Momentum Remains Intact
The last few candles are strongly bearish, with steep declines and high red candle volume.
Attempting to project an upside target amid this current bearish drive lacks alignment with actual market sentiment.
---
📉 2. Lack of Reversal Candlestick Patterns
There is no clear bullish reversal pattern visible at the point of target placement:
No hammer, bullish engulfing, or morning star pattern.
The price may just be pausing before continuing its downward trend.
---
🔊 3. Volume Discrepancy
The rising volume on red candles vs. low volume on recent green candles shows selling pressure outweighs buying interest.
A reliable bullish setup would typically come with higher buying volume after a selloff, which is not yet seen.
---
🧭 4. Misleading “Target” Location
The marked target is at a higher high, near 33.75–34.00 area, which:
Is not supported by immediate technical breakout
Seems to ignore the last failed attempt to break above that level
Appears overly optimistic given the current trend direction

Market next move
🔍 1. Weak Confirmation for Target Level
The marked "TARGET" area lacks strong technical confirmation such as:
Resistance zone retest.
Fibonacci level confluence.
Moving average alignment.
Without solid technical backing, this target may appear speculative.
---
📉 2. Bearish Momentum is Strong
The last few candles show strong red (bearish) momentum.
The price has broken short-term support levels (e.g., local lows from the 29th).
Volume is increasing on bearish candles, signaling strong selling pressure.
Setting a bullish target while in a bearish momentum phase might be premature.
---
🕒 3. Timeframe Limitations
This is a 1-hour chart, which is more prone to noise and false signals.
Higher timeframes (like 4H or Daily) should be checked to validate this upward target.

Market next move 🔻 Potential Disruptions to the Bullish Scenario:
1. False Breakout Risk at the Resistance Zone
The price is hovering near a horizontal resistance zone (red box).
Repeated wicks at this level suggest selling pressure.
If price breaks above slightly and then pulls back inside the range, it could be a bull trap, triggering a sharp drop (red arrow).
2. Weak Follow-Through on Volume
Recent bullish candles show no increase in volume.
This hints at lack of conviction among buyers, increasing the chance of a reversal rather than continuation.
3. Bearish Divergence Possibility
If we applied RSI or MACD here, there’s a high chance of bearish divergence forming (price making higher highs, while indicators show lower highs), signaling potential reversal pressure.
4. Upcoming U.S. News Events
U.S. economic announcements (indicated by icons) could strengthen the USD, causing GBP/USD to drop suddenly despite the bullish technical structure.
5. Bearish Candlestick Pattern Forming
If the current or next candle closes as a shooting star, evening star, or bearish engulfing, it would be a classic reversal pattern from resistance.
6. Liquidity Grab Above Highs
Market makers may push the price above resistance to trigger stop-losses and induce longs, then reverse—classic liquidity hunt scenario.

Market next move 🔻 Disruption Scenarios:
1. Resistance Zone at Target Level
The marked "Target" could coincide with a strong resistance level from a previous high.
Price may reject this level again, forming a double top or bearish reversal candlestick pattern (e.g., shooting star or bearish engulfing).
2. Volume Divergence
The recent uptrend shows a slight drop in buying volume.
If price increases while volume decreases, it signals a potential exhaustion of bullish momentum.
3. Upcoming News Events (Fundamentals)
The chart shows several upcoming economic events (news icons).
Any negative surprise from U.S. data or positive Eurozone data could reverse the trend sharply.
For example, better-than-expected U.S. employment data could strengthen the USD, pushing EUR/USD down.
4. Overbought Condition
If we add an RSI (Relative Strength Index) or Stochastic oscillator, the price might already be in the overbought zone, suggesting a correction is due.
5. Fake Breakout Trap
If the price hits the “Target” but then fails to close above it, it could be a bull trap, triggering short positions and leading to a sharp sell-off.

Market next move 🔺 Disruption to Bearish Thesis
1. Strong Bullish Momentum Recently
Recent candles show a series of green bullish candles with increasing size.
Indicates strong buying interest—not a sign of exhaustion, which would support further downside.
2. Volume Spike on Green Candles
Volume surged during the recent bullish candles.
This typically signals accumulation, not distribution — contradicting the bearish outlook.
3. Failure to Break Key Support
Price previously bounced sharply from below 33.0000, showing buyers defended that zone.
This bounce suggests the support is strong, weakening the argument for a move toward the lower target.
4. Reversal Pattern Possible (Double Bottom)
The chart may show early signs of a double bottom or higher low, both bullish reversal signals.
These patterns would negate the bearish projection if confirmed with a higher high.
5. Divergence from US Dollar Weakness
If the US Dollar shows weakness, silver could rally due to its inverse correlation.
The marked target may not be achieved if macro forces support precious metals.

Market next move 🔻 Disruption to Bullish Thesis
1. Resistance Zone Near Target
The "Target" area might align with a previous resistance level (historically where price has reversed or consolidated).
If price hits that zone, it could stall or reject, rather than break through.
2. Bearish Volume Divergence
While the candles are green and pushing upward, volume is not increasing significantly.
Lack of strong buying volume can suggest a weak rally — potentially a bull trap.
3. Trend Context: Larger Downtrend
The chart shows a strong prior downtrend before the recent small upward push.
This move could be a dead-cat bounce or retracement within a broader bearish move.
4. Fundamental Risk: USD Strength
If the US Dollar Index (DXY) strengthens due to macroeconomic data or Fed commentary, gold (USD-denominated) typically drops.
The calendar icons suggest upcoming US economic data, which could disrupt gold’s movement.
5. Candle Structure Shows Exhaustion
The current bullish candles are smaller compared to previous strong red ones.
This may imply momentum exhaustion before reaching the target.

Market next move
🚨 Disruption: Bearish Outlook
🔻 1. Lower High Pattern Forming
Price peaked earlier and has not made a new high. Instead, we’re seeing a flattening top. This could indicate distribution rather than continuation. A failure to break above ~$2,675 confirms a lower high.
🔻 2. Diverging Momentum
The price has moved sideways with decreasing volume, suggesting momentum is fading. Buyers may be losing interest, setting up for a reversal or sharp dip.
🔻 3. Bearish Candlestick Rejection
Recent candles show upper wicks, signaling selling pressure at highs. If this continues, the price may be forming a rounded top, not prepping for a breakout.
🔻 4. Potential Breakdown Zone
If ETH falls below the ~$2,620 support region, it opens the door to $2,580 or even $2,540, especially ahead of upcoming economic events (marked on the chart) which may spook risk markets.
🔻 5. Liquidity Trap Risk
This small bounce could be a liquidity trap—pulling in long traders before reversing sharply. This tactic often happens ahead of volatility spikes

Market next target
📊 Original Analysis Summary:
Bias: Bullish reversal expected from the support box.
Path: Minor pullback followed by a breakout toward a higher target.
Indicators: Green arrow bounce, blue and yellow upward paths projecting continuation.
---
🚨 Disruption & Bearish Risks:
🔴 1. Support Zone is Weak
The price dipped into the red support box and bounced, but barely made a strong recovery. A weak reaction from this zone could signal buyers are hesitant or exhausted.
🔴 2. Bear Flag Formation
The current price action could be forming a bear flag pattern: a brief upward consolidation following a sharp drop. If confirmed, this would likely lead to another leg down, not up.
🔴 3. Volume Discrepancy
The bounce lacks volume confirmation—note the relatively low buying bars after the large red selling volume spike. This suggests weak bullish conviction and potential for another sell-off.

Market next move
📊 Current Analysis Summary:
Pair: USD/JPY on the 1-hour timeframe.
Bias: Bullish breakout above a minor consolidation (highlighted box).
Target: Set higher, implying continuation of upward momentum.
Arrows: Show bullish path with a minor pullback, then a breakout continuation.
---
❌ Disruptive Breakdown:
🔴 1. Fake Breakout Risk
Price is testing the upper bound of the consolidation box. If this breakout fails to hold, it could trap late buyers. A rejection back inside the box might trigger a bearish reversal—a textbook bull trap scenario.
🔴 2. Volume Divergence
Despite the green breakout candle, the volume spike is not aggressive enough. If volume fails to increase further, it may suggest exhaustion, not momentum. This divergence undermines the breakout’s credibility.
🔴 3. Fundamental Uncertainty
Several U.S.-related economic icons (e.g., high-impact news) are visible. A hawkish BoJ or weaker-than-expected U.S. data could sharply reverse USD strength, causing a retracement or dump back below 145.000.
🔴 4. Overextended Short-Term Move
The steep rise could signal near-term exhaustion. RSI or other momentum indicators (not shown here) likely suggest overbought conditions, increasing the probability of a cool-off retracement.
🔴 5. Liquidity Grab & Drop Setup
Price might poke just above the box (to trigger stop losses and attract breakout traders), then reverse aggressively downward—a liquidity sweep or stop-hunt move before the real direction emerges.

Market next move 🧠 Disruptive Analysis:
🔴 1. False Breakout Potential
The marked box shows a consolidation zone. While the green candle breaks slightly above it, this might be a trap (false breakout). If there's no strong follow-through, price may sharply retest or drop back inside the box—a classic bull trap.
🔴 2. Bearish Volume Profile
Volume spiked on the initial drop, and even though there's some green candle volume, it’s not convincingly higher than previous bars. This could imply weak buyer commitment at this level, suggesting a potential reversal downward.
🔴 3. Overhead Resistance
Even if price breaks out, it faces immediate resistance around 1.3485–1.3500, where multiple wicks formed earlier. This could stall or reject the move, invalidating the bullish "Target."
🔴 4. Economic Risk
The U.S. economic event icons below suggest incoming USD-related news. If the data is USD-positive (e.g., strong employment or inflation), it could strengthen the dollar and push GBP/USD lower, negating the bullish move entirely.

Market next move Current Analysis Breakdown:
Pair: EUR/USD on a 1-hour timeframe.
Recent Action: Sharp decline with a small bullish reversal candle.
Assumption: A potential bounce or reversal targeting the area marked as "Target."
Volume: Increased during the decline and slightly bullish at the last candle.
Technical Area: The “Target” is set above the current price, implying a bullish move is expected.
---
Disrupting the Analysis:
Let’s introduce potential bearish or contrarian scenarios to question the bullish target assumption:
1. False Reversal / Dead Cat Bounce
The small green candle after a strong red volume drop could simply be a temporary retracement or a dead cat bounce—a short-lived recovery before the price resumes falling.
2. Volume Analysis Contradiction
While volume has increased, the spike occurred mostly during red candles (bearish). This indicates strong selling pressure, not accumulation. The green candle’s volume is relatively small, suggesting weak buyer interest.

Forex Trading Time Zones: Market Hours and OverlapsForex Trading Time Zones: Market Hours and Overlaps
In the world of forex trading, understanding the dynamics of different time zones is paramount. This article delves into the intricate web of currency trading time zones, exploring the 24-hour cycle, major trading hours, and the nuanced opportunities each presents.
The 24-Hour Cycle of Forex Market Time Zones
The forex market's distinctive feature of being open 24 hours a day, five days a week, is a testament to its unparalleled accessibility, dynamics, and decentralised nature. Unlike traditional financial markets constrained by fixed trading hours, the forex market operates continuously, commencing in Asia on Monday and concluding in North America on Friday.
Major financial centres in different time zones steer the dynamics of the forex market, acting as the primary drivers of market activity during their respective business hours. That complex interplay creates distinct trading periods, each characterised by unique market conditions and opportunities.
Key Forex Session Time Zones
Knowing the trading hours of the major forex trading hours is fundamental for any trader aiming to capitalise on the dynamic nature of the market.
Winter time:
- London Session: From 8:00 AM to 5:00 PM UTC
- New York Session: From 1:00 PM to 10:00 PM UTC
- Sydney Session: From 09:00 PM to 6:00 AM UTC
- Tokyo Session: From 11:00 PM to 8:00 AM UTC
Summer time:
- London Session: From 7:00 AM to 4:00 PM UTC
- New York Session: From 12:00 PM to 9:00 PM UTC
- Sydney Session: From 10:00 PM to 7:00 AM UTC
- Tokyo Session: From 11:00 PM to 8:00 AM UTC
Different Time Zones in Forex Trading Create Opportunities
The diverse forex trading time zones offer a rich tapestry of opportunities, each session presenting distinct characteristics that traders can strategically exploit.
London Session
The London session time provides opportunities for traders to engage in high-liquidity markets. Currency pairs involving the euro (EUR) or the British pound (GBP), such as EUR/USD and GBP/USD, tend to be particularly active during this period. The early morning volatility during the London session trading time can be harnessed for quick trades or trend-establishing moves.
New York Session
As the New York session time kicks in, currency pairs involving the US dollar (USD) or other currencies of countries in the same time zone take centre stage. Pairs like USD/MXN and USD/CAD experience heightened volatility and amplified market activity.
Sydney Session
While the Sydney session may exhibit lower volatility, it sets the stage for the day's trading. Currency pairs tied to the Australian dollar (AUD) and the New Zealand dollar (NZD), like AUD/USD and NZD/USD, can witness initial movements during this period, creating opportunities for strategic positioning.
Tokyo Session
The Tokyo session focuses on the Japanese yen (JPY) pairs, offering traders the chance to tap into the unique characteristics of this market. Currency pairs like USD/JPY and EUR/JPY may see increased activity, presenting opportunities for trend-following or counter-trend strategies.
Session Trading Strategies
The convergence of major financial hubs during specific currency trading time zones creates a unique environment that can be exploited strategically. Let’s examine three strategies for each major forex time zone.
London Session Breakout Strategy
The London Session Breakout strategy is based on the significant increase in trading volume and volatility when the London market opens, specifically between 7:00 AM and 10:00 AM UTC (summer time) or 8:00 AM and 11:00 AM UTC (winter time). However, most focus is often placed on the range between 8:00 AM and 9:00 AM summer time or 9:00 AM and 10:00 AM winter time. This surge during the London trading session often leads to notable price movements, particularly in forex pairs like GBP/USD and EUR/USD, making it an ideal time for breakout strategies.
Entry
- Traders monitor the early London trading hours. The idea is to look for a specific range with clear high and low boundaries during this time.
- They set buy stop orders slightly above the high of this range and sell stop orders slightly below the low, aiming to capture the breakout direction.
Stop Loss
- Stop losses are strategically placed slightly below the most recent swing low for buy positions and vice versa, offering potential protection against false breakouts.
Take Profit
- Some traders may prefer to close the position as the New York session begins, as reversals are common during this session overlap.
- Alternatively, trailing stops might be employed to take advantage of extended price movements if the trend continues strongly after the breakout.
New York Reversal Strategy
The New York Reversal strategy exploits the heightened volatility and liquidity that occur at the start of the New York session. While there isn’t a perfect correlation, it’s common to see the initial London trend extended early into the New York session before a reversal, usually between 12:30 PM and 2:00 PM UTC summer time and 1:30 PM and 2 PM UTC winter time. This strategy is particularly effective due to the influx of trading activity and market orders when the US markets open.
Entry
- Traders often monitor the market around the first couple of hours of the New York forex session time, looking for signs of reversal. This may be a divergence between a price and a momentum indicator, a reaction from a significant support or resistance level, a candlestick or chart pattern, and so on.
- Once the trader has confirmation that the London trend may be reversing, they enter a position.
Stop Loss
- Stop losses are generally placed just beyond the nearest swing high or low. This helps potentially protect against losses if the anticipated reversal does not occur.
Take Profit
- Traders frequently set profit targets at significant support or resistance levels established during the London session.
- Alternatively, traders might trail their stop loss to follow the market movement and maximise potential gains.
Tokyo Volatility Breakout Strategy
The Tokyo Volatility Breakout strategy leverages the increased trading activity and liquidity at the start of the Tokyo session time. This strategy is best suited to JPY pairs like USD/JPY, EUR/JPY, and GBP/JPY, which often see significant price movements due to the influx of market participants at Japan’s forex market open time.
Between 9:00 PM and 10:00 PM UTC summer time (8:00 PM and 9:00 PM UTC winter time), volume and liquidity dry up significantly as the New York session closes. 10:00 PM and 11:00 PM UTC summer time (9:00 PM and 10:00 PM winter time) sees some activity as Sydney session time begins, but the start of the Tokyo session forex time, between 11:00 PM and 12:00 AM, can kickstart a new trend and break out from the typical ranging conditions from the previous few hours.
Entry
- Traders often monitor the market and look for breakouts as the Tokyo session begins.
- Bollinger Bands can be used to identify these breakouts, typically characterised by the bands squeezing together before the price closes strongly outside the upper or lower band, potentially indicating the start of a trend.
Stop Loss
- Stop losses are generally placed beyond the nearest swing high or low or beyond the opposite side of the Bollinger Band. This helps potentially protect against losses if the breakout does not result in a sustained trend.
Take Profit
- Profit targets are often set at significant support or resistance levels established in previous sessions.
- Alternatively, positions might be closed at the start of the London session (around 7:00 AM - 8:00 AM UTC) to avoid potential reversals that occur with the increased liquidity and trading volume as European markets open.
Tailoring Your Trading Schedule to Forex Currency Time Zones
Crafting an effective trading schedule involves a personalised approach, taking into account a trader's individual location and trading style objectives.
Different Trading Styles: Maximising Opportunities
Forex time zones often determine specific forex rate behaviours. For day traders, the volatility and liquidity during overlapping activity can provide ideal conditions for executing rapid trades. The heightened volatility and liquidity are even more advantageous for scalpers seeking to capitalise on rapid price movements by executing trades with precision.
Overlapping sessions also often mark key points where trends may continue or reverse. Traders employing trend-following or breakout-based strategies can capitalise on that momentum.
Swing traders, on the other hand, who aim to capture trends over a slightly longer timeframe, may take advantage of the distinct characteristics of individual sessions, such as the so-called stability of the Sydney session or the high volatility of the London session.
Economic Events and News Releases
Traders also consider the timing of major data releases and align that with their specific geographic location. During the London session, major European economic indicators and policy announcements can set the tone. Then, the market may respond to data from the United States that can significantly influence USD pairs, followed by economic reports from the Asia-Pacific region. The interconnectedness of the world economy can have cascading effects on currency values across the globe.
Currency Market Correlations
Currency pair correlations exhibit dynamic shifts depending on the timing and may lead to specific patterns. For example, the correlation between USD/JPY and EUR/USD can shift throughout the trading day, starting from positive during the Tokyo session and then shifting into negative during European and New York trading hours. Traders can leverage correlation analysis as a powerful tool for making informed trading decisions.
Final Thoughts
Navigating the dynamic world of forex trading requires a multifaceted understanding of the market's 24-hour cycle, the overlapping of major trading sessions, and the intricate interplay of economic events and currency correlations.
FAQ
What Are the 4 Forex Sessions?
The forex market operates 24 hours a day, divided into four main sessions based on key financial centres: the Sydney session forex time (10:00 PM to 7:00 AM UTC in the summer and 9:00 PM to 6:00 AM UTC in the winter), the Tokyo session forex time (11:00 PM to 8:00 AM UTC in the summer and winter), the London session forex time (7:00 AM to 4:00 PM UTC in the summer and 8:00 AM to 5:00 PM UTC in the winter), and the New York session forex time (12:00 PM to 9:00 PM UTC in the summer and 1:00 PM to 10:00 PM UTC in the winter).
When Does the London Session Start?
The London session starts at 7:00 AM UTC during summer and at 8:00 AM UTC during winter due to daylight saving time adjustments. This session is crucial for its high liquidity and significant overlap with other major sessions.
What Time Is the New York-London Session Overlap?
The overlap between the New York trading session time and the London session occurs from 12:00 PM to 4:00 PM UTC in summer and from 1:00 PM to 5:00 PM UTC in winter.
Do Tokyo and London Sessions Overlap?
The Tokyo and London sessions do not overlap significantly. The Tokyo session ends at 8:00 AM UTC, while the London session starts at 7:00 AM UTC in the summer. The minimal overlap from 7:00 AM to 8:00 AM UTC sees limited trading activity. In winter, sessions don’t overlap.
This article represents the opinion of the Companies operating under the FXOpen brand only. It is not to be construed as an offer, solicitation, or recommendation with respect to products and services provided by the Companies operating under the FXOpen brand, nor is it to be considered financial advice.

Market next target
⚠️ Disruption Points:
1. Dubious Support Zone
The boxed zone (highlighted as support) shows multiple rejections but no clear bullish rejection candles (e.g., no hammer, bullish engulfing).
This may be a false base forming before another breakdown, especially with declining volume.
2. No Confirmed Reversal Pattern
The chart lacks a proper reversal structure like a double bottom, inverse head-and-shoulders, or bullish divergence.
A few sideways candles ≠ trend reversal—this might just be consolidation before further drop.
3. Weak Buyer Commitment
Volume has steadily decreased as the price attempted to base out.
If buyers were serious, we’d expect to see surging green volume bars, not this tapering activity.
4. Downtrend Still Dominant
The overall market structure is still lower highs and lower lows.
Jumping into a long trade against the trend without a confirmed break above the last swing high (≈1.13250) is premature.
5. Risk-Reward Imbalance
The arrowed path assumes an ideal rise without considering realistic pullbacks or market resistance.
If a stop is set below 1.12800 (support low) and the target is 1.13400, reward is tight compared to the risk, especially if price continues chopping sideways.

Market next move 🚨 Disruptive Take on the Current Silver-CFD Setup (1 h)
⚠️ Key Issue Why It Undermines the Long-Target Thesis
1. Target looks “wishful” The arrow projects a move into the 33.55–33.60 zone without price ever clearing the nearest resistance band around 33.30–33.35. A premature target can bait traders into chasing the tail end of a relief rally.
2. Volume doesn’t back the bounce Notice how the big green climb out of the pit on the 27 th started on strong volume, but the last 10–12 candles show shrinking green bars. Demand is decaying as price inches higher—a classic recipe for a bull trap.
3. Momentum is stalling The most recent candle printed red right at the dotted mid-line, hinting at exhaustion. Without a fresh momentum kick (e.g., higher high ➜ bullish engulfing), upside continuation is statistically fragile.
4. Structure still favors lower highs The broader pattern since the 25–26 th is a series of lower swing-highs. Until that diagonal is broken decisively, every uptick remains a counter-trend bounce, not a new up-trend.
5. Macro landmine ahead The U.S. flag icon marks an impending data release. Silver’s intraday volatility tends to spike on USD events; any dollar strength could instantly unwind the thin-volume rise. Trading into news with no contingency ≠ smart risk.
6. Stop-loss placement is unclear Without a clearly defined invalidation level (e.g., below 33.00 or under the 27 th swing-low), the R-R profile is lopsided: limited upside room vs. plenty of air underneath.

Market next move 🚨 Disruption Analysis of the Gold CFD Chart
1. Over-Optimistic Target Placement
The target is placed significantly above the current market trend without substantial confirmation of a reversal.
The recent bullish candles are weak and not supported by volume spikes.
There's a bearish engulfing pattern forming, suggesting a possible continuation of the downtrend.
2. Weak Volume Confirmation
The rise in price does not coincide with a strong increase in buying volume.
Volume bars are mixed and not clearly favoring buyers, indicating market indecision rather than strength.
3. False Bottom Assumption
The assumption that the market has bottomed on the 27th is speculative.
Without a double-bottom pattern or significant bullish divergence on an RSI/MACD (not shown here), the upward bias is unjustified.
4. Price Action Breakdown
Lower highs and lower lows are still visible.
The short bounce could be a retracement rather than a trend reversal.
5. Macro or Fundamental Events Ignored
Given the presence of the US flag icon (economic event), any upcoming data release (like GDP, interest rates, etc.) could drastically alter market direction.
Trading before news without adjusting targets and stops is risky.

Market next move
1. Misleading Bullish Label
Issue: The chart marks the latest price action as "Bullish" based on a short-term recovery.
Disruption: This could be a dead-cat bounce — a temporary recovery in a downtrend. The overall trend from the prior candles is bearish, and a few green candles don’t confirm a reversal without volume or structural confirmation.
---
2. Volume Analysis Ignored
Issue: The volume spike accompanying the recent green candles is not fully analyzed.
Disruption: Although there's higher volume, it could be short covering or a reaction to news, not organic buying interest. No volume divergence or institutional footprint confirmation is given.
---
3. No Confirmation Pattern
Issue: No mention of chart patterns (e.g., double bottom, inverse head and shoulders, etc.).
Disruption: Calling it “bullish” without a clear technical pattern or confirmation (like a break of resistance or retest) is speculative.
---
4. Vague Target
Issue: The “Target” is labeled without specifics.
Disruption: There's no price level, Fibonacci retracement, or resistance level justification. A target without rationale lacks credibility.
---
5. No Risk Management
Issue: No stop-loss or risk level is discussed.
Disruption: Without defined risk-reward ratio, the analysis is incomplete and not tradable. Every strategy needs downside planning.

Market next target Disruption of the Analysis
1. Weak Confirmation of Reversal: The chart shows a possible target zone after a recent small bullish move, but the candlestick reversal pattern is weak and lacks a strong confirmation candle. Without a bullish engulfing or a high-volume breakout, this “Target” may be premature.
2. Downtrend Momentum Intact: Despite the slight bounce, the broader trend remains bearish (visible by the previous lower lows and lower highs). No trendline break or structural shift supports a move toward the target.
3. Volume Does Not Support Breakout: Although there is a small spike in green volume, it does not exceed previous bearish volume, which suggests that buyers are not yet in control.
4. Over-reliance on Visual Targeting: The “Target” label appears to be placed based on a subjective expectation, not on a clear technical structure like a resistance level, Fibonacci retracement, or moving average. This makes it speculative.
5. Lack of Indicator Confluence: There are no visible indicators (like RSI, MACD, or EMA crossovers) shown to justify a reversal. Trading solely on price action without confirmation from indicators reduces reliability.

Market next move
Bullish Disruption Scenario
1. False Resistance Breakdown:
The red zone marked as resistance may fail to hold. The recent strong bullish candle and volume spike hint at possible accumulation rather than rejection.
2. Breakout and Retest Play:
Price could break above the resistance zone, retest it as new support, and then continue higher—invalidating the expected red and blue downward paths.
3. Volume Behavior:
The most recent green volume spike could signal strong institutional buying, which often precedes a breakout.
4. Higher Lows Formation:
Price structure is creating higher lows, which is a bullish signal in consolidation before breakout.
5. Market Sentiment:
If upcoming U.S. macroeconomic data (see flag icons) is dovish or supportive of crypto risk-on assets, BTC could rally sharply.

Market next move Bearish Disruption Scenario
1. Resistance Zone Holding (Red Box):
The current price is testing a strong resistance zone (highlighted in red).
There’s a chance that this level won't be broken easily due to historical supply or institutional sell orders.
2. Volume Spike Warning:
The recent green volume bars show increased buying, but this could signal buyer exhaustion if no significant breakout follows.
3. Fake Breakout Potential:
Price may perform a false breakout above the resistance, trapping late buyers before reversing down sharply.
4. Bearish Candlestick Confirmation:
If the next few candles form a reversal pattern (like a bearish engulfing or shooting star), it would support a short-term correction or drop.
5. Macro & News Risk:
Note the upcoming economic events (flag icons). U.S. or Japan economic data could disrupt the technical setup.

Market next move . Support Fatigue / Breakdown Risk
Observation: Price has tested the red support zone multiple times.
Disruption: Repeated tests of support often weaken it. If it breaks, a sharp drop may follow.
Implication: Instead of bouncing, EUR/USD could slide below 1.13200, triggering stop-losses.
---
2. Lack of Bullish Volume Confirmation
Observation: The recent candles show low volume on bullish attempts.
Disruption: Weak demand at support indicates hesitation among buyers.
Implication: Without a volume spike, any bounce may be short-lived or fail entirely.
---
3. Bearish Momentum Still Intact
Observation: Price action shows consistent lower highs and lower lows.
Disruption: The short-term trend is still bearish, so this could be a pause before continuation down.
Implication: A false bullish break could trap long traders before a drop resumes.
---
4. Fundamental Risks (USD Strength)
Disruption: Any U.S. data surprises or hawkish Fed comments (noted by U.S. event icons on the chart) could push USD higher, dragging EUR/USD down.
Implication: Technical bounce setups could be invalidated by macro events.

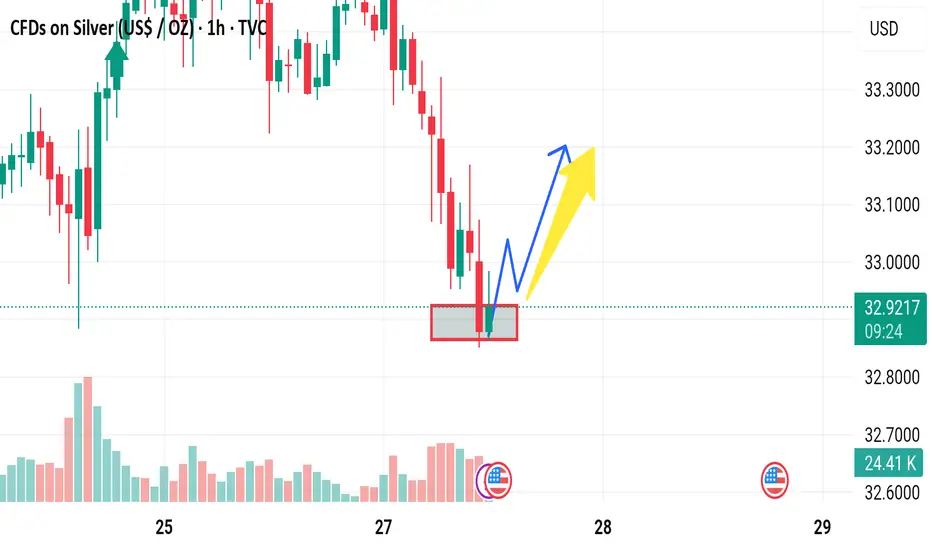
Market next move
1. False Breakout / Bull Trap Risk
Observation: Price just touched the support and bounced slightly.
Disruption: If buyers fail to push above the next resistance (around 32.95–33.00), it could be a bull trap.
Implication: The bounce might just be a short-covering rally before another leg down.
---
2. Weak Buying Volume
Observation: The bounce lacks strong green volume bars so far.
Disruption: Weak volume on the bounce suggests limited buyer conviction.
Implication: Without a volume surge, the upward move could fizzle out quickly.
---
3. Lower High Structure
Observation: The trend before the support touch is clearly down.
Disruption: This bounce may only form a lower high before continuation lower.
Implication: The larger trend remains bearish unless 33.20+ is reclaimed with strength.
---
4. Fundamental Headwinds
Disruption: Any upcoming data like strong USD, rising interest rates, or weak industrial demand could push silver down despite technical setups.
Implication: Bullish setups could fail fast due to macroeconomic pressure.