Market next target ---
Bearish Disruption Analysis
1. False Breakout Zone (Red Box Area):
The price is revisiting the red box area (potential supply/resistance zone). If it fails to break and close above this zone convincingly, it may signal a bull trap.
Previous attempts to push higher were rejected around this level, showing seller strength.
2. Lower High Formation Risk:
The recent upward move might form a lower high compared to the high from the 25th.
If price reverses below $33.30–$33.20, it could trigger more downside momentum, potentially targeting the $33.00 or even $32.80 level.
3. Volume Divergence:
Notice the decline in volume as price attempts to rise. Lower buying volume may indicate weak bullish conviction, which increases the risk of a downturn.
4. Bearish Candlestick Reversal Pattern:
If any bearish engulfing or shooting star candlestick forms near resistance, it would support a bearish reversal case.
Forextradingzones

Market next move Original Analysis Summary:
The chart shows a support area around the 3340 USD level.
There are two bullish scenarios outlined with blue and yellow arrows, implying a price increase from the support zone.
---
Disruption/Critical Analysis:
1. Overreliance on Short-Term Support:
The chart assumes the marked support area will hold, but no confirmation (like a bullish candlestick pattern or strong buying volume) is evident yet. A break below that zone could lead to a bearish move instead.
2. Volume Weakness:
Recent candles near the support zone are not backed by significantly increasing volume. This suggests weak buying interest, making the bullish forecast potentially over-optimistic.
3. No Consideration of Macroeconomic Events:
The chart doesn't factor in fundamental drivers (like U.S. economic data, Fed announcements), which can easily invalidate technical patterns.

Market next move
Disruption of the Bullish Bias:
1. False Breakout Risk
The area marked with a red rectangle might be showing signs of consolidation, but there's a possibility that the bullish breakout is a bull trap.
Volume does not strongly confirm a breakout; note that the volume on the recent upward candles is not significantly higher than the surrounding bars — often a sign of weak buyer conviction.
2. Resistance Overhead
BTC is approaching the psychological level of 110,000, which may act as resistance.
Price action shows several small-bodied candles with wicks, indicating indecision or rejection from higher levels.
3. Bearish Divergence Potential
If paired with RSI or MACD indicators (not visible in this image), there might be signs of bearish divergence — price making higher highs while the indicator makes lower highs.
4. Liquidity Sweep Scenario
The recent wick into the highlighted zone could be a liquidity sweep — grabbing stop-losses before reversing downward.
This would support a bearish move contrary to the bullish forecast.
5. Market Sentiment & Fundamentals
Ignoring macro events such as Fed decisions, ETF movements, or regulatory news can be dangerous. If bearish news breaks out, technical setups can fail fast

Why EUR vs GBP Could Be Your Best Trade This Week!When it comes to forex swing trading or even forex intraday trading, the temptation to zoom into lower timeframes—like the 15-minute or 1-hour charts—is strong. Most forex traders focus on short-term momentum, often diving into scalping strategies that chase quick pips. However, the real edge lies where most don’t look: the higher timeframes, particularly the weekly chart. The EUR/GBP forex pair is a perfect example of these higher timeframes' power, especially when paired with smart money concepts like demand and supply imbalances.
EUR/GBP: A Hidden Gem for Forex Swing Traders
The EUR/GBP Forex cross pair is often overlooked compared to major USD-based pairs. However, for seasoned swing traders and institutional players, EUR/GBP offers deep liquidity, cleaner technical analysis and price action structures, and strong reaction zones that are respected time and time again.
At the end of May 2025, a significant weekly demand imbalance at 0.8384 finally took control of price action—something smart money traders had been anticipating for months. This wasn't a surprise for those watching the higher timeframes. Similar to how the previous weekly imbalance at 0.8299 took control in February 2025, these zones have proven critical in guiding the medium- to long-term direction of EUR/GBP.

Market next target Original Analysis Summary:
Support Area Identified: Around 3335.
Expected Scenario: Bounce from support leading to a bullish move toward the "Target" zone.
Two Paths Shown: A direct bounce (yellow) or a fakeout/drop below support followed by a bullish reversal (blue arrow).
---
Disruption Analysis: Bearish Scenario
1. Support Breakdown:
Instead of bouncing at the support area (~3335), the price fails to hold and breaks down below.
Increased volume or bearish momentum could lead to this breakdown.
2. New Target Zone:
If support is broken, the next key demand zone may lie around 3300 or below, making that the new target.
Traders expecting a bounce may get trapped (bull trap), adding to sell pressure.
3. Invalidation of Bullish Setup:
The presence of consecutive lower highs leading into the support area could indicate weakening bullish momentum.
A retest of the broken support as new resistance would confirm the shift in structure (support becomes resistance).

Market next target
Original Analysis Summary:
Identifies a bullish breakout above a support zone.
Expects continuation upward to a target zone after minor pullback.
Assumes support holds and bullish trend continues.
---
Disruptive Bearish Interpretation:
1. Fakeout Risk (Bull Trap):
Price broke above the support area, but this could be a false breakout designed to lure in long positions before a reversal.
2. Trendline Retest Failure:
The price is testing a trendline or resistance zone. Failure to break above this area could indicate rejection and reversal.
3. Bearish Divergence:
If momentum indicators (e.g., RSI or MACD, not shown here but inferred) show divergence, it may warn of weakening bullish strength despite price rising.
4. Candlestick Exhaustion:
Recent candles show upper wicks and slowing momentum — a common sign of potential exhaustion.

Market next target Original Analysis Summary:
Support area at ~1.1400 holding price.
Expectation: Bounce off support and continuation to higher target.
Arrows indicate a bullish bias after minor retracement.
---
Disruptive Bearish Interpretation:
1. Exhaustion at Top:
Strong upward rally could be showing signs of buying exhaustion, especially after the sharp vertical move.
The current top wick suggests rejection from higher levels.
2. Bearish Reversal Candles:
If a shooting star or bearish engulfing pattern forms near the target area, it could signal a reversal.
The current candle shows a long wick, which often precedes pullbacks.
3. False Breakout Risk:
The price could have broken above a resistance level only to trap breakout buyers before reversing downward.
This would trigger a move below the red box (support area).

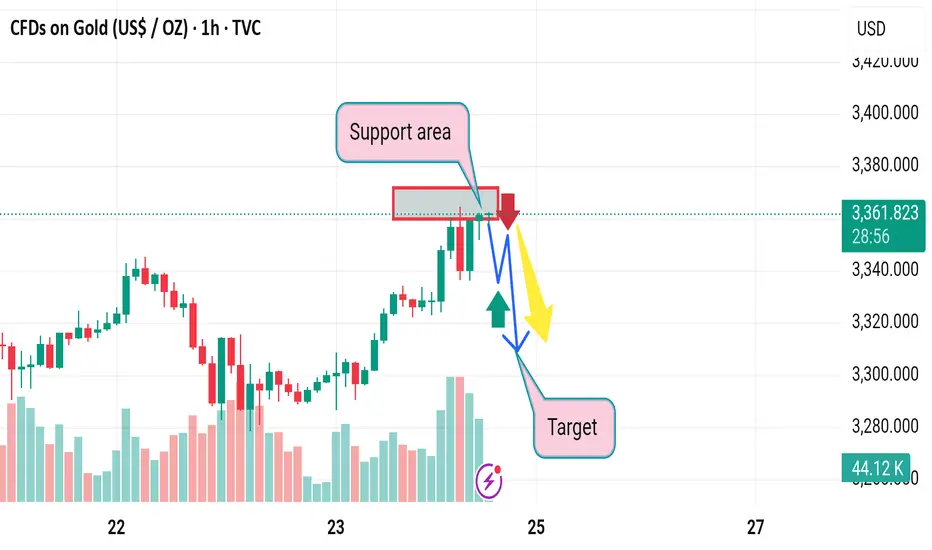
Market next move Original Analysis Summary (Bearish):
Support area is being tested.
Arrows suggest a breakdown below support with targets around 3,280–3,240.
Volume shows a slight increase, possibly hinting at selling pressure.
---
Disruptive Bullish Interpretation:
1. False Breakdown Trap:
Price may briefly dip below support (bear trap) to flush out weak holders before bouncing back strongly.
This would invalidate the bearish scenario and trigger short covering.
2. Volume Analysis:
Although red candles dominate, the volume spike could also indicate buying absorption at this level.
Hidden accumulation may be underway.
3. Support Holding Well:
The support zone has been tested multiple times and still holds — which can also be interpreted as strong buying defense rather than weakness.
4. Potential Bullish Reversal Pattern:
If a bullish candlestick formation like a hammer or engulfing forms near the support zone, it could signal reversal back to the upside.
Target back to 3,380–3,400+ becomes viable.

Market next target Original Analysis Summary:
Support Area marked: Price bounced from this level.
Bullish Target: Expectation is for the price to rise after retesting support.
Arrows: Indicate potential bullish continuation (yellow) or slight drop before rising (blue).
---
Disruption / Counter Analysis:
1. Weak Volume Support:
Volume in the support area is not significantly higher, which can indicate weak buying interest. This weakens the case for a strong bounce upward.
2. Double Top Risk:
The chart could be forming a double top pattern near the 33.60–33.80 region. If price fails to break above, a bearish reversal might occur.
3. Bearish Divergence:
If RSI or MACD (not shown but assumed) indicates bearish divergence, upward momentum may not sustain.
4. Support Could Break:
If the support area is tested too many times (as appears here), it may eventually fail, causing a sharp drop to the next demand zone, possibly near 33.00 or lower.
5. Macro Uncertainty:
News events (e.g., U.S. economic data or interest rate news) can abruptly reverse expected trends regardless of technical setups.

Market next target 1. Mislabeling of Support Area
The red box is labeled as a support area, but price is approaching from below, not above—so technically, this should be called a resistance area.
Until price closes above it with volume, it cannot be assumed to act as support.
---
2. Volume Misinterpretation
The volume does not strongly support a breakout. The latest green bars are not significantly larger than prior volume, implying limited bullish conviction.
Lack of volume surge through resistance is often a false breakout indicator.
---
3. Single Scenario Bias
The analysis shows only an upside (bullish) projection, ignoring bearish possibilities.
If price gets rejected from resistance, there’s a strong chance of a pullback to $33.00 or lower, especially with weak momentum.
---
4. No Confirmation Indicators
The chart lacks confirming technical indicators like RSI, MACD, or trendlines to validate the bullish scenario.
Price could be forming a lower high, indicating a possible continuation of the downtrend.

Market next target
1. Misinterpretation of Support Area
Claimed support area has already been broken previously (left of the red box), so it's no longer strong support—it might be better viewed as resistance now.
The bounce from this zone could be a liquidity trap or a fakeout, rather than genuine buying interest.
---
2. Overreliance on a Single Target Zone
The chart implies a clear target zone below, but no Fibonacci, moving average, or volume profile is shown to validate this zone.
A better analysis might include additional tools (like RSI, Bollinger Bands, or Fibonacci levels) to confirm this as a realistic target.
---
3. Volume Analysis Oversight
There is a volume spike on the most recent bullish candles, which could indicate strong buying interest, contradicting the downtrend expectation.
This might suggest a potential breakout above resistance instead of a fall.
---
4. No Risk Management Consideration
The chart lacks stop-loss levels or invalidation points, which is crucial for trading strategies.
Without a clear invalidation, the trade idea becomes more speculative.
---
5. Alternative Scenario Missing
A bullish breakout scenario (above resistance zone) isn’t given enough weight.
Given the recent strength, there is a strong case for continuation upward if the price closes above the red box with volume.
Market target 1. Support Area Assumption
Disruption: The highlighted support area is relatively narrow and based on a few candles. On a 1-hour chart, this might not provide a strong enough foundation for a meaningful bounce. The price has tested this level multiple times, suggesting weakening support rather than strength.
2. Target Projection
Disruption: The target area is drawn without showing how it was calculated—no Fibonacci level, previous resistance, or volume zone is referenced. Without clear technical justification, the target level appears speculative.
3. Pattern Expectation (Bounce Prediction)
Disruption: The blue arrow suggests a bullish reversal, but volume is declining, and there’s no strong bullish candle yet to confirm the move. In fact, multiple lower highs suggest bearish pressure.
4. Ignoring Bearish Continuation
Disruption: The red arrow suggesting a drop isn't emphasized as strongly as the bullish path. However, repeated testing of the support with no significant bounce increases the risk of a breakdown. Also, if macroeconomic conditions or broader crypto sentiment is bearish, this chart setup could break down easily.
5. Lack of Context
Disruption: The chart analysis is isolated to a short timeframe (1 hour). Without higher timeframe confluence (e.g., 4H, Daily), any short-term pattern can easily be a false signal.
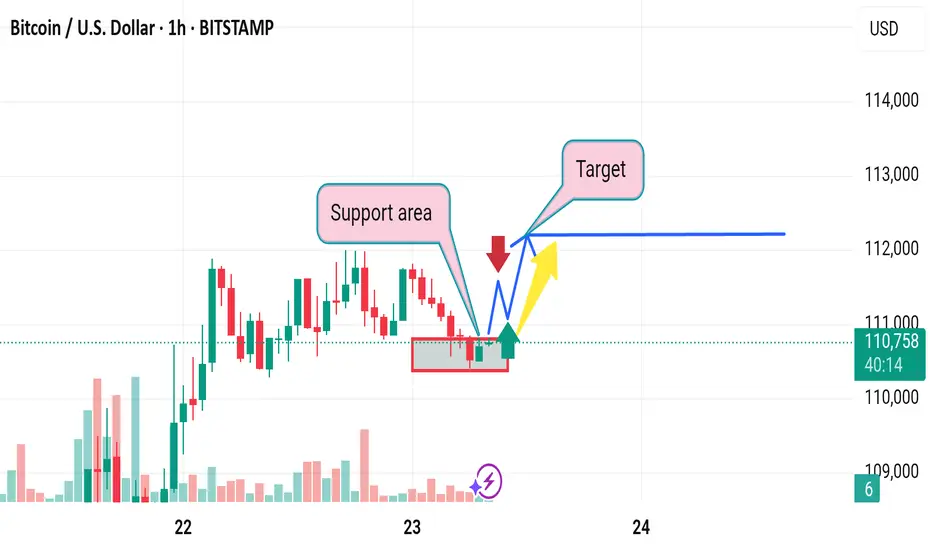
Market next move Current Analysis Summary:
Bullish Outlook: The chart suggests a bullish trend after price moves above a marked support area.
Price Scenarios:
Red arrow: Pullback to support.
Blue arrow: Bounce back upward.
Yellow arrow: Continuation of the bullish trend.
---
Disruption of the Analysis:
1. False Breakout Risk:
The move above the support zone might be a false breakout. Volume does not appear significantly increased during the breakout, which is typically needed to confirm real breakout momentum.
2. Volume Confirmation Lacking:
Although some volume is present, the breakout does not show a clear volume spike to validate strong buying interest, which challenges the bullish bias.
3. Resistance Overhead Ignored:
No mention of overhead resistance. The price may face selling pressure near 1.35000, a likely psychological and technical resistance area.
4. Over-reliance on Simple Support Zone:
The support zone is too narrowly defined. If the price dips below it slightly, it could still be a healthy retest, not a reversal, which the red arrow path implies prematurely.

Market next move Original Analysis Summary:
Price has entered a support area and is expected to bounce.
Two possible bullish paths (blue & yellow arrows) suggest a continuation toward the marked target zone.
---
Disruption Thesis: Bearish Reversal Setup
1. Overextended Rally Into Resistance
The move up into the “support area” is sharp and fast, suggesting it's a liquidity grab.
This zone might actually be a supply zone, where smart money is offloading.
Disruption Call: Price could stall or reverse sharply from this area due to lack of follow-through volume.
---
2. Volume Profile Weakness
Volume peaked earlier in the rally and is now diminishing, which often signals buyer exhaustion.
Disruption Call: Fading bullish momentum implies a fakeout, not a breakout.
---
3. False Breakout / Bull Trap
The green arrow assumes a bounce, but price may just be hovering to bait longs before dropping.
Previous swing highs near 1.1320 may act as a strong rejection point.
Disruption Call: A sudden drop below 1.1300, with a new bearish wave back to 1.1250 or lower.

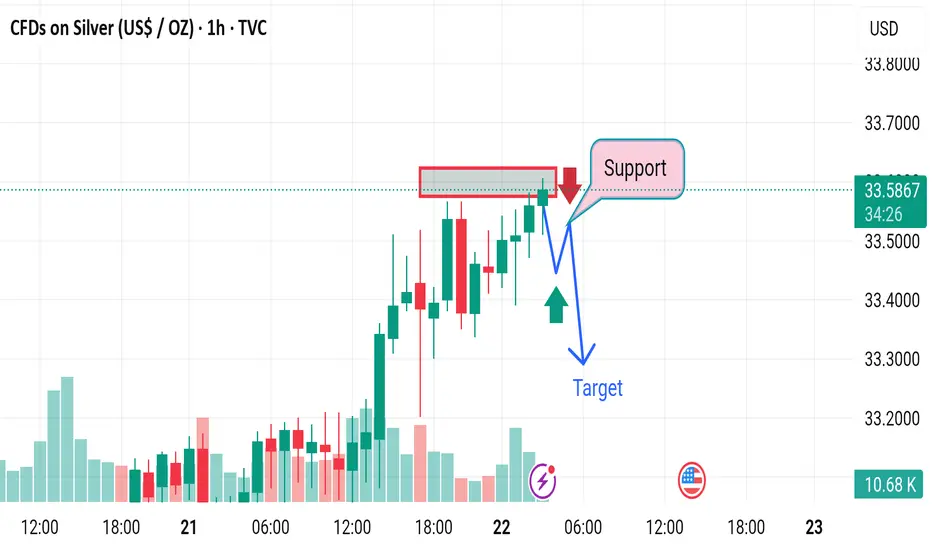
Market next move Original Analysis Recap:
Support Zone marked just below the current price.
Bearish Move Expected (red arrow) from current resistance.
Bullish Bounce Expected after initial drop (blue and yellow arrows).
Target is placed lower than current price, implying expected downward movement.
---
Disruption / Contrarian Thesis:
1. Fakeout to the Downside (Bear Trap)
The analysis assumes a rejection at resistance and a drop, but:
After the large red candle previously, the market may have absorbed all selling pressure.
Current consolidation shows higher lows—suggesting hidden buying.
Disruption Call: A quick dip below support (triggering stops), followed by a strong bullish reversal breaking through the resistance zone.
---
2. Volume Insight Ignored
Note that recent volume spiked on green candles during recovery.
Current retracement has lower volume, suggesting it may be a pause in uptrend (not a reversal).
Disruption Call: This is accumulation, not distribution. A breakout above 33.20 could happen, aiming for 33.40 or higher.
---
3. Structural Misinterpretation
The “support” identified may not be valid—it’s part of the consolidation range.
True demand zone could be deeper, around 32.90–33.00.
Market rising up Original Analysis Overview:
Support Zone: Clearly marked.
"Flying" Point: Suggests a bullish breakout.
Target: Indicates price will rise significantly.
Arrows: Imply breakout is likely to follow bullish momentum.
---
Disruption / Contrarian Viewpoint:
1. False Breakout Risk
The tight consolidation just above the support line might indicate a bull trap—a false breakout intended to lure in long positions before a sharp reversal. The “flying” point might instead be a liquidity hunt.
Disruption Call: Expect price to briefly break above resistance and then drop below support, invalidating the bullish thesis.
2. Volume Divergence
Volume is not significantly increasing at the breakout point. True breakouts typically come with a volume surge.
Disruption Call: Weak volume suggests lack of conviction. Price may revert back into the range or breakdown.
3. Macro Sentiment Shift
If macroeconomic news (e.g., Fed policy, USD strength) flips bearish for gold, technical setups may get invalidated.

Market next move
1. Support Zone Validation
Observation: Price is reacting from a labeled “Support area.”
Disruption: The support zone is based on very recent price action with limited prior structure. No confirmed double bottom, bullish engulfing, or strong rejection candle is present to confirm it as strong support yet.
---
2. Volume Context Ignored
Observation: Volume has declined during recent candles.
Disruption: A genuine reversal from support typically comes with a volume spike. The current volume profile shows weakening participation, which questions the strength of the bounce.
---
3. Premature Long Target Projection
Observation: A bullish arrow targets the 1.134–1.135 zone.
Disruption: This target is overly optimistic given the lack of a trend change signal. Price is still in a clear lower-high and lower-low structure, suggesting bearish momentum remains intact unless a breakout above 1.1300 occurs.
---
4. Bearish Scenario Underdeveloped
Observation: Only a single red arrow shows bearish rejection.
Disruption: There is no defined breakdown zone or bearish continuation pattern shown (e.g., flag or wedge). If support breaks, price could rapidly move to 1.1200, but this scenario is underrepresented.
---
5. No Confirmation Candlestick for Bullish Entry
Observation: A bullish move is anticipated from current levels.
Disruption: The current candle structure does not confirm bullish control—no hammer, engulfing, or clear reversal pattern. Entering long here could be premature without that confirmation.
---
6. Lack of EMA or RSI Confluence
Observation: Analysis is purely price-action based.
Disruption: No exponential moving averages (EMAs) or RSI are shown to validate trend change. These tools could help confirm divergence or trend reversal.

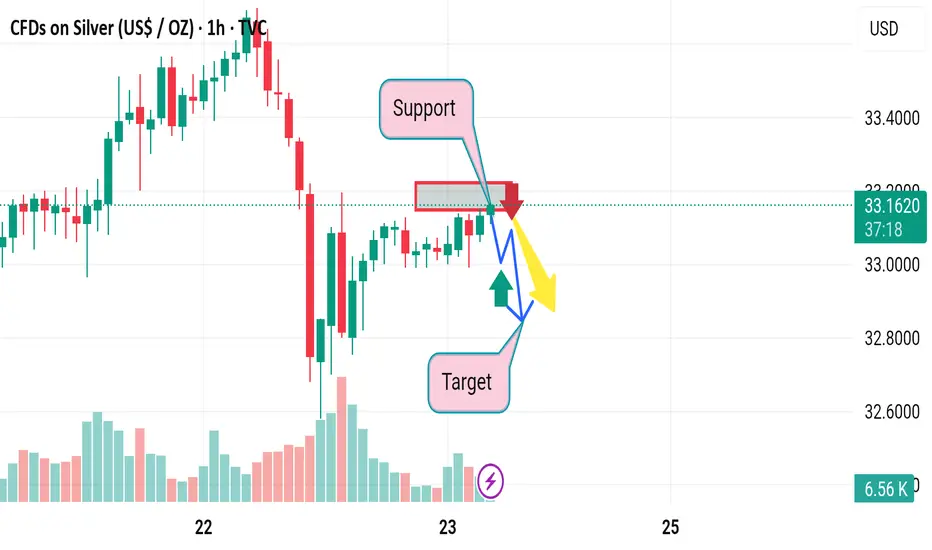
Market falls downward
1. Resistance Zone May Be Weak
Observation: A red rectangle marks a resistance area.
Disruption: This "resistance" level is based on a short-term bounce and may not have strong historical confluence. It lacks multiple rejections to establish it as a true resistance zone.
---
2. Overemphasis on Bearish Bias
Observation: Two bearish paths (blue and yellow) dominate the projection, indicating an expected drop.
Disruption: This may be prematurely bearish. There's no confirmation of rejection yet—no strong bearish candlestick pattern (like a shooting star, engulfing, or evening star) is visible in that zone.
---
3. Lack of Bullish Consideration
Observation: A small green arrow is shown but not given much weight.
Disruption: The recent candles show higher lows, indicating potential bullish pressure. If price breaks above the marked zone, it may trigger a short squeeze rally.
---
4. Volume Misalignment
Observation: Volume spikes during the bounce, especially on the green candles.
Disruption: Rising volume on a recovery typically supports continuation upward. This analysis ignores the bullish volume context and instead forecasts reversal.
---
5. No Higher Timeframe Confluence
Observation: 1-hour chart used in isolation.
Disruption: A strong bearish or bullish direction on the 4H or Daily chart would validate or invalidate this local setup. Without it, the trade thesis lacks broader context.

Flying upward 1. Assumption of Support
Observation: The "Support" zone is marked around the 3,285–3,290 level.
Disruption: This area has only a few touches and lacks clear validation. Support should be confirmed with multiple bounces and strong volume reactions. Here, volume is present but inconclusive.
2. Overly Optimistic Target
Observation: The target area is set around 3,350, which assumes a clean breakout.
Disruption: This ignores potential resistance levels between 3,310–3,330 that could act as hurdles. The price might stall or reverse before reaching that far.
3. Breakout Path Assumptions
Observation: The blue arrows suggest a bullish breakout, possibly after a retest.
Disruption: There's a strong red rejection candle marked by a red arrow—suggesting bearish momentum. Without strong bullish confirmation (like a bullish engulfing or volume spike), this breakout path is speculative.
4. Lack of Broader Context
Observation: The chart is isolated to a 1-hour timeframe.
Disruption: No higher timeframe trend is considered. If the 4H or Daily chart shows a downtrend, this small support could be insignificant and might break.
5. Volume Analysis Gaps
Observation: Volume bars are visible but not integrated into the analysis.
Disruption: No divergence or volume support is identified. Rising prices without rising volume can indicate a weak move, increasing failure chances.

Market fall down 1. Weak Bearish Confirmation
Issue: The red arrow implies a confirmed downtrend, but the price action doesn’t show a strong breakdown—just a slight dip through a thin support zone.
Disruption: Without strong bearish candles or volume spikes, the breakdown could be a false move or liquidity grab before a reversal.
---
2. Overconfidence in Double Bottom Reversal
Issue: The blue “W” pattern and green arrow suggest a possible double bottom, but no clear second bottom has formed yet.
Disruption: Assuming a reversal prematurely is risky. The price may continue dropping, invalidating the bullish reversal scenario.
---
3. Target Placement Is Vague
Issue: The "Target" is placed arbitrarily along a horizontal line without referencing key resistance levels or technical confluences.
Disruption: Without support from Fibonacci, previous highs, or indicators, the target lacks reliability and could mislead trade planning.
---
4. Lack of Volume Context
Issue: The volume histogram shows a spike during a previous down move, but no current volume analysis is integrated into the decision.
Disruption: Price action alone, especially on lower timeframes, is insufficient without volume confirmation to validate breakouts or breakdowns.
---
5. No Risk Management Displayed
Issue: The analysis includes bullish and bearish paths but omits stop-loss levels or invalidation zones.
Disruption: Without clear invalidation, the trade becomes ambiguous and exposes the trader to unnecessary risk if price deviates unexpectedly.

Market next move
1. Overreliance on Basic Support/Resistance
Issue: The analysis uses a simple support/resistance concept without clear validation (e.g., no multiple touches or volume confirmation).
Disruption: Support could easily break if there's insufficient volume or strong bearish sentiment, invalidating the buy signal.
---
2. Lack of Confirmation Indicators
Issue: There's no use of confirmation tools like RSI, MACD, or moving averages.
Disruption: Entering a "Buy" based purely on support without a reversal signal (like bullish divergence or candle patterns) increases risk.
---
3. Premature Target Setting
Issue: The target is drawn quickly after a minor dip, with no fib levels, pivot points, or historical resistance considered.
Disruption: The price might face resistance before reaching the “Target,” especially around previous highs or psychological levels.
---
4. Ignoring Downside Risk
Issue: The scenario assumes price will bounce back but doesn’t show a stop-loss or contingency for a breakdown.
Disruption: If price breaks the "Support" zone, it could trigger a stronger bearish move—this risk is not accounted for.
---
5. Misleading Arrows
Issue: Arrows (red, yellow, blue) seem speculative and oversimplified.
Disruption: They imply a clear path, which can mislead traders into thinking price action follows linear logic—real markets are more chaotic.

Market next target
Disruption: Bearish Counter-Analysis
1. Rising Wedge Pattern:
The price action resembles a rising wedge, not a bullish channel.
Rising wedges are typically bearish reversal patterns, especially after strong prior bullish moves.
2. Decreasing Volume:
Volume is tapering off as price climbs, which often signals weakening buying pressure.
Lack of strong volume near resistance suggests potential fake-out risk.
3. Bearish Divergence Risk:
Not visible here, but on RSI or MACD, rising price with slowing momentum often triggers bearish divergence.
This could suggest an imminent drop.
4. False Breakout Trap:
The highlighted resistance zone could trap late buyers.
A fake breakout followed by a strong red candle could trigger stop-loss hunts, dragging price sharply lower.
5. Macro Event Warning:
The U.S. flag at the bottom suggests high-impact news is due.
If USD strengthens, GBP/USD may reject the resistance and drop fast, invalidating the long setup.

Market next target Disruption: Bullish Counter-Analysis
1. Trend Structure:
Despite the local rejection, the overall price trend has been bullish (higher highs and higher lows).
The pullback may just be a healthy retracement, not a reversal.
2. Volume Perspective:
Volume has increased on bullish candles before the resistance test — showing buyer interest.
No significant bearish volume spike to confirm a strong reversal.
3. False Breakdown Trap:
The setup might be a bear trap — a false break below minor support to trap shorts before a bounce higher.
4. Support Holds Strong:
The identified "Support" zone could act as a launch point for a bullish continuation.
If price forms a bullish engulfing or a pin bar in that area, it could invalidate the bearish thesis.
5. Macro Impact (FOMC/U.S. data nearby):
U.S. event (flag at bottom) might bring volatility.
If news is USD-negative, Silver may spike upwards regardless of technical patterns.