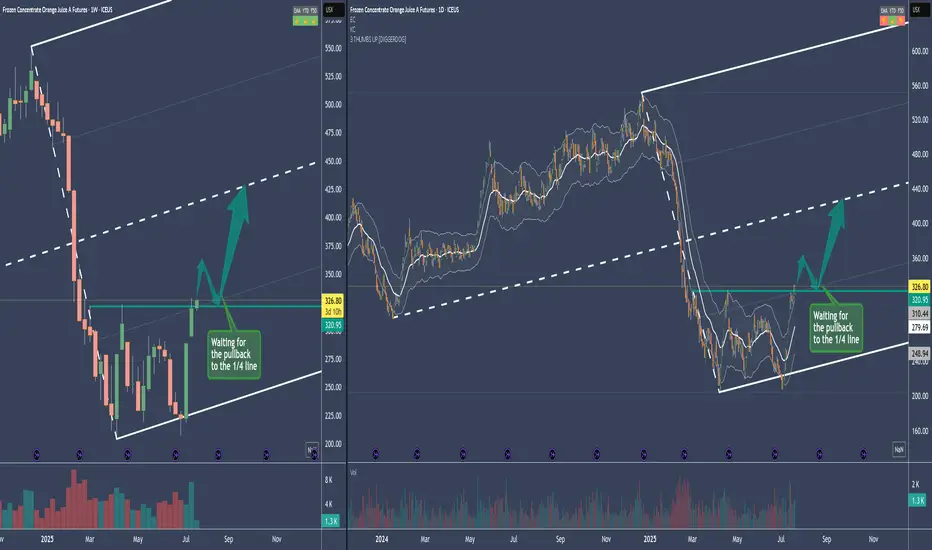
OJ - Frozen Orange Juice Long SetupThe Medianline se aka Fork, is a pullback Fork.
So what we want to see is a reversion to the mean after this drop.
The sideways action from Mar. to Jul. is a "loading" period, where Commercials load their boat.
If we break the resistance, it's usual that there will be a pullback to the prior resistance - now support. Or even into the loading zone.
Entries will be on a intraday basis.
Stalker mode on 88-)
FORK
Crude Oil - Two Scenarios and about Brain PowerPrice retests the L-MLH.
VI. - Price breaks upward, target is the centerline
VII. - Price reverses again, then the target is the 1/4 line, with a subsequent extended target at the red centerline, and possibly even lower at the white dashed warning line.
On a personal note:
I was once again told that the price didn’t do what I had projected.
...yeah, really, that’s how it is §8-)
After over 30 years in the markets and hundreds of coaching sessions, I’m still amazed that people think you can predict price movements as if with a magic crystal ball.
The fact that this belief still persists (even though they don’t understand even the absolute basics of trading) deeply concerns me at the core of my trading soul.
Because this growing irrationality clearly indicates that far too little is being done in terms of education – or humanity might simply go extinct in the next 100 years due to rapidly declining intelligence!
...maybe I should just create a chart and apply a few median lines/forks?
Happy trading to all of you and I pray for those with lesser brain power.

VISA - A Pump & Dump? Help me understand please.To places where no stock price has ever gone before..
What makes VISA so special?
The credit industry is currently staring into the abyss due to massively rising payment defaults.
Why is VISA skyrocketing in price, breaking through every barrier as if they were made of butter?
I don't know, and I'm very puzzled.
What will happen if economic conditions become even more difficult and the madness we're currently experiencing fully hits, and hardly anyone can service their consumer debt anymore?
I think at that point, VISA will look like a
Pump & Dump too like many others.
I'd appreciate any info on why VISA is rising so much.

DAX Take 1 Part 2 – Reloaded but not yet good to goThe first time, we saw the DAX poke the 1/4 line.
This was followed by several attempts (distribution by the big players), and from that point on, it headed south and the DAX rolled down the hill.
Currently, it looks very similar.
I’m watching and observing the break of the trend barrier very closely, even on smaller timeframes than the daily.
The profit targets are indicated by the red arrows.
After the break of the thick white centerline, a strong retest of the CL could be in store.
My main target would then be the red centerline.
Since the markets are behaving completely irrationally, I’ll need more “breathing room” in the trade and will handle this trade using long-dated LEAP options.
...poor little guy §8-)

S&P 500 – Projection to the SouthLooking at the market's behavior using the orange median line/fork, one can clearly see how the market reacts when it touches one of the lines.
Median lines/forks are not an oracle. They simply project the highest probable path of the price based on a mathematical calculation inherent to the tool.
If you follow the rule set, money management, and risk management, you have a wonderful framework that offers a significant advantage in trading the markets.
Let’s take a look at the current situation:
The orange fork:
– Price closes outside the fork (1)
– Multiple retests of the L-MLH (textbook behavior) (2)
– Break of the 1/4 line, heading toward the 1st warning line (3)
Next movement pattern according to the median line framework:
– Drop to the white centerline (4)
– Retest of the centerline (5)
– 1/4 line (6)
– Lower median line parallel (7) with a possible retest
– Orange centerline of the pendulum fork (8)
Wishing everyone a wonderful start to the week.

Nasdaq - Potential Huge Bounce AheadPrice nearly reached the L-MLH of the Red Fork.
This is a huge price stretch and chances are super high that we will see a big bounce to the upside.
As for PTG's I focus on the Red, and the Orange Centerline.

Incoming BNB chain forks with 0,75s block time!BNB chain upcoming forks significantly reducing block times, increase TPS and decrease fees!
The Pascal hard fork in March 2025 is a big milestone in BNB Chain’s evolution setting the stage for the two upcoming BNB Chain forks:
1. Lorentz (April 2025): Reduces block intervals to 1.5 seconds
2. Maxwell (June 2025): Further reduces block intervals to 0.75 seconds
Very bullish for all BNB chain projects and it´s main token BNB. Finally Ethereum compatible chain's direct hit to Solana's heart and it's performance. The Maxwell fork in June will be game changer for crypto industry.
My short-term prediction once Pascal fork is implemented to main net in the middle of March 2025.

Gold’s Next Move: Upward Momentum Building at Key SupportGold is reacting exceptionally well to the Fork.
It has not opened and closed below the L-MLH within a single bar, which eliminates any immediate downside expectations.
Instead, we observe a condensed, slanted trading range or coil, indicating that price is being gradually pressed to the upside.
In my previous post about Gold, I anticipated a rocket-like breakout. Since then, price has simply moved down to the L-MLH, finding support there. This price action, coupled with the ongoing upward pressure, confirms my analysis—albeit slightly delayed.
As NQ and S&P approach their respective targets, as outlined in my other analysis, I expect Gold to start moving upward, with targets at the CL and U-MLH.

NVDA - A 90% Short fall to the centerline ($100-$104) or lowerDouble top, failed breakout of the high—call it what you will.
Fact is, NVIDIA has taken a brutal hit and is now trading back inside the fork.
Hagopian—what on earth is a HAGOPIAN?
According to the Fork Framework rulebook, if the market fails to reach its next target (the next line, such as the centerline, lower median line parallel, etc.), it reverses and moves further back than where it started.
This is (not so exactly) what happened in December. Instead of reaching the centerline, the market turned, shot beyond the upper median line parallel (U-MLH), and was supposed to break above the November 21st high. It missed that target as well. And this, my friends, is....?
...again, a HAGOPIAN!
Now, it’s heading south again. But this time, we have an over 90% probability of reaching the centerline. Why? Because when the market breaks above the U-MLH and then falls back into the fork, it’s a very bearish signal.
Of course, nothing works 100%. The market could turn around today and push past the high. But statistically, we’re aiming for the centerline—and there’s an over 90% chance we’ll hit it.
When will it happen?
Sorry, my crystal ball is broken.
All I do is follow the Fork/Median Line rulebook and rely on my experience.
As for me, I’m opening a short position in NVIDIA today and may add to it on the way down to the centerline. And I play this game with Options, so no hard price level stop for me.

BCH - Still Strong ↗️Hello TradingView Family / Fellow Traders. This is Richard, also known as theSignalyst.
📈 BCH has exhibited an overall bullish trend , trading inside the rising channel in red.
At present, BCH is undergoing a correction phase and it is currently approaching the lower bound of the channel.
Moreover, it is retesting a demand zone in blue.
🏹 Thus, the highlighted red circle is a strong area to look for buy setups as it is the intersection of the blue demand and lower red trendline acting as a non-horizontal support.
📚 As per my trading style:
As #BCH approaches the lower red circle zone, I will be looking for bullish reversal setups (like a double bottom pattern, trendline break , and so on...)
📚 Always follow your trading plan regarding entry, risk management, and trade management.
Good luck!
All Strategies Are Good; If Managed Properly!
~Rich

Mr. S&P500, it's decision time again.So, here we are, below the red Center-Line.
What now?
If the Bears are successful, then we go south.
Target is the at least the white Warning-Line, or the red Lower-Medianline-Parallel. What ever is hit first.
On the other hand, P3 could be in and we get a bounce up for a re-test to P4.
This is a tricky situation.
Even more because the Nasdaq looks ready for a rebound.
What shall we do?
To me it's clear:
- if I short it, then my stop is above the CL. I don't know where yet, but it will not be super close. I rather play it with Options to give my idea more time, even if we get a bounce for a re-test of the L-MLH (gren) or the white WL.
- If I wait for more information, I accept the potential for not being on the Submarine if it tanks. What would I loose? Nothing - there's always another trade.
- And finally, on a re-test of the green L-MLH/WL, I can stalk a short from there.
Isn't that relaxing, to have so much opportunities? §8-)
Play it save Tr8dingN3rds.

TSLA - TESLAs rebound and potential turnTSLA fell out of the L-MLH and fell down very hard, but did not reached the WL. That's a HAGOPIAN and hence we see price climbing up to retest the L-MLH.
If we reach the L-MLH we could see the GAP filled.
From up there I'l stalk a short since it's likely that it will continue to the downside.
Trade with caution, markets are nuts §8-)

COIN - Further Lows On The PlateThe last chart i COIN I showed you (see linked) was a nice play. Will this one cooperate too?
Let's analyze the chart:
The white Fork's CL was reached.
It came down hard and fell beyond the L-MLH.
We see the orange Fork, a pullback Fork.
Price struggled to jump above it's CL a view days ago, and now opened and closed below it, AND below the white Forks L-MLH.
Because I want to give this trade a little room, I initiated an Options Strategy by combining Short & Long Spreads.
You can see in the Black Window (Graph), there is plenty of room to let it go against the initial idea.
The B/E point is at the $85 short Call.
When time passes and price would stay exactly where it is now, the position would create a little profit.
If price is going up and stays between the horizontal line (yellow Arrow in the Graph), we profit.
If price of COIN starts to fall, we make profits along the dotted white line.
So, what's the benefit of this trade?
Why not play it directional by just shorting COIN?
1. There's a time decay involved.
My short Call-Debit-Spread generates money, every day by decaying in value.
2. There's the directional aspect.
If price cooperates, then the position profits from the "right" movement AND 1.
Downside?
If price MOVES (it HAS to move) in the wrong direction above $85, then I loose with both positions.
Luckily I can manage this options strategy when ever I want. I can open and/or close Spreads, I can add or remove Legs in favor of my position. I can add Stocks Long OR Short.
Too complicated?
I learned, that success does not just come from a 1-Trick trading Setup/System. If you want to survive in to-days markets, you have to learn, adapt and never stop this process.
I personally like to have as many possibilities to skin my Cats as possible.
I'm a Nerd, a Tr8dingN3rd and I live for what I do §8-)

Bitcoin Cash Fibonacci Retracement TargetsAfter a 3X rally, these are my price targets:
BCH/USDT short
Entry Range: $280 - 300
Price Target 1: $239
Price Target 2: $213
Price Target 3: $187
Stop Loss: $325

BSV Why Bitcoin SV is a useless forkForked cryptocurrencies, which emerge as a result of splitting from the original blockchain, often face an uphill battle to establish themselves as valuable and distinct entities. One of the primary concerns is that forks are perceived as redundant copies of the original blockchain, lacking the same level of innovation, utility, and market demand. This perception leads some to believe that forks will struggle to gain widespread adoption and maintain significant value.
Additionally, forks often encounter difficulties in building and sustaining communities and resources. Divided communities and limited developer support can hinder the progress of forked projects, preventing them from achieving the same level of growth and ecosystem development as the original chain. These challenges can also impact liquidity and network effects, making it harder for forked cryptocurrencies to compete effectively.
Furthermore, the original blockchain, from which the forked cryptocurrency originates, usually retains its dominance in terms of market capitalization, brand recognition, and developer activity. This creates a significant hurdle for forks to overcome, as they face strong competition from the established and widely adopted original chain. The success of the original chain can overshadow the forked projects, diminishing their perceived value and hindering their ability to gain traction.
In my opinion BSV Satoshi's vision could easily reach $12.10.
Looking forward to read your opinion about it!

ETC Ethereum Classic | Why Forks are Useless CreationsForked cryptocurrencies, which emerge as a result of splitting from the original blockchain, often face an uphill battle to establish themselves as valuable and distinct entities. One of the primary concerns is that forks are perceived as redundant copies of the original blockchain, lacking the same level of innovation, utility, and market demand. This perception leads some to believe that forks will struggle to gain widespread adoption and maintain significant value.
Additionally, forks often encounter difficulties in building and sustaining communities and resources. Divided communities and limited developer support can hinder the progress of forked projects, preventing them from achieving the same level of growth and ecosystem development as the original chain. These challenges can also impact liquidity and network effects, making it harder for forked cryptocurrencies to compete effectively.
Furthermore, the original blockchain, from which the forked cryptocurrency originates, usually retains its dominance in terms of market capitalization, brand recognition, and developer activity. This creates a significant hurdle for forks to overcome, as they face strong competition from the established and widely adopted original chain. The success of the original chain can overshadow the forked projects, diminishing their perceived value and hindering their ability to gain traction.
In my opinion ETC Ethereun Classic could easily reach $8.30.
Looking forward to read your opinion about it!

Say hello to short positionHello Guys
This is first my idea here and I hope its helpful
here, We have a fork that tell me close your long position and open short position

Mummy Finance (MMY) Long mega potentialHello all perpetual lovers, this one is for you?!
And it’s a risky one - Mummy Finance (MMY)….
but Mummy Finance checks all the boxes for potential exponential growth (as I see it).
This perpetual exchange lives on Fantom network. I think many traders on Fantom network (including me) are waiting for a great perpetual Exchange - and here it is!? Mummy Finance is a fork of extremely popular GMX exchange (Arbitrum network). The look and feel is great and everything about Mummy gives me smell of success - no financial advice.
When it comes to TA, we have almost no historical data. We can see a big explosion in price the last days. But I really don’t think the potential future exponential growing is priced in….All things considered increased traffic on homepage/twitter, trending volume, NFTs, staking possibilities isn't priced in.
The most impressive key indicator is the revenue. $346,399 Dec 21st. Over 100K last 4 days!!!
If a it comes a big pull back, I really think it could be a good time to take a small bet. But please do your own research!

No doom, gloom or pivot. Just one aliens TA.An alien trader landed on earth and was given a chart of the combined** US indices (futures). Luckily, and not coincidentally, he knew TA.
He had never heard of people like J.Powell and J.Cramer, or places like China, Ukraine and Russia.
this is what he saw:
Bullish:
- Broke out 'above' the main diagonal trend (bullish)
- Made a Higher High (bullish)
- Note that, on a VERY high TF, the Bull market rides on and up (see "Higher Range Frame" box)
Neutral
- Has arrived at the key POC (neutral) and is sandwiched between zones of lower past volume (LVN's)
- The 100MA/400MA was moving towards a "neutral cross" (the midpoint between the MA's is flat and not changing)
Bearish
In higher time/range frames the index has not made a new swing high. (see "Higher Range Frame" box)
NOTES
**There are multiple ways to merge ES, NQ and YM, as well as alternative indices like $NYA and Wilshire 5000. The *best* option depends on what it is used for (ex. a sphere is a good model of the earth for the astronomer, but not for the mountain climber). A simple average (ES + NQ + YM)/3 is ruled out because one point has a different value for each index. To address this, each index is weighted so that a 1 point change will imply the same change in $ terms (For weights see www.barchart.com
Alternative criterion for weighting include capitalization, number of stocks and beta weighting.
[i Epilogue - After watching a TA channel on You Tube for 5 min. he departed abruptly pausing only to grab a clean towel. He is believed to be following in the dolphins footsteps.

🔥🔥🔥 #ETHUSDT Buy Start of global growth! Toothemoon!tart of global growth! Toothemoon!
Vitalik Buterin stated that - "The merger will reduce electricity consumption worldwide by 0.2%"
In addition, technically, on the global daily Divergence chart, on the basis of which my assumption is built that we are at the beginning of a global growth towards the price of 6000 per ether.
This screenshot does not show the whole idea, but only part of it.
⚠ * This idea is not a trade recommendation.

September 13 BTCUSD BingX Chart Analysis and Today's HeadlineBingX’s Bitcoin Chart
According to Glassnode, the total value in the ETH 2.0 deposit contract reached an ATH of 13,638,560 ETH. Bitcoin is up 2.55% over the last 24 hours and rose to an intraday high of $22,494.42. The cryptocurrency market and the traditional equity market have rallied since 09 Sept, suggesting that the investors believe the inflation has peaked, and the market has priced in the possible 75 basis point hike in the next FOMC meeting. The U.S. August consumer price index (CPI) will be released today at 12:30 UTC, and the market expects August CPI (YoY) declines to 8.1% from the previous 8.5%. If this happens, the BTC/USDT pair could attempt a rally to the overhead resistance at $25,211. Conversely, if the figure is worse than the expectation, the recent rally could be ended.
Today’s Cryptocurrency Headline
Ethereum Completes Last Shadow Fork
Ethereum research and engineering firm Nethermind has confirmed that the transition in Mainnet-Shadowfork-13 — the last shadow fork — was successful, indicating that the network is ready to migrate to a proof-of-stake (PoS) consensus mechanism. Testnets allow Ethereum developers to practice functions such as running nodes, deploying contracts, and testing infrastructure. Thus, shadow forks allow developers to evaluate network upgrades before they happen. As part of the upgrade, the community needs to update the Ethereum client and run a combination of execution and consensus layers.
Disclaimer: BingX does not endorse and is not responsible for or liable for any content, accuracy, quality, advertising, products, or other materials on this page. Readers should do their own research before taking any actions related to the company. BingX is not responsible, directly or indirectly, for any damage or loss caused or alleged to be caused by or in connection with the use of or reliance on any content, goods, or services mentioned in the article.

Real gold is not afraid of the melting pot! Gold Weekly :)Hello fellow gold traders!
ive been busy (not to say lazy) lately and did not publish, im gonna go abit hyperactive and make up for my absence ;)
lets start where it should start and take a look at weekly, as you can see price hit the ATH of 2070 which was for a long time out of reach. and as expected, the volume on that candle equals the sum of all the volumes that came before, signalling a more than probable fall. things cant always go up , right ? ;)
Now we take a look at that falling side in more details to have a chance of seeing where it might go....
first falling algo, as you can see, correted to its 0.618 fib at around 1999 and then went staright to the first algo target at 1849 and then to the second at 1786. too perfect right ?
next algo could not correct for more than fib level 0.45 as the hope for any new ath disappeared and was replaced by the fear. and then went down to first target 1739 but abit short of second target at 1666( fib level -0.618) the move stopped suddenly at only 55%, which is a well known historic support since APril 2020.we will see this level in more details later on.(yeah , lets make this idea 100 page long! XD )
third move was more classic, going to golden zone 0.618-0.65 fib level at 1800-1807 and then head diving, reviving the hope for bears now having targets at 1636 and 1568 (fib levels -0.236 and -0.618)
but we have the historic level of support at 1680 blocking the bears target. this level has been tested 4 times, which lets us wonder what will happen in 5th try....
adding some fork might be of some help in this golden mess ;)
well, downward as we imagined, and under the median, which suggests going for the next parallel probably.
and that second target at -0.618 fib seems to have structural influence too as you can see:
this area has been an important zone in past price reactions too if you move back in chart
all that together, the probability of moving for the unbelievable , out of reach flashy target at 1555 ...ish increases alot!
which could complete a nice ABC (Bear with me XD im new to EW! :P )
adding the weekly rising fib from 1046 to 2070 adds the confluence of fib level 0.45 , which is a common failure to reach the desired 0.5 level, in this zone too.
we have enough confluence at that zone to be able to consider it as a probable target while still keeping an eye on that 1680 lulti wick zone.
And keeping in mind that its gold, as capricious as any other golden creature we know ;)
Wishing you all the best of the best in everything.....and in trading!
Onviously not a financial advice, do i look like your banker ? XD
Have a great sunday....and always pass a wink to your left ;)

BTCUSD - Bitcoin test the CL and now down to the CLAfter the break of the white dashed CL, price came back to test it. Textbook like according to the rule-set.
Next target is
a) the L-MLH and then
b) the red CL
Would not be surprised if we see a Re-Test of the white CL.
Next...
