GOLD A Fall Expected! SELL!
My dear friends,
Please, find my technical outlook for GOLD below:
The instrument tests an important psychological level 3392.95
Bias - Bearish
Technical Indicators: Supper Trend gives a precise Bearish signal, while Pivot Point HL predicts price changes and potential reversals in the market.
Target - 3378.37
Recommended Stop Loss - 3403.2
About Used Indicators:
Super-trend indicator is more useful in trending markets where there are clear uptrends and downtrends in price.
Disclosure: I am part of Trade Nation's Influencer program and receive a monthly fee for using their TradingView charts in my analysis.
———————————
WISH YOU ALL LUCK
Formasyon

Which of the Multiple Patterns Will Play Out?Hey friends, I’m back with another great coin analysis. Today we’re looking at #FORMUSDT.P. On this coin, we have multiple formations, including the BULLISH WOLF WAVE FORMATION, a potential breakdown of a falling wedge, and perhaps a flag formation as well.
If we take the Wolf Wave formation as our main guide, our first target would be the $2.40 level, which corresponds to the 4th movement in the pattern. The second target, depending on the time frame, would be around the blue line, which is approximately $2.63.
If the flag formation plays out, we could potentially see a price range between $2.80 and $3.10.
Let’s watch and see how it goes. My long position is active with some leverage.
Let’s fish and see what happens! 🎯
Manage your risk, stay in the game! 🎯🔥
#AlyAnaliz #TradeSmart #CryptoVision #FORMUSDT #Binanciega

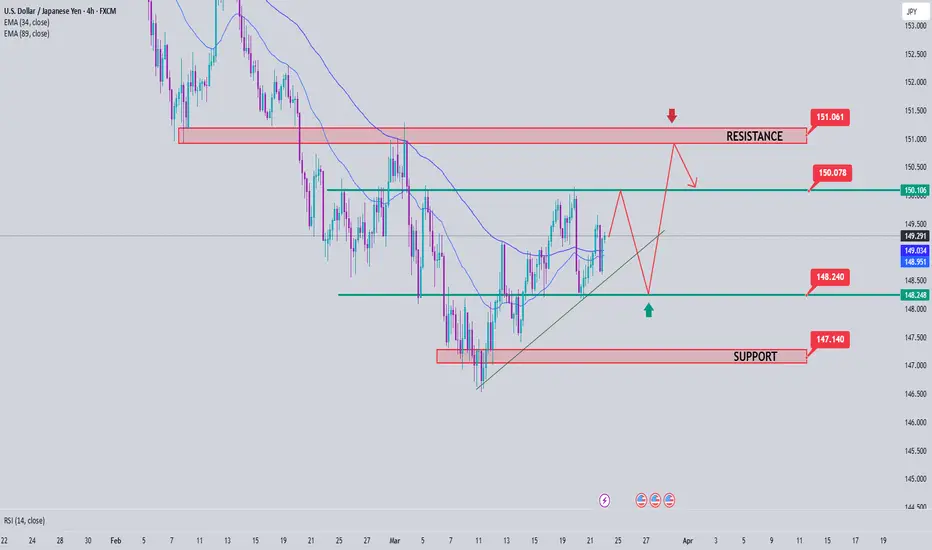
USDJPY Analysis week 14Fundamental Analysis
The US dollar continues to attract cash flows as the US Federal Reserve (Fed) is unlikely to cut interest rates in the near future. Fed Chairman Jerome Powell stressed that the Fed is in no hurry to adjust policy amid growing economic uncertainty under President Donald Trump, while warning of the negative impact of tariff policies on growth and inflation.
In the Asia-Pacific region, weak Japanese CPI data in February put pressure on the Yen (JPY), although the growth rate still reached 3%. However, expectations of tightening policy by the Bank of Japan (BoJ) remained after the Rengo union announced a 5.4% wage increase this year.
Technical Analysis
The short-term range is limited to 150,100-148,200. This border area is also very easy to break because there is a lot of buying and selling in this area and just enough factors will break the border area. Krado is aiming for the resistance area of 150,900 which will be the weekly resistance area. Important support when the price breaks out of the trendline is extended to 147,300 for buying force to jump into the market.
SHIBUSDT Technical AnalysisWhen the SHIBUSDT 4-hour chart is examined; It is observed that the price movements continue in a downward trend. As long as the crypto's 0.00001466 level cannot be passed upwards, it is evaluated that in price movements below the 0.00001254 level, it can break down the 0.00001081 level and retreat to the 0.00000906 level.

BTCUSDT Technical AnalysisWhen the BTCUSDT hourly chart is examined; It is observed that the price movements continue in a downward trend. As long as the crypto's level of 58449 cannot be passed upwards, it is evaluated that in price movements below the level of 57210, it can break the level of 55685 and retreat to the level of 53952.

Crude Oil Technical AnalysisWhen the USDWTI 4-hour chart is examined; It is observed that price movements continue in a downward trend. As long as the Crude Oil price cannot exceed the level of 75.28, it is evaluated that in price movements below the level of 74.38, it can break the level of 72.90 and retreat to the level of 71.47.

Gold Technical AnalysisWhen the XAUUSD hourly chart is examined; It is observed that the price movements continue in an upward trend downward. It is evaluated that the Gold Ounce price may retreat to the level of 2414 in price movements below the level of 2472, but as long as the level of 2472 is not broken down, it is evaluated that it may break the level of 2532 and target the level of 2588 in price movements above the level of 2509.

DE30 DAX Technical AnalysisWhen the DAX 4-hour chart is examined; It is observed that the price movements continue in an upward trend. As long as the index price does not break down the 18292 support level, it is evaluated that the price movements above the 18701 level can exceed the 18971 level and target the 20021 level.

US100 NASDAQ Technical AnalysisWhen the US100 4-hour chart is examined; It is observed that the price movements continue in an upward trend. It is evaluated that the index price may retreat to the level of 18694 in price movements below the level of 19133, but it is evaluated that it may exceed the level of 19923 and target the level of 20936 in price movements above the level of 19335.

DOGEUSDT Technical Chart ReviewWhen the daily chart of DOGEUSDT is examined; It is observed that the price movements continue in a downward trend. As long as the crypto price does not break below the 0.08059 level, it is evaluated that in price movements above the 0.09406 level, it can cross the 0.11566 level and target the 0.14259 level.

AMZN Technical Chart ReviewWhen the AMZN daily chart is examined; It is observed that the price movements continue with the formation of the OBO Formation in the upward trend. As long as the AMZN price cannot pass the 191 level, it is evaluated that in price movements below the 178 level, it can break the 167 level and retreat to the 132 level.

WHEAT Graphic ReviewWhen the WHEAT 4-hour chart is examined; It is observed that the price movements continue within the downward sloping wedge. As long as the WHEAT price level of 531 is not broken down, it is evaluated that in price movements above the level of 543, it can cross the level of 565 and target the level of 589.

COTTON Graphic ReviewWhen the COTTON daily chart is examined; It is observed that the price movements continue within the possible Çanak formation formation. As long as the COTTON price level is not broken down from the 6611 level, it is evaluated that the price movements above the 7553 level may exceed the 8187 level and target the 10143 level.


USDCHF trendline fully bullish read the caption The USDCHF earlier today reached up to the highest level of the year at 0.90949. However the last three or four hours have seen a rotation to the downside after the weaker than expected ISM nonmanufacturing data. Fed's Powell also, the market at that sending yields lower and the US dollar lower in the process.
That good news sent the price of the USDCHF down below is 100 hour moving average at 0.9043 and down to the 200 hour moving average 0.90296 Hundreds road lower, the prior highs from last week at 0.9061 and 0.90636

💥 USD JPY bearish moving) 4H )Hello trader’s what do you think about usdjpy)?
Usdjpy bearish moving retest rsl levels same Bak sell zone 138.570
The US dollar declined against its major trading partners early Friday, except for a gain versus the euro, ahead of the release of the New York Federal Reserve's Empire State survey for December, the first manufacturing reading for the month, at 8:30 am ET.
November industrial production data are set to be released at 9:15 am ET, followed by S&P Global's flash estimates of manufacturing and services conditions for December at 9:45 am ET.
With the Fed's pre-meeting "quiet period" now lifted, appearances by officials should pick up in the coming week before the holidays begin.
A quick summary of foreign exchange activity heading into Friday:
USDEUR
fell to 1.0966 from 1.0992 at the Thursday US close but was above a 1.0928 level at the same time Thursday morning. The European Central Bank held its target rate steady Thursday, as expected, and said that rates will need to remain elevated "as long as is necessary," according to ECB President Christine Lagarde. There was no discussion of rate cuts at the meeting, Lagarde said. The next ECB meeting is scheduled for Jan. 25. The Eurozone manufacturing and services sectors continued to contract in December, a preliminary purchasing managers' index released earlier Friday showed.
GBPUSD
rose to 1.2774 from 1.2766 at the Thursday US close and 1.2664 at the same time Thursday morning. UK manufacturing PMI showed continued contraction in December, but the services reading moved further above the breakeven point to signal faster expansion, preliminary data released earlier Friday showed. The next Bank of England meeting is scheduled for Feb. 1 after the BoE maintained its target rate Thursday and said rates will need to remain elevated for some time.
USDJPY
fell to 141.6480 from 141.8862 at the Thursday US close but was above a level of 141.5921 at the same time Thursday morning. Preliminary Japanese manufacturing PMI for December showed further contraction while the services sector expanded at a faster rate than in the previous month, data released overnight showed. The next Bank of Japan policy meeting is scheduled for Dec. 18-19, with the statement released in US time Monday evening.
USDCAD
fell to 1.3381 from 1.3406 at the Thursday US close and 1.3448 at the same time Thursday morning. Canada housing starts data for November are scheduled for release at 8:15 am ET, followed by wholesale sales data for October at 8:30 am ET. The next Bank of Canada meeting is set for Jan. 24. BoC Governor Tiff Macklem is scheduled to speak at 12:40 pm ET.

Technical analysis for AVAXThe instrument has captured inside admirable and wide consolidation. Currently the volumes are low. The breakout depends on the market background and the BTC behavior. Watch the activity on the levels only after having previous 2 touches for both cases, namely long and short.

LTC/USDT Technical Analisys 16.04.22Head and shoulders formation on 4 hours period in LTC/USDT Chart


