BTC at a Critical Crossroad — Pump or Dump ?
📝 Caption: Bitcoin is facing a decisive moment!
📌 Price is stuck in a key holding zone.
📈 A break above could send us flying toward the $104K resistance.
📉 But failure to hold may trigger a sharp drop into the weekly FVG below $90K.
🔻 Optimal short entry if we break below the structure.
🚀 Or is this just a healthy retracement before continuation?
💬 What’s your bias — bull or bear?
📊 Let me know in the comments!
#BTC #Bitcoin #CryptoAnalysis #TradeWithMky #Altcoins #TechnicalAnalysis
Fractal


Home of ABBA, IKEA, and Volvo (USD/SEK)USD/SEK has broken below major multi-year support.
While below there we are looking for shorts (i.e. bullish the Swedish krona)
The daily chart has corrected higher but the trend is down.
Another breakdown through the lows could setup another leg lower
Thoughts?

USDCAD swing longsFrom fundamental analysis on CAD futures derived from "barchart.com". Currently as of writing (Monday 30th April 2025), we can see the CAD futures price increasing from this day but the Open Interest has been decreasing steadily so we can anticipate a reversal soon for the futures price (to flip bearish), which means bullish PA for USDCAD (this could also give you a slight insight/confirmation to DXY’s potential price).
Technicals outlined in chart using price action.

Bitcoin: Structural Patterns To WatchBy anchoring the triangle’s resistance line through 4 distinct highs and the support line through 2 unviolated major lows, we establish a structurally reliable formation. This repeated validation lends statistical weight to both boundaries.
In this context, the resistance zone gains significance as a high-probability density region — a zone where price has historically reversed with consistency. The longer price remains confined within this converging structure, the more meaningful its breakout or rejection becomes, due to the underlying compression of nested cycles and volatility.
This reinforces the view that the triangle, what is perceived as geometric, is in fact probabilistic corridor governing the limits of price behavior until structural tension resolves.
In classical fractal systems, self-similarity means similar patterns recur across scales. Scaling laws define how measurements (e.g., time between peaks, range of swings) relate across levels.
However, within a triangle (even ascending one in this case), amplitude decays as each leg becomes shorter — violating the assumption of consistent proportionality across scales. Time intervals tighten, disrupting the expected temporal rhythm. Energy dissipates into a narrower price structure — akin to an entropic bottleneck in a dynamic system.
This reflects Mandelbrot’s insight:
“Markets alternate between phases of tight control and sudden chaos.”
These distortions suggest that fractal dimension becomes non-stationary, adapting locally as price compresses. If we take a look at fractal shapes we can see how patterns of same classification whether continuation or reversal can be distorted over big intervals of cycles.
The legitimate concern at this point is to work out what will happen structure when price supposedly breaks out from any side. Since triangular formation is still unviolated, I'll use those angles to integrate fibonacci channels that would mark ends of those breakouts.
Current price is circled violet and yellow due to uncertainty. If it's just a pullback (reaction to drop from ATH) then we assume bearish continuation.However, there remains a valid chance of the structure evolving into a bullish impulse. Due to this ambiguity, I’ll be watching the next 2–3 daily candles to determine whether the fractal hierarchy confirms a directional resolution.

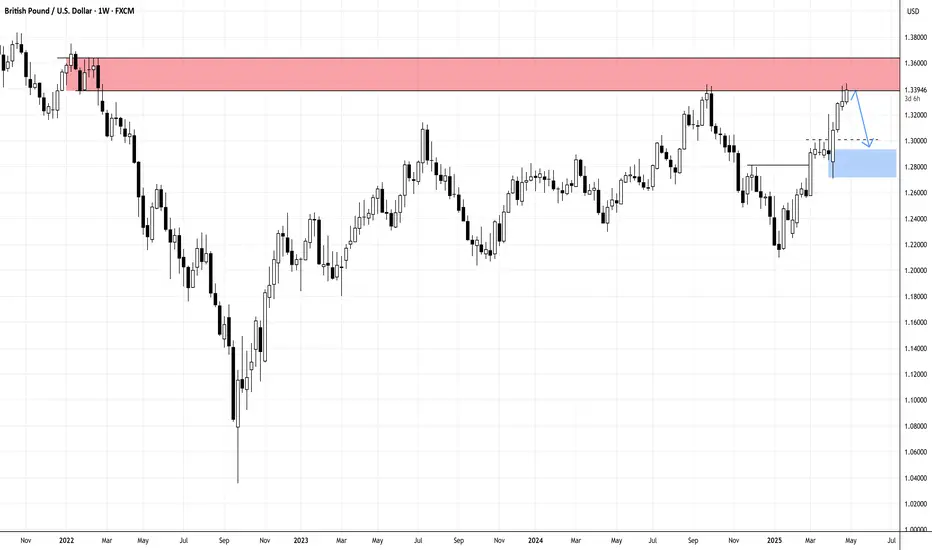
CABLE May Likely Struggle to Rally Above ResistanceGBPUSD previously been rejected and likely to be rejected again to drag pair to its mean before another impulsive movt above the resistance...
N.B!
- GBPUSD price might not follow the drawn lines . Actual price movements may likely differ from the forecast.
- Let emotions and sentiments work for you
- ALWAYS Use Proper Risk Management In Your Trades
#gbpusd
Buying XRP Ripple long XRPUSDt Bias Trade! The Breakdown inside!Again we have a 🟢SeekingPips🟢 plan where ⏳️ TIME was the MAIN factor in the SUCCESSFUL OUTCOME of our TRADE PLAN.🚀
If you've been following 🟢SeekingPips🟢 for sometime already you will know that we ALWAYS FAVOUR 🕝TIME🕖 OVER PRICE.
🔥I would even go as far and say that PRICE comes a DISTANT 3rd place when compared to TIME & VOLUME.🤔
BUT WHY❓️
That is a Vvveeerrryyyy LONG STORY that will require it's very own very long CHAPTER when 🟢SeekingPips🟢 Finally gets around to the eagerly awaited super blog so stay tuned....
Having seen that the GREY ZONE identified as 🟢 SeekingPips 🟢 Bull & Bear Bias level worked very well, you can also see that the first level of resistance identified came in at the orange level at 2.3615 whilst the printed high up until now came in at 2.3630 (Accuracy👌)
48hrs was also our minimum time window for the grey zone to present some kind of trade opportunity which it did perfectly. ( It's MATH not MAGIC honestly😉)
Note the 🔵 BLUE ARROW LOW 🔵 significant swing point created before 🌍SeekingPips trade analysis signal and just below our GREY BIAS ZONE remained unvisited👌.
Wether or not you entered a bullish trade at MARKET PRICE at time of post ( I always suggest you use your own entry signal ) OR waited for a LIQUIDITY SWEEP at those local lows for the BUYERS to easily pair with at the 🟢GREEN ARROW🟢 you would have enjoyed anything from a 3.2 - 5.2 REWARD TO RISK TRADE by the time our FIRST HIGHLIGHTED zone of RESISTANCE was hit which came into play at the
2.3615 level 🔴RED ARROW🔴.
The 🟣PURPLE/MAGENTA🟣 arrow added CONFLUENCE to the BULLISH BIAS TOO .
🚥Stay tunned for MORE TRADE ANALYSIS as the week progresses.🚥

DOT/USDT 1H Chart UpdateDOTUSDT broke its Long-Term Resistance last week!
After consolidating in a Redistribution phase (similar to mid-April), Polkadot is now testing the $4.00 support zone.
▸ Bullish Target: If $4.00 holds, we could see a climb to $4.50 or higher!
▸ Bearish Risk: A breakdown below $4.00 might push the price to $3.90 or lower.
Eyes on $4.00 — will the bulls defend this level? Let’s talk!

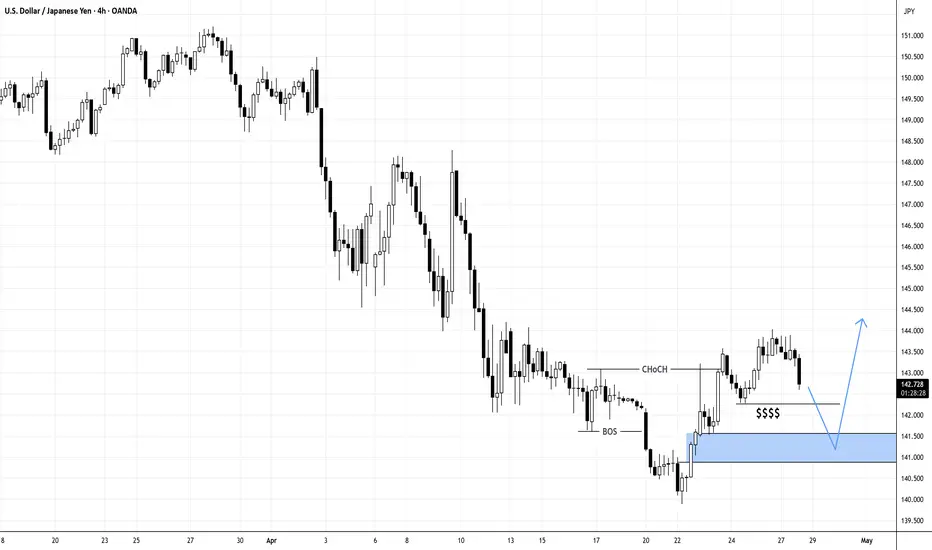
Will USDJPY Shows Reaction Below Liquidity?$$$$
N.B!
- USDJPY price might not follow the drawn lines . Actual price movements may likely differ from the forecast.
- Let emotions and sentiments work for you
- ALWAYS Use Proper Risk Management In Your Trades
#usdjpy
#usd
#jpy
XAU/USD 28 April 2025 Intraday AnalysisH4 Analysis:
-> Swing: Bullish.
-> Internal: Bullish.
Analysis and bias remains the same as analysis dated 23 April 2025
Price has now printed a bearish CHoCH according to my analysis yesterday.
Price is now trading within an established internal range.
Intraday Expectation:
Price to trade down to either discount of internal 50% EQ, or H4 demand zone before targeting weak internal high priced at 3,500.200.
Note:
With the Federal Reserve's dovish stance and persisting geopolitical uncertainties, heightened volatility in Gold is expected to continue. Traders should proceed with caution and adjust risk management strategies in this high-volatility environment.
Price could also be driven by President Trump's policies, geopolitical moves and economic decisions which are sparking uncertainty.
H4 Chart:
M15 Analysis:
-> Swing: Bullish.
-> Internal: Bearish.
Analysis and Bias remains the same as analysis dated 24 April 2025.
Price printed as per my note yesterday whereby I mentioned that we should be surprised if price printed a bearish iBOS as all HTF's require a pullback.
Price subsequently printed a bearish iBOS which confirms internal structure.
Intraday Expectation:
Price has traded up to just short of premium of internal 50% EQ where we are seeing a reaction. Price could potentially trade further into premium of 50%, or H4/M15 nested supply zone before targeting weak internal low priced at 3,260.190.
Note:
With the Federal Reserve maintaining a dovish stance and ongoing geopolitical tensions, volatility in Gold prices is expected to remain elevated. Traders should exercise caution, adjust risk management strategies, and stay prepared for potential price whipsaws in this high-volatility environment.
Trump's tariff announcement will most likely cause considerably increased volatility and whipsaws.
M15 Chart:

Bitcoin's next targets are 140K and 250K !This analysis is an update of the analysis you see in the "Related publications" section
Are Bitcoin's mid-term targets still valid?
First of all, please review the previous analysis
In our last analysis, we mentioned that if there was any drop, it would likely be towards the resistance line that had been broken, and we identified the pullback zone around the 77K channel.
Now, based on the available data, the pullback has been successful, and Bitcoin's target is to move toward the 130-140K range. A 3D pattern has formed, and the third drive could complete within this range, after which Bitcoin may enter a corrective phase.
But what about the second target | 250K?
Why are we considering this target? There are several reasons:
First, the bullish wave in gold was preventing capital from flowing into cryptocurrencies, especially Bitcoin. Now, gold is reaching the end of its bullish wave, which could lead to significant liquidity flowing into crypto and Bitcoin.
Second, Bitcoin's channel structure remains very bullish. If substantial liquidity enters the market, not only could the 250K target be achieved, but Bitcoin might even reach higher levels.

GOLD REMAINS BULLISH ON LOWER TIMEFRAME - H4Despite posting the weekly indecision on gold, the metal remains bullish on the lower timeframe like H4 which is yet to break it's bullish structure. And with the rejection followed by the bullish candle before the close last trading week, XAUUSD likely will continue to rally up when market opens for trade next week.
N.B!
- XAUUSD price might not follow the drawn lines . Actual price movements may likely differ from the forecast.
- Let emotions and sentiments work for you
- ALWAYS Use Proper Risk Management In Your Trades
#gold
#xauusd

SPX / SPY / ESM5 - Resistance levels aheadSPX is looking healthier above its shorter term MAs, particular with two closes above the 21 and downward trend line. There are still plenty of resistance areas ahead, including key fib levels, a gap fill, 100 and 200 down-sloping EMAs, and a swing symmetry level.

DOGE Daily MA Hints and CluesDOGEUSD Daily Outlook: Signs of Accumulation?
Thanks for taking the time to check out my analysis on DOGEUSD. Let’s dive in.
Most traders are familiar with moving averages and crossover signals — and while these are often viewed as lagging indicators, I’ve found that using multiple moving averages together can offer much clearer insights, especially when paired with other supporting tools.
On this chart, I’m using a combination of simple moving averages (SMA) and exponential moving averages (EMA). I’ll break down the specific MAs I'm using in a follow-up post, but for now, I want to highlight what the moving average structure is showing us right now — and how it compares to similar price action in the past.
Take a look at the yellow arrows on the chart:
The arrow on the right marks the current price position relative to the moving averages.
The arrow on the left points to a similar setup from the past.
As the old saying goes: “History doesn’t repeat itself, but it often rhymes.”
The last time DOGEUSD price action sat in this zone, we saw about 45 to 50 days of consolidation and chop before the market broke into a strong parabolic move higher. Projecting that same timeframe forward puts us somewhere around mid-June.
While nothing is guaranteed in the markets, this chart suggests that accumulation around this zone could present a favorable risk-reward setup for a potential run in the near to mid-term.
My Approach:
I began accumulating a position today and plan to add on pullbacks if the opportunity presents itself.
As always, this is not financial advice — just sharing my personal outlook and strategy. Wishing you all success out there — stay patient, stay sharp.

With Last Trading Week Indecision Next Week Will be BIG for GoldGold shows indecision after the close of trading hours for last week, and with the long sellers' wick exhibited on the candlestick, XAUUSD will require a huge geopolitical uncertainty news for price to continue to rise. A further rejection will drag gold's price to its mean.
N.B!
- XAUUSD price might not follow the drawn lines . Actual price movements may likely differ from the forecast.
- Let emotions and sentiments work for you
- ALWAYS Use Proper Risk Management In Your Trades
#gold
#xauusd

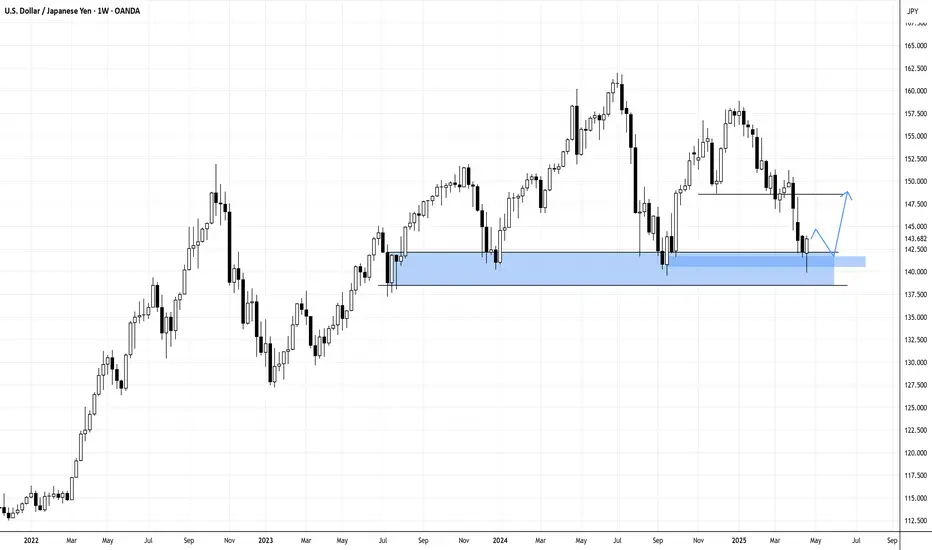
USDJPY Weekly Rejection at Support-Revisit Bearish Order Block?USDJPY pair last trading week got rejected at the same level that the pair has previously acted as a support level. Will this rejection cause USDJPY to rally towards a bearish order block above 147.50?
Risk Zones: 146.50
N.B!
- USDJPY price might not follow the drawn lines . Actual price movements may likely differ from the forecast.
- Let emotions and sentiments work for you
- ALWAYS Use Proper Risk Management In Your Trades
#usdjpy
#usd
#jpy
XAUUSD (Gold) - ICT AnalysisI'm currently looking for higher levels on Gold,
after we reversed from a Daily IRL zone and printed a clear 1H structure shift.
Price just rejected from a 4H IRL, and my first target is the 4H ERL,
which is already marked on the chart.
Watching price action closely for continuation confirmation.

GBPUSD AnalysisGBP could potentially start its next bearish leg from the current level.
Price has reacted off a lower timeframe IFVG, which is currently acting as support.
If we get a clean close below this IFVG, along with proper short confirmation,
I'll be looking for bearish setups to target lower levels

$BTC Tracks $GOLD Very Closely With 12-Week LeadCould it really be this simple?
Maybe we can just throw Global M2 out the window and track TVC:GOLD with a 12-Week Lead.
Someone pointed this out to me yesterday when I posted Gold's near 1/1 tracking with Global M2.
*Note the deviation in CRYPTOCAP:BTC PA from the ETF hype.

longLong level. Looking pretty good by feel. I just feel that long bitch. I visualise and it happens.
Feels good winning.

$GOLD Continues to Move in Lockstep With Global M2It's amazing how accurate TVC:GOLD follows Global M2 with NO LEAD.
Near instant liquidity injection into the asset as the money supply rises 🪙
I do not see the price of Gold falling until Global M2 does.

GBPUSD Analysis with ICT ConceptsMy current outlook on the British Pound is bearish, with an expectation of lower levels in the near term.
A key level I am anticipating price to reach is the Weekly Open, which has not yet been touched.
Yesterday's price action seems to be confirming this potential move towards the Weekly Open.
Therefore, I am actively looking for confirmed short position opportunities to align with this view.
Trade safe!

SUI Long-Term H&S: Epic Crash Ahead?
SUI daily chart paints a clean Head and Shoulders pattern, pointing to a massive drop to around $0.83 by late Summer. As a fractal, this model also aligns with the trough-to-trough cycle from October 2023 to August 2024.
What do we think?
