xauusd/M15
"In the specified lower range, I expect a buy upon observing a trigger up to the identified supply range. Additionally, I anticipate a breakout above the ceiling from that point. The best range for taking a buy is the identified lower range, where you can proceed with a trigger aligned with your style."
Fractal

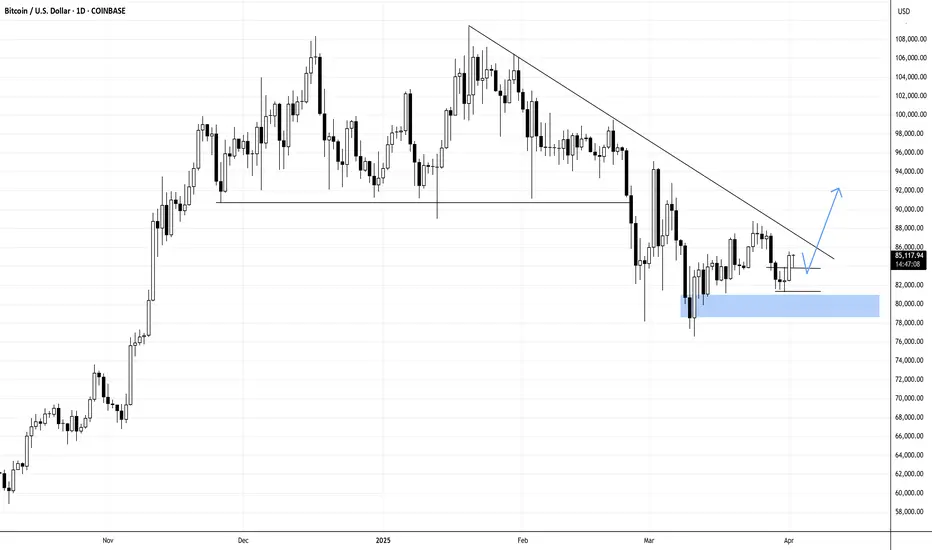
BITCOIN!BTCUSD!
N.B!
- BTCUSD price might not follow the drawn lines . Actual price movements may likely differ from the forecast.
- Let emotions and sentiments work for you
- ALWAYS Use Proper Risk Management In Your Trades
#ethusd
#crypto
#btcusd
IAG Airlines Group what next? $261 Reached & Breached! $172?🤔 IAG Airlines Group what next?
ℹ️ $261 Reached & Breached!
Will the $261 be regained and start to offer some support or is $172 NEXT?❓️❔️❓️
🌍 To be completely transparent I have no horse in this race at the moment BUT I really would like a serious flush to try and accumulate a long-term POSITION.
🟢SeekingPips🟢 is not interested at current price at all unless we start to see some SERIOUS VOLUME START TO COME IN TO PLAY

BTC @ ~$100k == GOLD @ ~$1kGold is always a good fractal to use for projecting Bitcoin.
Gold price action around the MIL:1K area is very similar to what we are seeing on BTC currently.
Flip $90k to support and it's go time for BTC.
1st target is ~$200k.
-@CryptoCurb

Research: Interconnected Scalable ComplexitiesIntegrating another fibonacci channel into a formerly discovered interconnected structure:
Direction defined by HH's: Mar '24 & Dec '24; Mapping to LL Nov '22 Price breaking over this channel is a signal of continuation of bullrun in a bigger scale (like 2016 BR).
Interconnected Fractals in respect to Phi:
My work revolves around understanding and interconnecting scalable complexities, forming the foundation for a probabilistic framework that accurately models the underlying patterns and relationships driving price movements over time. Achieving this requires analyzing how price historically reacts to key levels and projecting this consistency for a future price coverage. This research will be used to build an indicator that automatically generates these levels in Pine Script.
Please, confirm in comment section if you would like me to do traditional subjective TA over objective Fractal Analysis. I highly appreciate your involvement!


Tweet and ideaYou can use tweet and idea on ideas. For example, you can use Elon Musk tweets and ideas GameStop’s Bitcoin Bet Fails to Wow Traders.

Btcusdt/M15Bitcoin's structure is currently bearish, and after a retracement to approximately 87,000 units, it might experience an upward move if it can break through the upcoming zone. However, it is expected to continue its downward trend to touch its lower range once again.
💫 For those looking to purchase for long-term holding, it may be better to wait for lower price levels.
💫 For those interested in swing trading, you can consider entering step-by-step positions if the price returns to the previous lower zone before touching the upcoming range. Hold the position until the first target is reached or potentially until the main range mentioned, followed by updating the analysis.
💫 If the price breaks through the upcoming range, I will update the analysis for re-entry opportunities.
💥 I’d be happy to receive your reactions and support

Xauusd/M15Gold is structurally bullish, so it's better to exercise caution when taking sell positions and avoid trading against the trend as much as possible. In the 15-minute timeframe, when the price reaches the specified zones, you can enter buy positions based on your trading style by observing the trigger.

TESLA is up 47X vs the SPX. Can it do another 6.9X?An extraordinary unicorn enterprise, or a collection of companies and intellectual properties, led by the most prominent CEO in the history of public companies.
TESLA and ELON are impossible to overlook, and this chart has kept many observers on the sidelines for over 14 years. In the initial 6 to 9 years, Wall Street analysts and commentators failed to grasp the bigger picture, focusing excessively on the balance sheet and evaluating the company merely as an automaker. They completely missed the groundbreaking technologies being developed and advanced.
Today, we stand on the brink of fully autonomous vehicles becoming commonplace, artificial intelligence integrating into our everyday lives, and affordable space exploration becoming a reality, not to mention the myriad of other innovative technologies emerging from this remarkable company.
Individuals often enjoy predicting market peaks and labeling stocks as overvalued.
However, this chart comparing Tesla to the S&P 500 indicates that the stock may be gearing up for another surge to new heights.
Picture 10 million robotaxis cruising through our streets.
Envision a fleet of vehicles that not only generates income but also undergoes upgrade cycles, in contrast to traditional cars that face maintenance cycles, and are bogged down by Human operator's.
This development is poised to significantly transform the self-hailing ride-sharing market and the food delivery sector, potentially eliminating the role of human drivers.
In fact, Uber could very well become Tesla's largest client!


IAG Stock Took some heat! Is there anything to take here?🟢SeekingPips🟢 has this on the radar.
⭐️ Have your levels ready and wait for your A+⭐️ Setup.
ℹ️ Our levels are here marked out.
I have ZERO interest in taking a position here however a deeper sell-off and I will start paying attention.❗️
⚠️ ALERTS set and LEVELS marked.
🟢Now go away and ENJOY your WEEKEND and lets HURRY UP AND WAIT and lets see what NEXT WEEK has for us👍

The XRP Bull Run Starts Today (XRP to 3 Digits)XRP is following it's 2017 pattern very closely and it looks like it's about to turn around.
The resemblances between March 2017 and March 2025 are numerous. Should the 2017 pattern hold, we might expect XRP to reach double-digit levels in April, approach triple digits in late May or June, and peak in late 2025 or very early 2026.
Both macro and micro factors indicate that a significant bull run is around the corner.
P.S. I view the November surge as merely the release of regulatory pressure that had been suppressing XRP, allowing it to return to the level it might have achieved without such constraints.

Seeking a breakthrough within the fluctuation range.Using this indicator, Seeking a breakthrough within the fluctuation range.

APPLE: Fibonacci Fractal Mapping IApple Inc has some complex cycles which we're about to breakdown to composite phases via fibonacci ratios.
REGULARITIES
Continuous Fractal
Since start 00's, bearish trends in Apple have notably shrunk in percentage terms, painting the past two decades as a period of ever growing optimism. Many long-term cycles remain incomplete for an extended time amplifying the opposing force.
A linear extensions through local tops can serve a future support level.
A parallel line of that same angle carries the same deterministic properties.
This unlocks use of Fibonacci channels to further analyze the structure factoring in specific side tilt.
Continuous Fractal Type - forces alternative approach in interconnecting critical points
Fibonacci Fractal Mapping
Fractal Hierarchy

TONUSDT - New Trend? After deflating the bubble by 80%, Pavel's currency reversed sharply and is already up 60%.

Epileptic | AccumulationSimilar consolidation at this lower swing like the last time. Looking forward to seeing a break above liquidity and for price to return to the swing high once the markets are ready to roll. Sometime from now to July.

Still Doubting Altseason? This Chart Might Change Your Mind..Hello Traders 🐺
Before we begin, let me tell you why I decided to publish this idea:
Over the past few weeks, I’ve received tons of comments and messages from people saying, "This time is different—we’re not going to see an Altcoin Season." So, I decided to lay out the full evidence pointing to a massive upcoming Altcoin Season. 🔥
📊 Breaking It Down
To make this easier to follow, I’ve used a line chart to remove the excess noise. As you can see, there’s a strong inverse correlation between BTC Dominance (BTC.D) and Altcoins' performance. But how does it actually work?
Every time we see a top in BTC.D, we enter a BTC season—meaning most of the capital flows into Bitcoin while altcoins lag behind. But after a while, BTC.D starts weakening, and at the same time, altcoins begin to gain strength and outperform BTC as the market shifts. 📉➡️📈
So far, we’ve had 2 major Altseasons, and right now, we’re seeing the same scenario playing out again:
✅ BTC.D is starting to show weakness
✅ Altcoins are beginning to outperform BTC
✅ If you zoom in on the ALTS/BTC chart, you’ll notice that many altcoins are trading near their all-time lows against BTC — a huge opportunity!
What Else?
I also believe we’re close to entering a Quantitative Easing (QE) phase, which means more liquidity will be available to fuel the next rally. Combine that with current chart setups, and the case for Altseason 2025 becomes even stronger.
I hope you enjoyed this idea! Make sure to like and follow for more updates—and as always:
🐺 Discipline is rarely enjoyable, but almost always profitable 🐺
🐺 KIU_COIN 🐺


AUDCAD | Reoccurring FractalsWe're looking at 3 complete fractals and the fourth one being the current one. Same phase as the last, a bit of sideways trading/consolidation then aggressive buying breaking out to the upside.
Price action has been trending upwards with HHs and HLs and we're currently at a Lower High bouncing off the lower trendline below.
Would be ideal to look for long positions only for this setup as bulls are looking stronger from this view.
~300pips going into the 3rd wave.

SeekingPips sees TSLS Tesla GAIN $60 ! What's Next?It's hard for many traders to do. 🤔
⭐️ I still see it today with traders and investors alike. Even with some who have been at it for many years...
BUT some of the BEST ENTRIES & EXITS for me have been when the OPEN CANDLE IS COMPLETELY AGAINST ME.
The LAST WEEKLY TESLA chart that I shared is another prime example of this.
🟢SeekingPips🟢 shared a BULLISH BIAS when the WEEKLY CHART was looking as BEARISH as hell. 🔥
ℹ️ Now it really is not a method that works for everyone.
Trading against momentum always looks SCARY BUT the SECRET is MULTI TIMEFRAME ANALYSIS and also being able to...
VISUALISE DIFFERENT OBSCURE TIMEFRAMES IN REAL-TIME USING THE CURRENT OPEN CHART.
⚠️I plan on going DEEPER INTO this rabbit hole with some information and examples in the TUTORIAL SECTIONS soon.⚠️
🚥 In it's simplest terms an example would be beaing able to note where price is on a 20 or 10 min chart just only by having a 5 minute chart in front of you.
By being able to do so in REAL-TIME KEY LEVELS POP OUT that you may not have noticed from the 5 minute chart perspective only.💡💡💡
Now 🟢SeekingPips🟢 has to wait for a TRIGGER for a NEW ENTRY & SO SHOULD YOU.👍👌👍

XRP Pounced on by the group! RIPPLE XrpUsd Ready to Go? Now if you NOTE exactly where PRICE was at the EXACT TIME that 🟢SeekingPips🟢 Shared the last XRP CHART.
You can see that was a PERFECT ALIGNMENT of both TIME & PRICE.👌
ℹ️ Many SHORT TERM & INTRADAY TRADERS paid themselves at 🟢SeekingPips🟢 pre defined 🔴RED🔴 level @ 2.4980 for a PAIN FREE TRADE with A GREAT REWARD TO RISK OUTCOME.
🌎 You can also NOTE TWO VERY IMPORTANT THINGS WITH THIS TRADE...
▪︎1) Our ORIGINAL Stop Loss has still been untouched even after the 100% retracement of our original ENTRY.
▪︎2) Now anyone who was not in the group or followed 🟢SeekingPips🟢 original chart share at the time of our entry and instead decided to jump in as price was already moving up would have made a poor choice.❗️
By waiting on the next 240m bar/candle to close you could have theoretically left a limit order at original entry area and would have been easily filled for a STRESS FREE trade so far.🚀🚀🚀
What's the lesson here❓️
Know what you want to see and do not act beforehand.
If you miss your FIRST entry have a PLAN for your SECOND ATTEMPT.
Note the word PLAN.
⚠️ As per 🟢SeekingPips🟢 BIO Without A PLAN it's NOT TRADING But GAMBLING.
🎲

SPX us500The index has a target price range of 5991, there is a possibility of going up from this moment, but another possibility is that the range of 5520 will be touched and then it will move up.
