EUR/USD 4H Analysis: Smart Money Concept SetupOn the 4H timeframe, EUR/USD transitioned from a downtrend to bullish momentum after breaking the previous LH. This indicates a potential trend reversal.
Price swept liquidity at the IDM level, confirming the inducement move. I’ll now move to the 30M timeframe to refine my entry. My focus is on waiting for a CHoCH (Change of Character) and a bullish order block retest before executing a buy position.
Sticking to one pair this week to maintain a focused approach. Let’s see how this plays out!
Feedback is welcome—drop your thoughts below!
Bless Trading!
Fractal

Probabilistic RealmI remember taking the CMT exam, where one question referenced the Efficient Market Hypothesis (EMH), which asserts that price action is purely random. To avoid losing points, I had to select “random” as the correct answer, despite knowing that market behavior is far more structured than EMH suggests. Despite of passing I still won't ever agree that market is random.
Prices are neither random nor deterministic. Market fluctuations follow a chaotic structure, but chaos is not the same as randomness. Chaos operates within underlying patterns and scaling, whereas randomness lacks any order or predictability. Although chaos makes predictions difficult, keep in mind that the universe is not random— effects still follow causes in continuity . No matter how chaotic a system may seem, it always follows a trajectory toward a certain point.
For example, in Lorenz’s model of chaos, the trajectory formed a pattern resembling the wings of a butterfly. Understanding these patterns of chaos has practical applications. In the market, even a slight fluctuation can trigger irreversible changes, reinforcing the idea that we cannot rely on absolute forecasts— only probabilities .
The market is not necessarily a reflection of the economy; rather, it reflects participants’ feelings about the “economy.” The human emotional component drives the uncertainty and chaos, making it essential to visualize price dynamics exclusively through "systematic" lens.
Market Structure Is Self-Referential
Markets move in proportion to their own size, not in fixed amounts. Price is arbitrary, but percentage is universal – A $10 move on Bitcoin at $100 is not the same as a $10 move at $100,000. Percentage metrics reflects this natural scaling and allows comparability across assets and timeframes – A 50% swing in 2011 holds similar structural significance to a 50% swing in 2024, despite price differences. Using log scale is a must in unified fractal analysis.
Percentage swings quantify the intensity of collective emotions—fear, panic, euphoria—within market cycles. Since markets are driven by crowd psychology, percentage changes act as a unit of measurement for emotional extremes rather than just price fluctuations. After all it's the % that make people worry..
The magnitude of percentage swings encodes emotional energy, shaping the complexity of future market behavior. This means that larger past emotional extremes leave deeper imprints on market structure, influencing the trajectories future trends.
The inverse relationship between liquidity and psychology of masses partially explains the market’s fractured movements leading to reversals. In bullish trends, abundant liquidity fosters structured price behavior, allowing trends to develop smoothly. In contrast, during bearish conditions, fear-driven liquidity contraction disrupts market stability, resulting in erratic price swings. This dynamic highlights how shifting sentiment can amplify price distortions, causing reactions that are often disproportionate to fundamental changes.
PROBABILISTIC REALM
Rather than viewing fluctuations as a sequence of independent events, price action unfolds as a probabilistic wave shaped by market emotions. Each oscillation (outcome) is relative to historical complexity, revealing the deep interconnectedness of the entire chart that embodies the “2-Polar Gravity of Prices.”
Fibonacci numbers found in the Mandelbrot set emphasizes a concept of order in chaos. The golden ratio (Phi) acts as a universal constant, imposing order on what appears to be a chaotic. This maintains fractal coherence across all scales, proving that price movements do not follow arbitrary patterns but instead move relative to historic rhythm.
The reason why I occasionally have been referring to concepts from Quantum Mechanics because it best illustrates the wave of probability and probabilistic realm of chaos in general. Particularly the Schrodinger's wave equation that shows probability distributions. Key intersections in Fibonacci-based structures function as "quantum" nodes, areas of market confluence where probability densities increase. These intersections act as attractors or (and) repellers, influencing price movement based on liquidity and market sentiment. Similar to Probability Distribution in QM.
Intersections of Fibonacci channels reveal the superposition of real psychological levels, where collective market perception aligns with structural price dynamics. These points act as probabilistic zones where traders’ decisions converge, influencing reversals, breakouts, or trend continuations. Don’t expect an immediate reversal at a Fibonacci level—expect probability of reversal to increase with each crossing.
To prove that Efficient Market Hypothesis is wrong about prices being random, I'd go back to a very distant past from current times. For example, price fell 93% from 2011 ATH, reversed and established 2013 ATH.
Using a tool "Fibonacci Channels" to interconnect those 3 coordinates reveals that markets move within its fractal-based timing derived from direction.
If prices were random, this would have never happened.
The bottomline is that viewing current price relative to history is crucial because markets operate within a structured, evolving framework where proportions of past movements shape future probabilities. Price action is not isolated—it emerges from a continuous interaction between historical trends as phases of cycles, and liquidity shifts. By analyzing price within its full historical context , we can differentiate between temporary fluctuations and meaningful structural shifts justified by the fractal hierarchy. This approach helps identify whether price is expanding, contracting, or aligning with larger fractal cycles. Without referencing historical complexity, there is a risk misinterpreting patterns from regular TA, overreacting to short-term noise, and overlooking the deeper probabilistic structure that governs price behavior.

FIRST IT WAS MONTHLY REJECTION, NOW WEEKLY DOUBLE TOP WITH BTC!With the weekly double top, BTCUSD outlook is looking bearish and will likely dip to its mean…
N.B!
- BTCUSD price might not follow the drawn lines . Actual price movements may likely differ from the forecast.
- Let emotions and sentiments work for you
- ALWAYS Use Proper Risk Management In Your Trades
#ethusd
#crypto
#btcusd

EURUSD another selling opportunity!Hey guys,
To keep it short, based on my previous analysis on EURUSD that the first TP target hit, I want to share another selling opportunity on this currency pair.
I consider the previous movement as a false breakout of price and a good rejection is happening.
So It can be another sell opportunity with reasonable risk/reward ratio (around 1/3).
Good luck

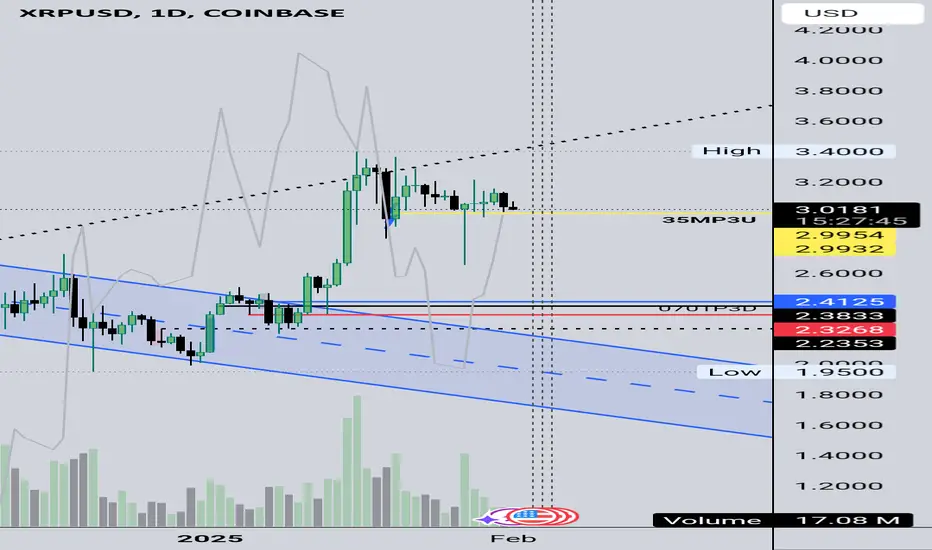
XRP Weak Hands Selling! XRPUSD Cheap BUY? Ripple Long Bargain? XRP Weak Hands Selling! XRPUSD Cheap BUY? Ripple Long Bargain?
ℹ️ The thing is everyone talks about BUYING the 🥳DIP but the fact is that when the DIPS turn up the traders WITHOUT A PLAN often do 😕NOTHING or EVEN WORSE do the 😨OPPOSITE and chase the MOMENTUM DOWN. 😱
⚠️The Question Is Which Trader Are You❔️

TOTAL2 / BTC ALTS Should be Close to BottomingWho remembers this chart I posted a month ago on TOTAL2 / BTC ?
This was the one that TradingView shared of mine on 12/31/24
Called the double bottom here. My squiggles are undefeated.
Alts should be close to the end of bleeding.
One last flush I presume (hope) 😂

DOGE: "Probably Nothing..."The green line, DOGE rides to Olympus.
The red line, DOGE first visits Hades.
Which line forward, western DOGE?

Litecoin price action "I've analyzed Litecoin's price behavior for the next three months. In my view, the intersection points of the trend lines on April 2nd and May 9th suggest a likely price correction toward these lines." #LTC

dead cat bounceThe dead cat bounce scenario might be repeating for the EURUSD.
This will be simplified by tariffs to Canada and Mexico, if they occur, as it will strengthen the dollar.

XRP RIPPLE What Next? XRPUSD SeekingPips is Still LONG BUY only ✅️ As we enter a new month it's no secret that 🟢SeekingPips🟢 remains with a LONG ONLY BIAS.
🌎 PRICE ACTION has given no reason to consider that the ⭐️ DAILY CHART FLAG BREAKOUT ⭐️ was a dud and so we are waiting for at least a duplicate of the FLAG POLE length to be reached from the flag BREAKOUT POINT.
⭐️ Like What You See Here? Feel Free To Boost, Join & Comment👍
BTC consolidating, printed fresh bearish OB- on Daily candlesI believe this new bearish order block means we should be looking for sellside targeting. Until we get a bullish daily orderblock, now we should be bearish on entries.

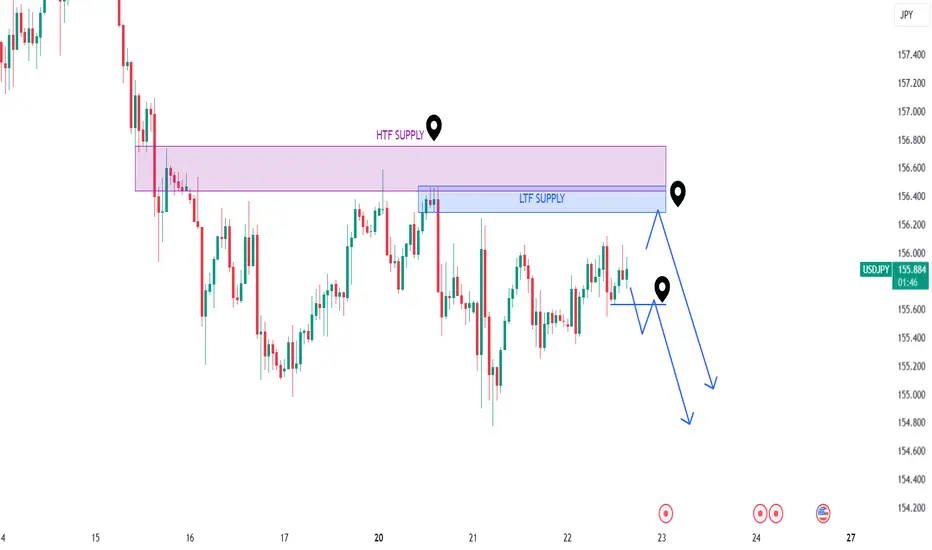
USDJPY Shorts Based on Current Re-DistributionBy combining Wyckoff and SMC principles we have a clear guide on what to expect, and what to do when it happens.
Patience is the name of the game, so set your alerts and hang tight until then.
- Option 2 could turn into a short term swing trade (until we reach daily demand levels)
BTC | Developing Distribution Pattern | FractalsWe're looking at a disjointed channel dating back from 2019 capturing all the last two cycle tops and bottoms without having to use the log scale
This distribution pattern caught my eye as it seemed very similar to the fractal top in 2021 and of course we can spot partial fractals of distribution all over the chart like the ones I circled in yellow
As we trade in this top like area we have to remember BTC is a Risk-On asset and is sensitive to economic data
Lets take a look at altcoins CRYPTOCAP:TOTAL3 at the bottom, we can notice that every time there was a developing continuation pattern, perhaps a bullish flag in this scenario, BTCs price slows down with CRYPTOCAP:BTC.D looking weaker within the 60 - 65% zone
Seeing this I dont think we'll see a 70% dominance with alts looking to rise from the dead and to shoot for for the moon🌝
🎯My relevant post shows targets of $115k BTC from the falling wedge breakout also in confluence with a fib extension eyeing at the same level as the flag pole target, 100%
We can also overshoot to around $120k
One more thing when we line up TOTAL3s bullish patterns with BTCs price you'll notice BTC starts to underperform and while ALTs look to over perform
We all know what happens after ALTs hit the moon and BITSTAMP:BTCUSD may be telling us something is coming soon.
Stay tuned for more BTC updates and lets get through this together🚀

EURJPY - Reaction off HTF H4 SnD area - M5 entryCounter trend scalp idea
Watch out for volatility with imminent news


Is it time for DOGE to AGGRESSIVELY FLIP Bitcoin in dominance?Rules are made to be broken, so take this fractal with a huge dash of salt.
But it's right there, like clockwork.
Have thoughts?
Don't shoot the messenger please.

ETH LongStrong level to long, else you can see on the chart 1D inefficiency tested, fvg from Monday 13 jan holding well, built an order block recently at the same level that holds well
The force did not cause lower breakout, tested well 1h inefficiency from where I grabbed the position, picture looks very familiar to what we have seen in the past on ETH
Typical AMD model logic aiming for breakout higher, probably closing earlier though

AUDUSD Wait for the price leave the consolidation zone.
If it comes out in Long, wait for the retest in the support and look to enter in Long.
If it goes short, wait for the Retest at resistance and look to go short.

GBPUSD Technical Analysis and OutlookPrevious Observations:
Long-term Downtrend: Confirmed downtrend from mid-2021.
Major Support Breach: Below 1.2000 in late 2022.
Recent Recovery Attempt: Above 1.2400, buying pressure still evident.
Key Resistance Zones (1h): Current level @ 1.2450
Key Resistance Zones (4h): 1.2500-1.2600.
Key Support Zones (Weekly): 1.2000 and 1.1800 - There's room to keep pushing lower.
Potential Buying Climax (Daily, 4h, 1h): Steepness of recent rise hints at possible pullback.
Additional Bearish Confirmations for Potential Shorts :
- Price tested and bounced off the 200 EMA several times in Dec 2024 (4h).
- The pair is currently hovering around the 50% retracement level of the recent short-term decline, a common area for price reversals.
- Bearish divergence confirmations have already presented this week on the hourly time frame. This is a tell-tale sign of institutional orders being filled at specific levels and generation of further supply. (This may be the conclusion of a 'PHASE C' in a redistribution cycle).
- The dollar shows no signs of weakening against the GBP both in technicals as well as fundamentals (Recent data shows the U.S. economy added 256,000 jobs in December, surpassing forecasts and reinforcing a strong dollar narrative).
Conclusions:
Considering that we see a trendline breakout followed by strong bearish reactions which are ideally happening at HTF supply levels, we can assume that the fractal nature of the markets will play out accordingly. We should not ignore the fact that price has reacted from LTF demand or that we saw a recent bullish imbalance filled- entering shorts off the current supply level should only be done with sufficient confirmations (we may have to look at how the London session open influences price action).
Disclaimer:
This analysis is for informational purposes only and should not be considered financial advice. Trading involves significant risk, and it's essential to conduct your own thorough research and analysis before making any investment decisions. Past performance is not indicative of future results. Always use appropriate risk management techniques and trade responsibly.

EURUSD is possible to drop soon!Hey guys,
based on the chart, I've identified a resistance area (in 4H timeframe).
And we can see the rejection of price from the mentioned area.
Also as confirmation for our scenario is the descending channel that is identified on the chart.
So It ca be another good trading opportunity with risk/reward ratio around 1/4 which is considerable!
Good luck.

WILL BULLISH ORDER CANDLE ABLE TO REVERSE AUDUSD?AUDUSD pair now hovering over the bullish order candle. Will this be sufficient for the pair's bullish reversal to test its recent swing high? Goto LTF to establish bullish market structure; else, pair may still go further down.
N.B!
- AUDUSD price might not follow the drawn lines . Actual price movements may likely differ from the forecast.
- Let emotions and sentiments work for you
- ALWAYS Use Proper Risk Management In Your Trades
#audusd

Read The EURUSD MarketLet's Read The Market of EURUSD and Follow our Analysis with see accurate previous predictions have been, Good Luck With Your Trades <3

nasdaq futures next week idea nasdaq futures next week idea trade from bearish breaker on H1 time frame.
