NASDAQ price dropAfter the Nasdaq price reaches around 23642.2, a historic drop will occur and the target is to drop to 16308.
Whatever happens at the highest price, the final destination is towards 16308.
I have identified the price levels in the middle of this expected drop that can cause the price to correct.
IG:NASDAQ
Fractal

BITCOIN TOUCHED 110K — THEN REJECTEDNot what bulls wanted to see.
With massive gaps below, this kind of price action ain’t it.

AMD: Wave DimensionsProjection via Historic Wave Dimensions
Fractal Wave Marker with settings: core period of 60 and 1 Phi Scaling on1h TF AMD chart
From point of 3rd degree wave's reference:
If resistance curve is violated:
Mapping a cycle:

BTC SCALP TradeWait for the entry then take with small amount no high risk must use SL. If BTC don't retrace towards 106.5k in coming hours then don't take risk on shorting it will breakout towards 113k

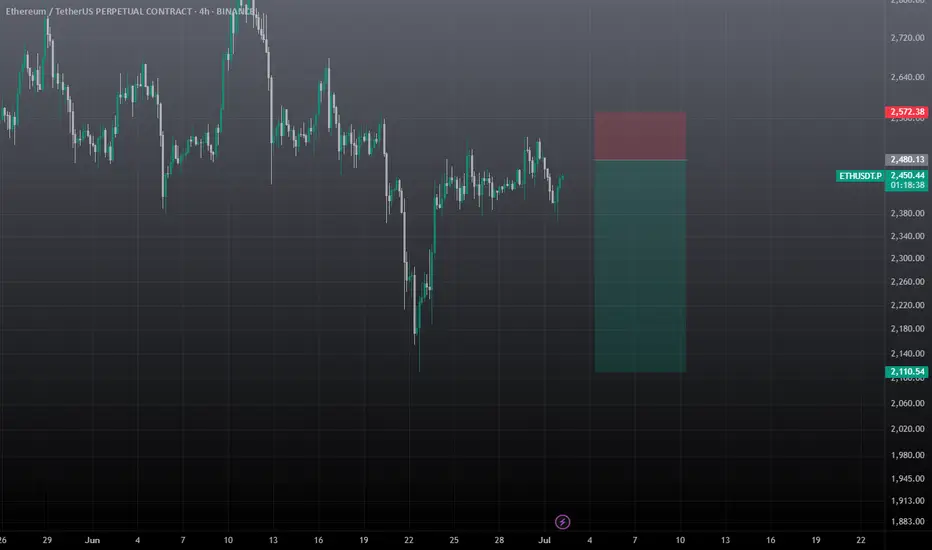
ETHUSDT SWING TRADE SetupWait for the entry and must use sl, if sl hits then wait for candle closure, candle managed to close above the SL, still there is lot of supply zone for eth till 2.7k, So fakeout also possible. I will comment the update, SO closely follow me.
Bitcoin: 170k–180k?If you find this information inspiring/helpful, please consider a boost and follow! Any questions or comments, please leave a comment!
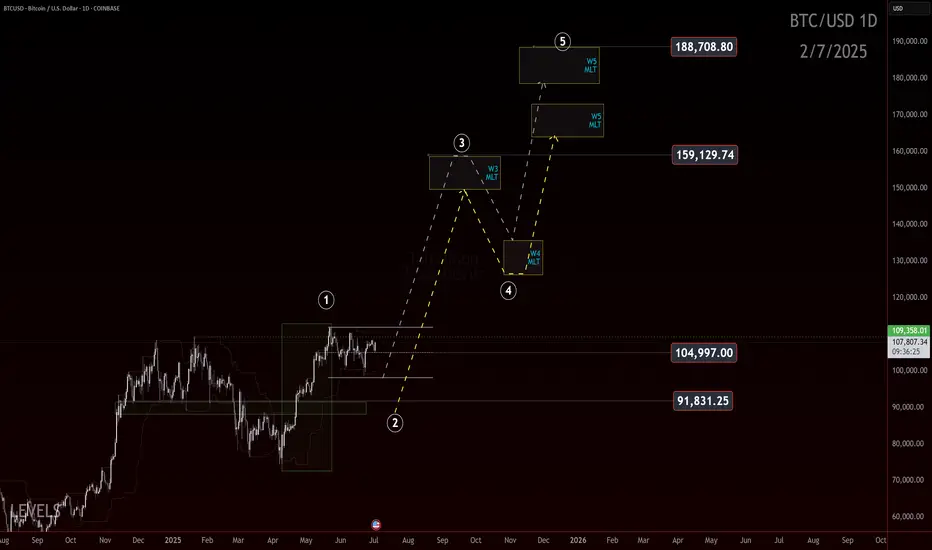
Bitcoin: 170k to 180k?
Let’s talk bias.
We’ve seen a powerful move off the 75k low, and it’s hitting some markers of a potential wave 1 impulse. If that structure holds and price doesn’t come back to wipe out the lows in a wave 2 retracement, then this is what we’d be looking at.
The idea? This is a conservative roadmap built off Elliott Wave Fibonacci projections and it targets the 170k to 180k zone.
Now, let’s be clear. This is a conservative projection. We’re not talking hopium fueled 250k moon targets here. We have no proof of that yet. We're anchoring the wave count and saying: if this is a 1, we’re due a 2, and then a 3 takes us to the upper levels.
But there’s a catch. Always is.
If price starts to fade back through the 91.8k area in a deep aggressive retrace, this roadmap gets less likely. Breaking the 75k pivot means the impulse structure failed or was misread, and we shift the count.
Until then, the 170k–180k level is a possible destination based on this roadmap.
Trade Safe!
Trade Clarity!
TIA Scalp trade setupwait for the retest of breakout, set sl & tp. While on swing trade will long below 1.31 and tp 2.0$, TIA is extremely oversold, So less affected by BTC.

1000 Floki swing trade setupwait for the entries, must use SL. Don't go for long at any coin wait for the short entries.

inj swing trade setupInj has broken downside, expecting more downfall before any leg up, wait for the entries to be filled, these are swing trades based on 1 day TF, so here wick doesn't matter wait for the closing, you can hold them without SL if entry achieved, take 1st entry on mentioned points 2nd entry below SL, and then wait for the closing, IF any entry achieved and candle closed above the short then wait for the pullback and close on entry points if long entry achieved then hold the trade 2nd entry take from previous wick low and wait for the tp this leg down will be the final shakeout before any major move. That's why giving you some short entries. BTC will take a final leg down sooner or later, then Boom your alt season starts.

QQQ: Scaling Recursive PatternsSo far the closest recursive pattern that can mimic current growth would be shape of expansion after covid crash. In both cases the fall was sharp that caused it grow in distinctive way, so we can grab the cycle of the pattern. To keep it simple for this structure, crossing curve would be first sign that price breaks out of regular rhythm and might dive sooner. Added other related patterns:

gold strong upwardGold will continue its strong upward trend, the corrections seem to have come to an end, the gold price is certain to reach above $3500, if the current price and the price of 3235 break down, you should not panic, the direction of the gold price movement is still towards the ceiling ( ATH ) CMCMARKETS:GOLD

Understanding SFP In Trading1. What is a Swing Failure Pattern (SFP)?
A Swing Failure Pattern (SFP) occurs when the price temporarily breaks a key swing high or low but fails to continue in that direction, leading to a sharp reversal.
This pattern is often driven by liquidity grabs, where price manipulates traders into taking positions before reversing against them.
An SFP typically consists of:
A false breakout beyond a previous swing high/low.
A sharp rejection back within the prior range.
A liquidity grab, triggering stop-loss orders and fueling a reversal.
SFPs provide powerful trade opportunities, signaling potential reversals and the exhaustion of trends.
2. Understanding Liquidity Grabs & Stop Hunts
The financial markets are structured around liquidity. Large institutions and algorithmic traders require liquidity to execute their large orders efficiently.
One way they achieve this is by triggering liquidity grabs and stop hunts.
Liquidity Grab:
Occurs when price moves beyond a key level (e.g., swing high/low), activating orders from breakout traders and stop-losses of trapped traders.
Smart money absorbs this liquidity before pushing the price in the opposite direction.
Stop Hunt:
A deliberate price movement designed to trigger stop-loss orders of retail traders before reversing.
Often seen near major support and resistance levels.
These events are crucial for understanding SFPs because they explain why false breakouts occur before significant reversals.
3. Why Smart Money Uses SFPs
Institutions, market makers, and algorithmic traders use SFPs to:
Fill large orders: By grabbing liquidity at key levels, they ensure they can enter large positions without causing excessive price slippage.
Manipulate retail traders: Many retail traders place stop-losses at obvious swing points. Smart money exploits this by pushing the price beyond these levels before reversing.
Create optimal trade entries: SFPs often align with high-probability reversal zones, allowing smart money to enter positions at better prices.
Understanding how institutions operate gives traders an edge in identifying manipulative moves before major price reversals.
4. Market Structure & SFPs
Market structure is built upon a series of swing highs and swing lows. Identifying these key points is crucial because they represent areas where liquidity accumulates and where price is likely to react.
Swing High (SH): A peak where price makes a temporary high before reversing downward.
Swing Low (SL): A trough where price makes a temporary low before reversing upward.
Types of Swing Points in Market Structure
Higher Highs (HH) & Higher Lows (HL) – Bullish Trend
Lower Highs (LH) & Lower Lows (LL) – Bearish Trend
Equal Highs & Equal Lows – Range-Bound Market
5. Liquidity Pools: Where Traders Get Trapped
Liquidity pools refer to areas where traders' stop-loss orders, pending orders, and breakout entries accumulate. Smart money uses these liquidity zones to execute large orders.
Common Liquidity Pool Zones:
Above swing highs: Retail traders place breakout buy orders and stop-losses here.
Below swing lows: Stop-losses of long positions and breakout sell orders accumulate.
Trendline & Range Liquidity:
Multiple touches of a trendline encourage traders to enter positions based on trendline support/resistance.
Smart money may engineer a fake breakout before reversing price.
6. Identifying Bullish SFPs
SFPs can occur in both bullish and bearish market conditions. The key is to identify when a liquidity grab has occurred and whether the rejection is strong enough to confirm a reversal.
Bullish SFP (Swing Low Failure in a Downtrend)
Price sweeps a key low, triggering stop-losses of long traders.
A strong rejection wick forms, pushing price back above the previous low.
A shift in order flow (bullish market structure) confirms a potential reversal.
Traders look for bullish confirmation, such as a higher low forming after the SFP.
Best bullish SFP setups occur:
At strong support levels
Below previous swing lows with high liquidity
After a liquidity grab with momentum confirmation
7. Identifying Bearish SFPs
Bearish SFP (Swing High Failure in an Uptrend)
Price takes out a key high, triggering stop-losses of short traders.
A sharp rejection forms, pushing the price back below the previous high.
A bearish shift in order flow confirms downside continuation.
Traders look for bearish confirmation, such as a lower high forming after the SFP.
Best bearish SFP setups occur:
At strong resistance levels
Above previous swing highs where liquidity is concentrated
With clear rejection wicks and momentum shift
8. How SFPs Signal Reversals
SFPs provide early warning signs of trend reversals because they expose areas where liquidity has been exhausted.
Once liquidity is taken and the price fails to continue in that direction, it often results in a strong reversal.
Key Signs of a Strong SFP Reversal
Long wick rejection (indicating absorption of liquidity).
Close back inside the previous range (invalidating the breakout).
Increased volume on the rejection candle (confirming institutional activity).
Break of short-term market structure (trend shifting).
Divergences with indicators (e.g., RSI divergence at the SFP).
9. Identifying High-Probability SFPs
One of the most critical aspects of a valid SFP is how the price reacts after a liquidity grab. The candle’s wick and close determine whether an SFP is strong or weak.
A. Wick Rejections & Candle Closes
Key Features of a Strong SFP Wick Rejection
Long wick beyond a key swing high/low (indicating a liquidity grab).
Candle closes back inside the previous range (invalidating the breakout).
Engulfing or pin bar-like structure (showing aggressive rejection).
Minimal body size relative to wick length (e.g., wick is 2–3x the body).
Bullish SFP (Swing Low Failure)
Price sweeps below a key low, triggering stop-losses of buyers.
A long wick forms below the low, but the candle closes back above the level.
This signals that smart money absorbed liquidity and rejected lower prices.
Best bullish SFPs occur at major support zones, previous swing lows, or untested demand areas.
Bearish SFP (Swing High Failure)
Price sweeps above a key high, triggering stop-losses of short sellers.
A long wick forms above the high, but the candle closes back inside the range.
This signals that smart money absorbed liquidity and rejected higher prices.
Best bearish SFPs occur at resistance levels, previous swing highs, or untested supply areas.
❌ Weak SFPs (Avoid These)
❌ Wick is too small, meaning the liquidity grab wasn’t significant.
❌ Candle closes above the swing high (for a bearish SFP) or below the swing low (for a bullish SFP).
❌ Lack of strong momentum after rejection.
B. Volume Confirmation in SFPs
Volume plays a crucial role in validating an SFP. Institutional traders execute large orders during liquidity grabs, which often results in spikes in trading volume.
How to Use Volume for SFP Confirmation
High volume on the rejection wick → Indicates smart money absorption.
Low volume on the breakout move → Suggests a lack of real buying/selling pressure.
Increasing volume after rejection → Confirms a strong reversal.
Spotting Fake SFPs Using Volume
If volume is high on the breakout but low on the rejection wick, the move may continue trending rather than reversing.
If volume remains low overall, it suggests weak market participation and a higher chance of chop or consolidation instead of a clean reversal.
Best tools for volume analysis:
Volume Profile (VPVR)
Relative Volume (RVOL)
Footprint Charts
10. Key Takeaways
SFPs are Liquidity Grabs – Price temporarily breaks a key high/low, triggers stop losses, and then reverses, signaling smart money absorption.
Wick Rejection & Close Matter – A strong SFP has a long wick beyond a swing point but closes back inside the range, invalidating the breakout.
Volume Confirms Validity – High volume on rejection wicks indicates smart money involvement, while low-volume breakouts often fail.
Higher Timeframes = Stronger SFPs – 1H, 4H, and Daily SFPs are more reliable than lower timeframe setups, reducing false signals.
Confluence Increases Probability – SFPs are most effective when aligned with order blocks, imbalances (FVGs), and major liquidity zones.
Optimal Entry Methods Vary – Aggressive entries capitalize on immediate rejection, while confirmation and retracement entries improve accuracy.
Proper Stop Loss Placement Prevents Fakeouts – Placing SL just beyond the rejection wick or using structure-based stops reduces premature exits.
Take Profit at Key Liquidity Levels – Secure profits at previous swing highs/lows, order blocks, or imbalance zones to maximize returns.

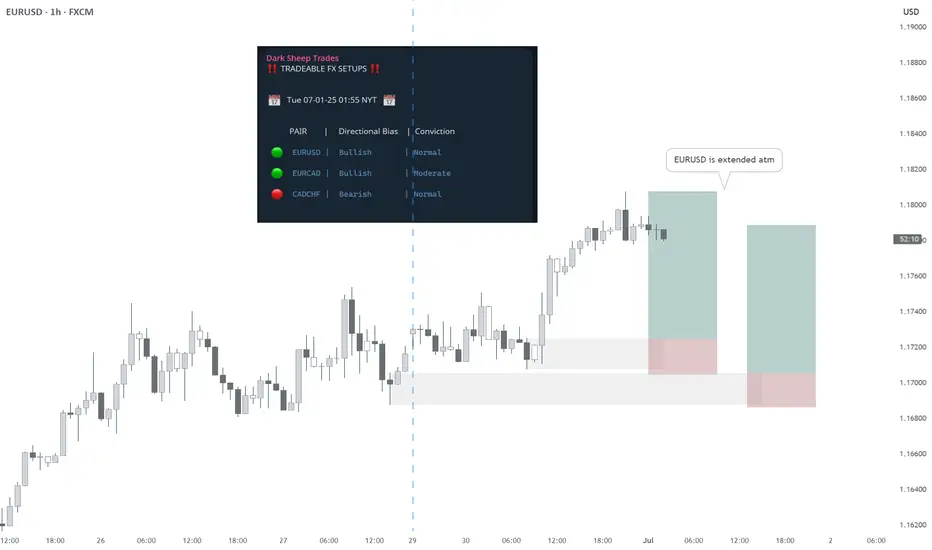
EURUSD BUY - Statistically-backed FX shortlistEURUSD BUY
Daily Outlook: Statistically-backed FX shortlist
@darksheeptrades
PLTR: Encoded Wave Replication IAs bullish wave gets mature on the way up, it draws distinctive tops in a way that warns of bullish exhaustion ahead because to some extent topologically highs indicate a registered rejection of moving further in a local scope (some period).
Scalable Recursive Patterns
If we pay attention to building blocks on smaller scale
Those patterns replicate in bigger scale for example
If the pattern really carries the identified encoding, I'd pay attention to how price retraces within fibonacci channel which is adjusted to the direction of fractal cycle in a clean version.

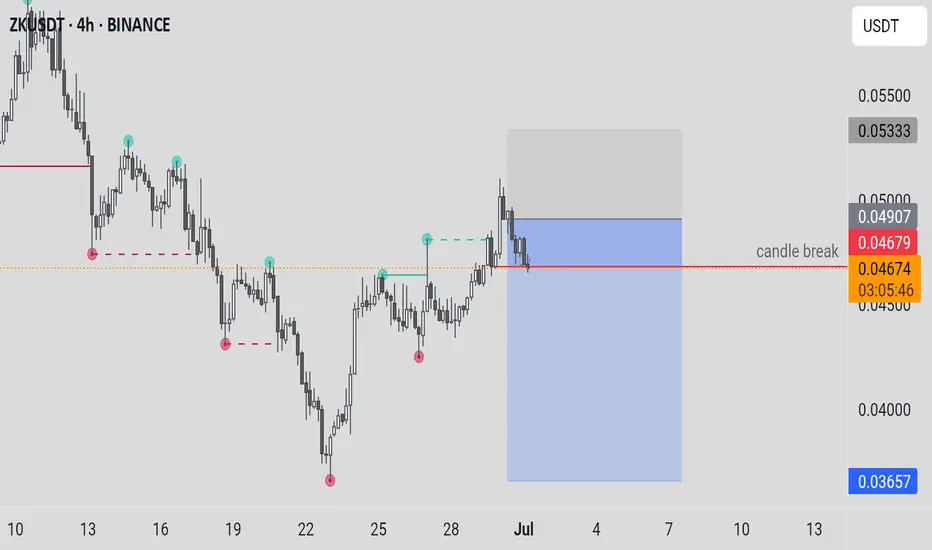
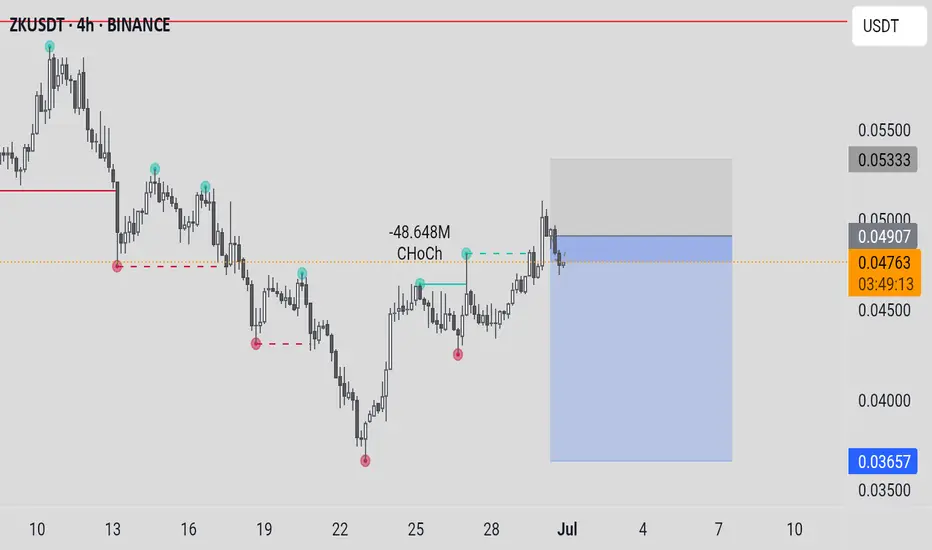
ZKUSDTCryptocurrency Futures Market Disclaimer 🚨🚨🚨
Trading cryptocurrency futures involves high risks and is not suitable for all investors.
Cryptocurrency prices are highly volatile, which can lead to significant gains or losses in a short period.
Before engaging in crypto futures trading, consider your risk tolerance, experience, and financial situation.
Risk of Loss: You may lose more than your initial capital due to the leveraged nature of futures. You are fully responsible for any losses incurred.
Market Volatility: Crypto prices can fluctuate significantly due to factors such as market sentiment, regulations, or unforeseen events.
Leverage Risk: The use of leverage can amplify profits but also increases the risk of total loss.
Regulatory Uncertainty: Regulations related to cryptocurrencies vary by jurisdiction and may change, affecting the value or legality of trading.
Technical Risks: Platform disruptions, hacking, or technical issues may result in losses.
This information is not financial, investment, or trading advice. Consult a professional financial advisor before making decisions. We are not liable for any losses or damages arising from cryptocurrency futures trading.
Note: Ensure compliance with local regulations regarding cryptocurrency trading in your region.
thanks for like and follow @ydnldn
VETUSDTCryptocurrency Futures Market Disclaimer 🚨🚨🚨
Trading cryptocurrency futures involves high risks and is not suitable for all investors.
Cryptocurrency prices are highly volatile, which can lead to significant gains or losses in a short period.
Before engaging in crypto futures trading, consider your risk tolerance, experience, and financial situation.
Risk of Loss: You may lose more than your initial capital due to the leveraged nature of futures. You are fully responsible for any losses incurred.
Market Volatility: Crypto prices can fluctuate significantly due to factors such as market sentiment, regulations, or unforeseen events.
Leverage Risk: The use of leverage can amplify profits but also increases the risk of total loss.
Regulatory Uncertainty: Regulations related to cryptocurrencies vary by jurisdiction and may change, affecting the value or legality of trading.
Technical Risks: Platform disruptions, hacking, or technical issues may result in losses.
This information is not financial, investment, or trading advice. Consult a professional financial advisor before making decisions. We are not liable for any losses or damages arising from cryptocurrency futures trading.
Note: Ensure compliance with local regulations regarding cryptocurrency trading in your region.
thanks for like and follow @ydnldn
SP500 - Cycle Analysis; New V-Bottom24 Dec 2018 - V-Bottom Trough:
This marks a clean V-bottom. Both the 227-ROC and 114-ROC showed simultaneous positive acceleration after price reacing its low. Shortly after, both crossed their 57-SMA almost in sync — increasing the probability of a sustained bullish move. Price confirmed this by breaking resistance and forming a V pattern. This was further validated by the centered moving average crossover (114-CMA crossing above 227-CMA).
25 Mar 2020 - Deep COVID Crash Trough:
During this phase the priced broke below the support, creating a deep trough. Altough both ROC lines initially showed strong negative acceleration due to the COVID-19 crash, they soon reversed above their 57-SMAs, signaling a major shift in momentum. This coincided with the price breaking above the key resistance which was also crossed in 2019 when confirming the old V-pattern. After this breakout, a brief pullback followed before the uptrend resumed with increasing strength.
22 Jun 2021 to 19 Dec 2023 - Pattern
During the initial period a bearish divergence was visible in the ROC, nevertheless price and rate of change both declined making a low in early October 2022. A technical pattern began to form, which appears to align more closely with a symmetrical triangle; So when measuring its height and projecting it from the breakout point aligns with the new all-time highs that were reached on 27 June 2025.
21 Mar 2025 - New Cycle Trough
A new V-bottom formed shortly after the current cycle began. Both ROC indicators had already crossed their SMAs to the upside, showing early signs of positive acceleration, days before of price broke through the resistance and reached the new record high.
The 227-SMA is likely to cross from below the fast SMA while a possibility of a pullback increase.
Following that, the 114-CMA will probably has the chance to cross back the 227-CMA, with the price potentially confirming a new support level and resuming its uptrend - in line with the broader cycle timeline.

FLOKI on Fire! Bullish Summer for FLOKIUSDTDuring the two-month period from July to August, it's unclear what the specific catalyst might be, but Floki appears poised for a price surge between 75% to 133%. The June low at 0.00005923 seems to mark a solid bottom, and from here, I anticipate a bullish trend in Floki’s price.


#GBPUSD: Bulls are in control, DXY Dropping Sharply!Hello Team,
We have identified a promising opportunity with a favourable price movement. The Pound Sterling to US Dollar (GBPUSD) pair has exhibited strong bullish volume, indicating potential further appreciation.
The current geopolitical tensions, particularly the involvement of the United States in the Iran-Israel conflict, are expected to negatively impact the US Dollar. This decline could potentially lead to an appreciation of the GBPUSD pair and other USD-denominated currencies.
It is advisable to closely monitor the price behaviour of the GBPUSD pair and consider potential investment opportunities based on its current trend.
Best regards,
Team Setupsfx

Market Re-Cap and Outlook for NEXT WEEKHere I am giving you a little insight as to what trades I am currently in, taken & looking to take for the week just gone and the week coming.
1 Winning trade on EU
1 Current open position on EU
EURGPB - Breakdown
AUDUSD - Breakdown
NZDUSD - Breakdown
Gold - Breakdown
If there are any pairs you would like me to share my feedback on give me a message and I will be happy to try and do so.
Thanks
Happy Hunting

Bitcoin: Curve AdjustmentsBottoms can be expressed as a curve which matches logarithmic growth patterns. In the long-term perspective it serves as signal of trend's transition phase in broader scale. Coordinate of top adjusted accordingly.
Extending them is crucial because together they gives boundaries of range compression. Some sort of wave limits which help to clarify price-based levels.
