EURAUD Potential Longs - Technical Outlook 17.06.2025Overall Trend & Context:
FX:EURAUD has been in an overall uptrend since mid May when price reacted off a daily demand level.
Technical Findings:
Price is currently trading just above the discount (equilibrium).
Would prefer to see it drop into the discount area - There are areas of demand on the 1h chart which we could possibly consider however the 4h demand shown on the chart above qualifies as a STRONG zone to trade from.
Notes:
If we see a 15m shift in structure it may be worth getting involved.
Fractal

NZDUSD - Trade Re-cap Take a look at the NZDUSD trade re-cap.
Here I explain exactly what I was looking for in getting this 1:10RR trade from start to finish.
Hope this helps

NVDA: Fractal Wave BreakdownBreaking above Rounding Top Pattern after rejections.
Wave transformed from pullback to impulsive one, which implies that the emerging structure needs to be routed to relative cycle.
Waveform
Referral structure looks like compressed version of decline after ATH.
As if the movement of big magnitude that pierces through SL levels, causes "shockwaves" that resets frequency of reversals of forthcoming waves.
Fibonacci interconnection of ATH and Bottom

Macromics Group: Market Trends Overview (June 2025)Global Economic Landscape: What Has Changed?
June 2025 marks significant shifts in the global economy. After several years of instability caused by the pandemic, inflation, and geopolitical tensions, markets are gradually stabilizing. However, new challenges are emerging: rising risks in Asia, digital transformation in Europe, and strategy shifts in the U.S.
China and India continue to show strong growth rates—5.8% and 6.5% respectively. Europe, by contrast, is lagging behind due to slow recovery and persistent inflation. The U.S. maintains a steady course driven by consumer spending and innovation, reporting 2.1% GDP growth.
Macromics Group continues to deliver in-depth analytics and strategies for clients seeking to understand and capitalize on these changes. We analyze trends across more than 120 industries, helping companies adapt and thrive.
Macroeconomics and Monetary Policy: A Shift Toward Stabilization
Financial regulators have begun cautiously lowering interest rates after the peaks of 2024. The U.S. Federal Reserve has dropped its rate to 4.5%, while the ECB has reduced its rate to 3.75%. This is made possible by a decline in inflation: 2.7% in the U.S. and 3.1% in the EU.
Meanwhile, developing nations like Turkey and Argentina are still grappling with high inflation. These countries risk falling behind the global recovery unless decisive steps are taken.
Overall, the global course is toward soft stabilization: interest rates remain high but steady. This creates favorable conditions for investment and long-term planning.
Financial Markets: From Caution to Moderate Optimism
Stock markets in June 2025 show mixed performance. U.S. indexes such as the S&P 500 and Nasdaq hit new highs, thanks to the booming tech sector. Stocks of companies involved in AI, quantum computing, and cybersecurity are particularly strong.
European markets are less active but relatively stable. Growth is limited by high costs, demographic issues, and the transition to ESG standards. In Russia and CIS countries, markets are under pressure due to sanctions, currency restrictions, and reduced investment.
On the currency front, the U.S. dollar and Chinese yuan dominate. The ruble is volatile, the euro is stable, and the yen is strengthening as a safe haven asset.
Technology: The Engine of New Markets
The main trend in 2025 is AI and automation. Companies are deploying neural networks in logistics, marketing, finance, and HR to cut costs and boost efficiency. Demand for AI professionals and developers is surging.
5G infrastructure has matured in most developed countries, unlocking new potential in IoT, telemedicine, and remote work. At the same time, quantum computing is advancing rapidly, with commercial solutions expected by 2026.
Macromics Group invests in next-generation analytical platforms, enabling clients to access real-time insights and forecast trends before they go mainstream.
Energy and Sustainability: ESG and the “Green” Shift
Energy markets have stabilized after the turbulence of 2024. Oil prices remain between $70–$85 per barrel—comfortable for both producers and consumers. Meanwhile, renewable energy—solar, wind, and hydrogen—is seeing record investment.
Corporations are increasingly reporting according to ESG standards. It’s not just a trend, but a new business reality. Investors demand transparency, consumers prefer socially responsible brands, and regulators impose mandatory reporting.
Macromics Group supports clients in transitioning to sustainable models by developing ESG strategies, assessing risks, and offering financial solutions.
Conclusion: Outlook for the Second Half of 2025
The first half of 2025 showed that markets are learning to operate in a new reality. The global economy is no longer chasing rapid growth, but adapting to volatility. Key focus areas are technology, sustainability, and smart resource management.
For businesses, this means quick adaptation, innovative thinking, and reliance on data-driven decisions. In this context, Macromics Group serves not just as an analyst but as a strategic partner.
Our recommendation: act proactively. In times of uncertainty, those who plan years ahead and use quality data will win.

NZDUSD - LongWhen the market opens and the spreads die down. Will definitely be entering this trade to the upside.
We are still in a HTF bullish orderflow.
This is a great buy set up as we are at a very discounted price.
Lets see how It plays out

Potential long setup EURUSDTook almost two months for us to take April high well done for those who caught the move. This analysis will probably take a lot less time to play out.
Friday closed with an inside bar which means you would have to go onto lower timeframes to see which direction makes more sense to go.
I have not been given any reason fundamentally or technically to be bearish on the pair just yet so I will be targeting the high.
The daily FVG is a key area to look at and if it fails and we start making bearish FVGs that could be a sign that we will start getting a weekly or even a monthly pullback.
That's all I can say for now stay safe and flow with the markets.

Bitcoin is holding the 200 EMA on H4 despite everything...Despite war news and heavy sell volume, BTC held the 200 EMA on H4.
Low-volume weekend = low liquidity, yet bears still couldn’t break it.
🧠 Classic Effort vs. Result: big effort, weak result = hidden strength.
🎯 If it holds: $106.5K → $108.2K → $110K in play.
Structure intact. Bulls stealthily in control.

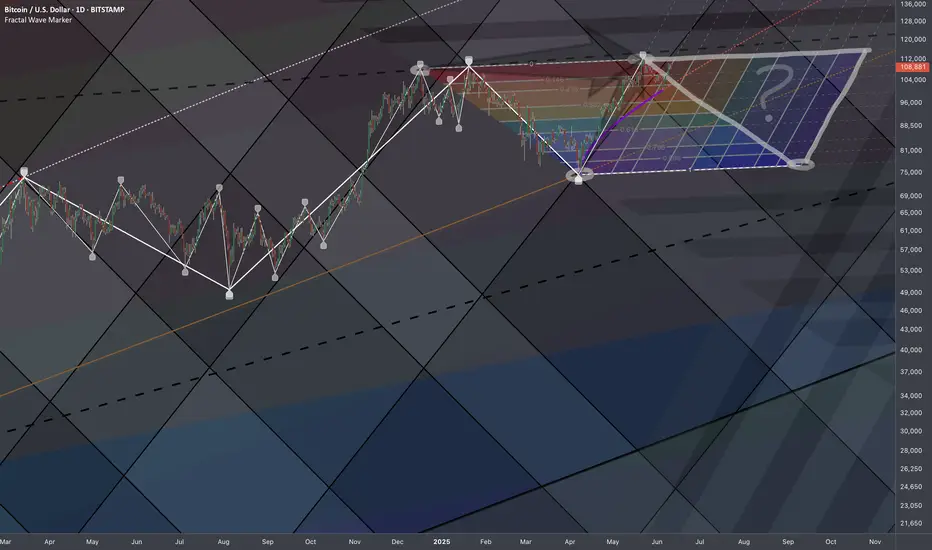
Bitcoin: Higher Degree Wave DimensionsA new long-term pattern has been identified. Essentially a stretched version of the chart shown here:
This resemblance holds to some extent, as the coordinates are anchored to relatively longer cycles:https://www.tradingview.com/x/PUxSDlLx/
Publishing this one in raw form (intentionally minimal) just to document a recurring structure across extended timeframes.


EURUSD, GBPUSD - Outlook for next weekEURUSD - So we have 2x 4 hour POI's (Points Of Interest). Will be looking at potential reversals at both POI's however, within the first POI we have an area of potential liquidity that could look to be taken before we make out move back to the upside.
Therefor, the second POI could look to be our more solid option for our buying options at some point next week.
GBPUSD - This pair looks to be building its liquidity now for potential trades to the upside as today on the lower TF's it was setting quite a few traps for the potential longs and the traders that would have been shorting the breaks below structure to the left.
If you have any questions for me please do let me know

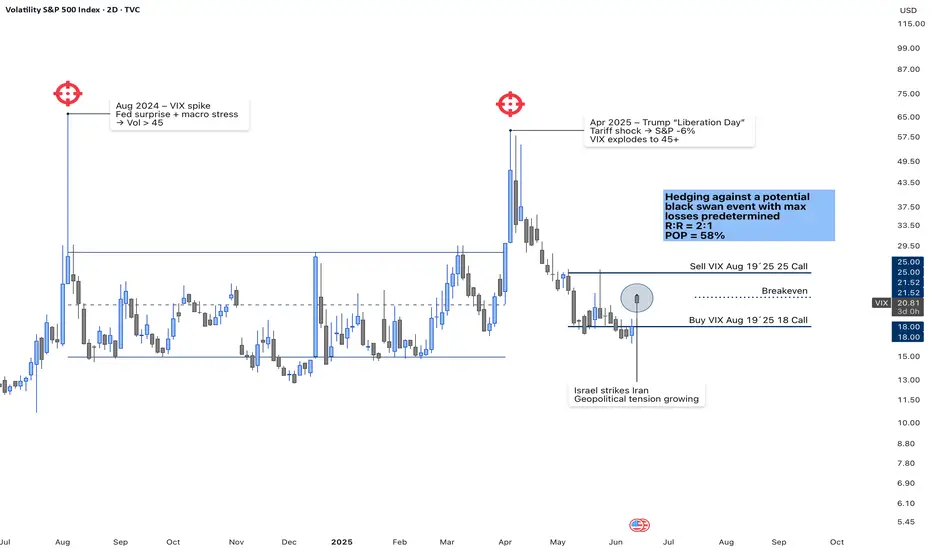
VIX Call Spread – Hedging Against Black Swan Risk (Aug ’25)📌 VIX Vertical Call Spread – Aug 19, 2025 (18/25)
Executed on June 13, 2025
Volatility has compressed near multi-month lows, but the chart shows two major spikes above 45 in less than a year — triggered by macro shocks (Fed surprises, Trump’s “Liberation Day” tariffs, geopolitical escalations like Israel–Iran).
I’m positioning with a long call spread on the VIX (Buy 18C / Sell 25C, exp. Aug 19), structured to hedge against a black swan while maintaining capital discipline.
• Risk/Reward: 2:1
• Probability of Profit (POP): ~58%
• Breakeven: ~21
• Defined risk / Defined reward
• No directional delta risk
I’m not forecasting volatility — I’m accepting that extreme events can (and do) happen. This spread pays off only if volatility spikes again above 21–22 in the next 60 days, which aligns with historical context.
🔒 No need to predict the trigger. Just manage exposure and define your risk upfront.
📈 Follow for more volatility and options setups based on structure + context.
Let’s stay ahead, not reactive.
ADBE: Fractal Pattern Repeating Again?ADBE has printed a surprisingly consistent technical pattern since 2023:
A rejection from supply, followed by a gap-down, then a gradual but deep decline.
We may now be witnessing the early stage of a fourth repeat.
📘 Historical Pattern
Zone 1: ~$575
• Gap: –5.71%
• Drop after gap: –12.11%
• Duration: 49 days
Zone 2: ~$551
• Gap: –8.85%
• Drop after gap: –18.55%
• Duration: 32 days
Zone 3: ~$458
• Gap: –6.71%
• Drop after gap: –18.21%
• Duration: 25 days
Zone 4: ~$425 (current)
• Gap: –2.53%
• Post-gap = in progress
🧠 All three prior moves began with a gap, followed by a small bounce, and then a larger sell-off.
Each of them dropped between –12% and –18% from the post-gap high.
🔍 Current Structure
• Price just rejected from ~$425 (1D supply)
• New gap-down of –2.53% has just occurred
• Currently sitting on critical DCS support zone: $382–$388
This is a high-stakes inflection area. A close below this support could trigger the next leg lower.
⚙️ Options Setup (Bearish Thesis)
💡 Trade Idea: Bear Put Spread (400 / 350, Jul 18 expiry)
• Defined risk with a 2.2:1 reward/risk ratio
• Breakeven ≈ $384
• Thesis becomes actionable if price breaks below the $382 DCS support
• Invalidation: strong reclaim of ~$425 supply
This setup targets a continuation of Adobe’s repeating structure.
It limits downside exposure while offering meaningful reward if breakdown confirms.
🙌 Found this helpful?
If this idea gave you value — a like 👍 or comment 💬 goes a long way!
Follow me for more structured trade setups based on price action + context.
Let’s grow with clarity, not noise. 📊💡

GOLD: Exponential Scaling 1.618^1/5Gold's natural growth patterns have apparent alignment Fibonacci progression.
Exponential Scaling using a constant phi (1.618) raised to 0.20 power exponent:
The lines follow historical movements with exponential accuracy, aiding the identification of swing points of major momentum shifts.
Major swings metrics:

EURUSD - Long from hereDue to having internal Breaks of Structure to the upside here I have entered a long position as it is a reasonable area to potentially get long as it is a strong area of demand.
I'm aware that there isn't much liquidity built up in and around this area before hitting the demand but its a risk im willing to take as price may just be filling the FVG from all the buying pressure that was in the market yesterday
Any questions please message

EURUSD - Current long positionVideo analysis of EURUSD
Hopefully we will get some bullish momentum however its not looking great

EURUSD, GBPUSD & EURGBP analysisHere's my outlook on the 3 pairs mentioned in the title. Looking for more upside momentum after we have some sort of pullback into the premium discount prices.
Once we get some15min bearish internal orderflow on the lower Time Frames I will look to enter short term sell positions before looking to take longer term buys on the way back up.
Again, if I can be of any assistance please do let me know and I will be happy to help where I can.

DOGS cryptocurrency analysis within the highlighted range.”According to the DOGS cryptocurrency chart, if the candle closes above the highlighted range, an upward trend can be expected. However, if it closes below the range, a further downward movement is likely.

SP500: Recursive Historic PatternAs a part of my research on fractal phenomena, I'm collecting recursive patterns directly to better understand the emerging structural landscape.
Documenting systemic behavior
Sharp drop
Distinctive growth cycle
Putting this out as current price is near all time high.

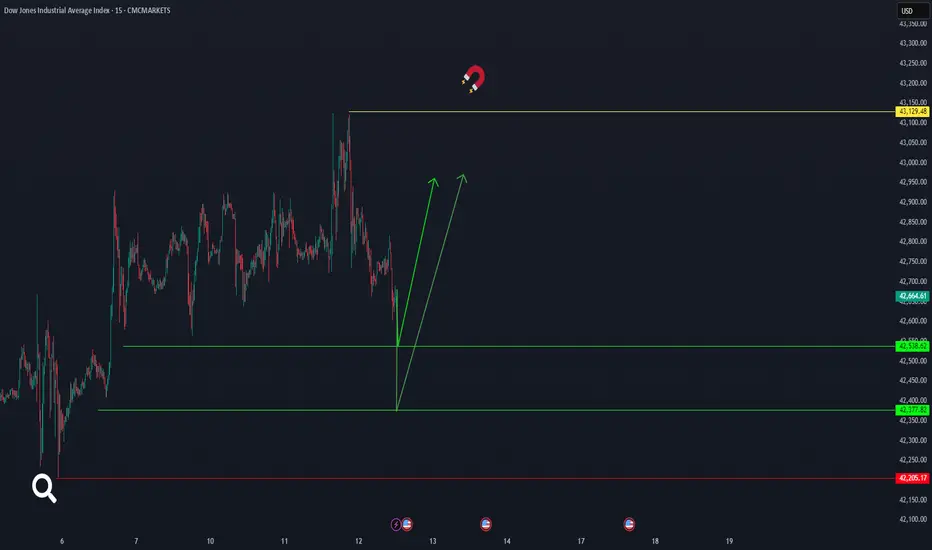
us30It seems that the Dow Jones will start moving again from the areas of 42377 or 42538 and the price will definitely reach 43129.48. Of course, the critical point is 42205. CMCMARKETS:US30
GBPUSD - Long after a structural shiftBased off of yesterdays analysis.
We can see we are fast approaching a very nice POI.
Will post below my mark up chart from yesterday so you can see below. Will now be sending most of my day on the 15min TF waiting for our structural shift to the upside.
Let's see how price plays out today.
Don't just dive into the trade. Wait for your structural shift first.
If I can offer any help please do let me know

GBPUSD - Long at some pointVery similar with what we are looking for in relation to EURUSD
Will wait for a mitigation of the demand at lower price. Will wait for an internal structure break before looking to get long.
Will have a nice sleep now and will re-evaluate in the morning.
Caught 2 lovely trades on this today and hopefully I may be able to catch 1 or 2 more before the week is out.
Again, if you have any questions don't be shy to get in touch

Bitcoin: Temporal ST FibsSo we have consecutive 2 rejections after registering Lower High on bigger scale..
Research Notes
Hypothetically, if it's about to fall based on similar flow of market reactions forming on top then this would be the closest fractal for bearish scenario.
Should be perceived as squeezed version of historic pattern. Not to scale on price axis solely, as increase in volatility can accelerate replication rate at places. The value is in temporal aspect like frequency of reversals.
To be sure I'd add a curve that describes current growth on smaller scale, and which could later on indicate a turning point.
Crossing under would confirm a scenario of bearish continuation.
Experiment
If we connect highs and map it to the local bottom, would the dimensions of original wave carry any structural significance?
Original Fib Channels (price oriented)
Temporal Fibs Sharing common coordinate to define them.
Yet to evaluate this approach for structural buildup. Fibs Channel lines are extended upwards in order to capture the reactions at any scenario.
EURUSD - Mark up for the rest of the weekAfter the CPI data was released today we had a lovely upside move. The move has caused us to trade into the previous weak higher timeframe high which I am hoping we can break and close above before the day is out.
I am now focusing on what kind of pullback we may get into out POI's. Because there is no buy side liquidity on the first POI I will need to see a structural shift on the 15min TF to confirm that internal structure swing to move back towards the upside.
If the 1st POI fails to hold I will be more aggressive with my secondary POI as that will be the premium discount price in order for us to move higher.
If that POI fails and we break the 4H structure swing then this could signal we are about to move lower.
If I can be of any assistance to anyone don't be shy to give me a message
