BTCUSD UPDATE 15-05-2025This chart shows the Bitcoin (BTC/USD) price action on the 1-hour timeframe, published on TradingView.
Key Details:
Chart Pattern: A distribution phase is visible, forming what appears to be a double or triple top pattern in a resistance zone (highlighted in yellow at the top), which typically signals potential reversal or bearish breakdown.
Current Price: Around $102,265, down by 1.22%.
Support and Resistance Zones:
Resistance: Around $105,600–$105,643
Support: Around $96,000–$97,322
Bearish Projection:
The blue arrow indicates a bearish move is expected, targeting the support zone near $96,000.
This suggests a short position setup, possibly expecting profit-taking at the support zone.
Price Ranges Marked:
Red and green shaded boxes indicate stop-loss and take-profit zones respectively, with risk-reward considerations.
This chart suggests a bearish sentiment in the short term, with the analyst expecting a decline to the lower yellow zone after multiple failed attempts to break resistance.
Let me know if you want technical indicators or further analysis.
Free-indicators

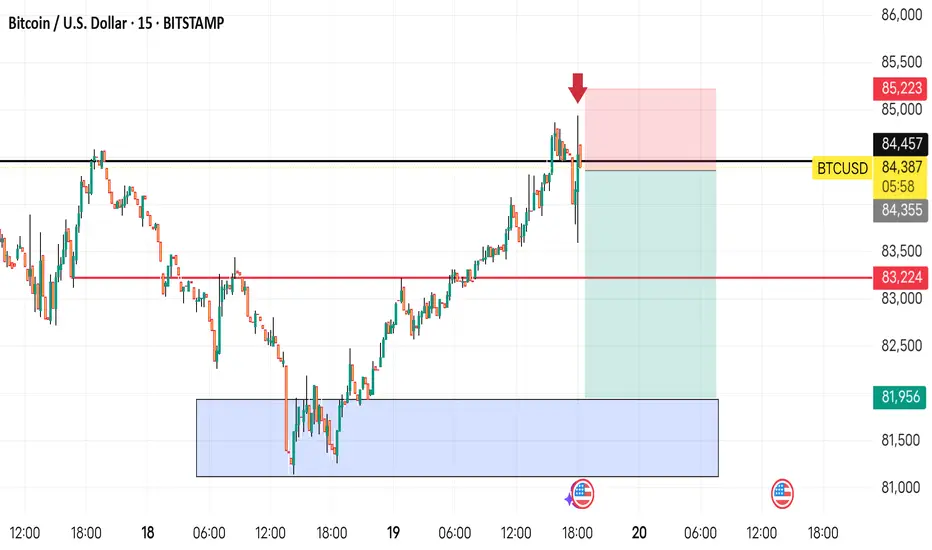
BTCUSD 15MINUTES. SHORT TRADE SETUP, CHECK CAPTAIN..This is a Bitcoin (BTC/USD) 15-minute chart from TradingView, showing a trade setup. Here’s what it means:
1. Resistance Level (Black Line at $84,355-$84,457): Price tested this zone but failed to break above it.
2. Short Trade Setup:
The red arrow indicates a sell entry at the resistance level.
The red box above represents the stop-loss area ($85,223), meaning if the price moves above this, the trade would be invalidated.
The green box below is the take-profit area, with a target around $81,956.
3. Price Rejection: BTC/USD attempted to break resistance but was rejected, suggesting a potential move lower.
4. Liquidity Zone (Blue Box): A previous demand zone where buyers stepped in, indicating a possible support level.
Overall, this chart suggests a bearish trade setup, where the trader expects Bitcoin to decline from the resistance zone.
YGGUSDT: Blooming from Support, Riding the Bullish Wave! 🚀🌺Introduction: 🌐 Get ready for a vibrant ride in the crypto garden with YGGUSDT! Traders are diving into a long position from $0.386, as the asset bounces off a support zone. Let's explore the blossoming details of this bullish trade.
Trade Details: 💰 The long position (#YGGUSDT) blooms from $0.386, with a stop-loss set at $0.344. The rationale behind this move lies in the asset's rebound from a support zone, with expectations of a buyer's reaction.
Technical Analysis: 📊 On the 1-hour timeframe, YGGUSDT has gracefully bounced from a support zone, creating a scenario where the trader eagerly awaits a buyer's reaction. With increasing volumes in the order book, the anticipation is high for a breakout and subsequent movement towards a test or crossover, leading to a journey into the liquidity zone.
Expectations and Strategy: 🎯 The plan unfolds with entering the position at the current price or at $0.386. With the potential for one averaging down at the trader's discretion, it's a bullish cross into promising territory.
Trade Target: 🚀 The trader anticipates a breakout and subsequent movement towards testing or crossing over, riding the bullish wave with the aim of reaching liquidity zones.
Conclusion: 🌺 YGGUSDT offers a blossoming opportunity to ride the bullish wave. Traders, gear up for a colorful journey into potential profits as you navigate the vibrant crypto garden! 🚀🌈

NZDCHF SHORTA breakout to the downside with confirmation on the MA Cross and sentiment change. TDI Baseline starting to decrease from an over bought position. Also looking like a double top on H1.
