CADJPY: Intraday Bearish Reversal?! 🇨🇦🇯🇵
There is a high chance that CADJPY will retraced from the
underlined blue resistance.
I see strong bearish confirmation on an hourly time frame:
a formation of a bearish imbalance and a change of character.
I expect a bearish move to 105.05
❤️Please, support my work with like, thank you!❤️
I am part of Trade Nation's Influencer program and receive a monthly fee for using their TradingView charts in my analysis.
Freeforexsignals
AUDCAD: Bearish Move From Resistance 🇦🇺🇨🇦
There is a high chance that AUDCAD will retrace from the intraday resistance.
A bearish movement after an extended consolidation on an hourly time frame
provides a reliable bearish signal.
I expect a down movement at least to 0.901
❤️Please, support my work with like, thank you!❤️
I am part of Trade Nation's Influencer program and receive a monthly fee for using their TradingView charts in my analysis.
GBPJPY: Pullback From Resistance 🇬🇧🇯🇵
There is a high chance that GBPJPY will retrace from the underlined
resistance zone.
A formation of a bearish engulfing candle indicates a strong
bearish pressure.
With a high probability, the price will drop to 194.0 level.
❤️Please, support my work with like, thank you!❤️
I am part of Trade Nation's Influencer program and receive a monthly fee for using their TradingView charts in my analysis.
CADCHF: Very Bearish Candlestick 🇨🇦🇨🇭
CADCHF formed the insidebar pattern after a test of a strong resistance cluster.
Bearish breakout of its range is a strong intraday bearish signal.
I expect a retracement from the underlined area at least to 0.514 level.
❤️Please, support my work with like, thank you!❤️
I am part of Trade Nation's Influencer program and receive a monthly fee for using their TradingView charts in my analysis.
NZDJPY: Time For Pullback 🇳🇿🇯🇵
I see a nice opportunity to buy NZDJPY after a test of a key daily support.
As a confirmation, I spotted the insidebar pattern with a breakout
of the upper boundary of its range.
I expect a bullish movement at least to 85.75
❤️Please, support my work with like, thank you!❤️
I am part of Trade Nation's Influencer program and receive a monthly fee for using their TradingView charts in my analysis.
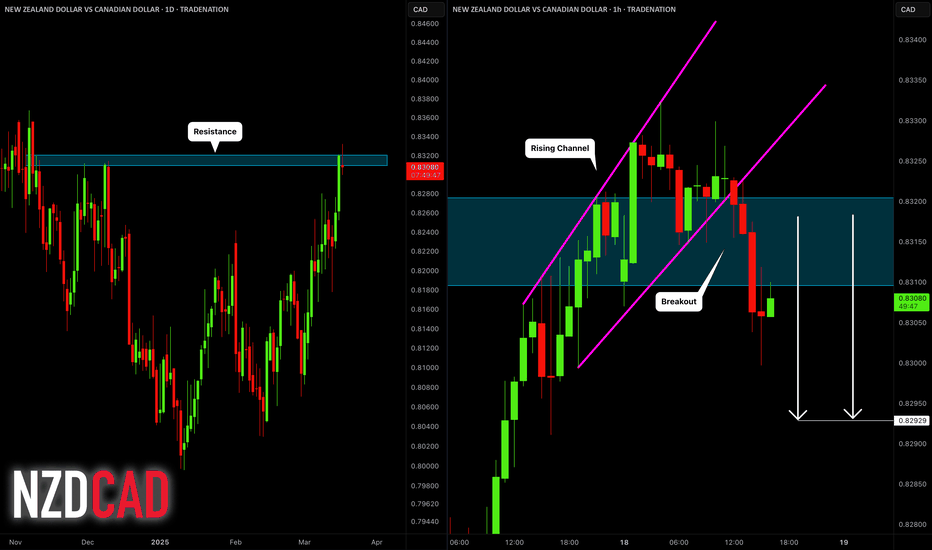
NZDCAD: Bearish After the News?! 🇳🇿🇨🇦
NZDCAD turned bearish after a release of Canadian Inflation data.
The price retraced from a key daily resistance and broke
a support line of a rising parallel channel on an hourly time frame.
The market may drop at least to 0.8293
❤️Please, support my work with like, thank you!❤️
I am part of Trade Nation's Influencer program and receive a monthly fee for using their TradingView charts in my analysis.
AUD_NZD LONG SIGNAL|
✅AUD_NZD is going down to retest
A strong horizontal support of 1.0947
And the pair is clearly oversold
So after the price hits the support
We can go long on the pair expecting
A bullish correction with the
Take Profit of 1.0965 and
Stop Loss of 1.0939
LONG🚀
✅Like and subscribe to never miss a new idea!✅
Disclosure: I am part of Trade Nation's Influencer program and receive a monthly fee for using their TradingView charts in my analysis.
NZDCAD: Strong Bullish Signals 🇳🇿🇨🇦
I see 2 strong price action confirmations on NZDCAD:
the price broke a resistance line of a bullish flag
and then formed a confirmed change of character CHoCH on a 4H.
I think that the market will continue a bullish rally.
Next resistance - 0.83
❤️Please, support my work with like, thank you!❤️
I am part of Trade Nation's Influencer program and receive a monthly fee for using their TradingView charts in my analysis.
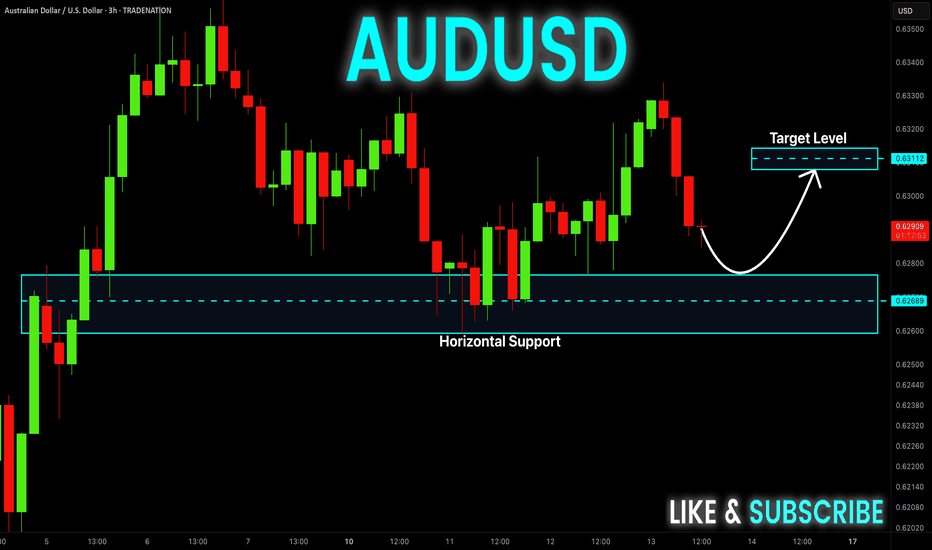
AUD-USD Support Ahead! Buy!
Hello,Traders!
AUD-USD is going down
And will soon retest a
Horizontal demand level
Of 0.6260 from where we
Will be expecting a local
Rebound and a move up
Buy!
Comment and subscribe to help us grow!
Check out other forecasts below too!
Disclosure: I am part of Trade Nation's Influencer program and receive a monthly fee for using their TradingView charts in my analysis.
EURCHF: Correctional Movement Started 🇪🇺🇨🇭
EURCHF started a correctional movement after a test of a key daily resistance.
Inverted cup & handle pattern on an hourly time frame on that
provides a strong intraday bearish confirmation.
We can expect a bearish continuation at least to 0.96 today.
❤️Please, support my work with like, thank you!❤️
GBPCHF: Pullback From Support 🇬🇧🇨🇭
There is a high chance that GBPCHF will pullback from the
underlined blue intraday support.
As a confirmation, I see a cup and handle pattern on that
and a breakout of its neckline.
Goal - 1.1367
❤️Please, support my work with like, thank you!❤️
I am part of Trade Nation's Influencer program and receive a monthly fee for using their TradingView charts in my analysis.
GBPCAD: One More Wave Ahead?! 🇬🇧🇨🇦
GBPCAD is positioned to continue rising to new highs.
A bullish breakout of a neckline of the ascending triangle
pattern on a 4H time frame provides a strong trend-following bullish signal.
With a high probability, the price will reach 1.868 level soon.
❤️Please, support my work with like, thank you!❤️
I am part of Trade Nation's Influencer program and receive a monthly fee for using their TradingView charts in my analysis.
EURCHF: Rise After the News 🇪🇺🇨🇭
Looks like EURCHF may continue growing after the release of US news today.
A breakout of the resistance of the range on an hourly time frame
provides a strong technical confirmation.
Goal - 0.959
❤️Please, support my work with like, thank you!❤️
I am part of Trade Nation's Influencer program and receive a monthly fee for using their TradingView charts in my analysis.
EURJPY: Bullish Move From Support 🇪🇺🇯🇵
EURJPY looks bullish after a completion
of a consolidation on a key daily/intraday support.
A formation of a bullish imbalance candle provides a strong bullish confirmation.
I think that the price will go up and hit at least 160.33 level.
❤️Please, support my work with like, thank you!❤️
EURGBP: Bearish Chart Pattern?! 🇪🇺🇬🇧
EURGBP broke a support line of a symmetrical triangle pattern
after a test of key daily resistance.
I think that the pair may retrace at least to 0.836
❤️Please, support my work with like, thank you!❤️
I am part of Trade Nation's Influencer program and receive a monthly fee for using their TradingView charts in my analysis.
NZDCAD: Bearish Triangle 🇳🇿🇨🇦
I see a descending triangle pattern on NZDCAD after a test of key resistance.
Its neckline breakout is a strong intraday bearish signal.
Goal - 0.8103
❤️Please, support my work with like, thank you!❤️
I am part of Trade Nation's Influencer program and receive a monthly fee for using their TradingView charts in my analysis.
EURJPY: Gap is Going to Close 🇪🇺🇯🇵
There is a nice gap up opening on EURJPY.
The formation of a bearish engulfing candle
after a test of the underlined resistance indicates
that the gap is going to be filled soon.
Goal - 156.3
❤️Please, support my work with like, thank you!❤️
I am part of Trade Nation's Influencer program and receive a monthly fee for using their TradingView charts in my analysis.


