GBPCAD At Support - High probability reversalGBPCAD descended with strength, and has now reached a strong support zone.
Price now hovers above and this zone and is a great indication to use for possible reversal move, that could send price into the 1.86100 level.
But if price breaks below support with momentum, then I’ll back off this bullish bias and reassess, and consider the reversal idea invalidated, with potential for further downside.
Just sharing my thoughts for the charts, this isn’t financial advice. Always confirm your setups and manage your risk properly.
Disclosure: I am part of Trade Nation's Influencer program and receive a monthly fee for using their TradingView charts in my analysis.
Freesignals

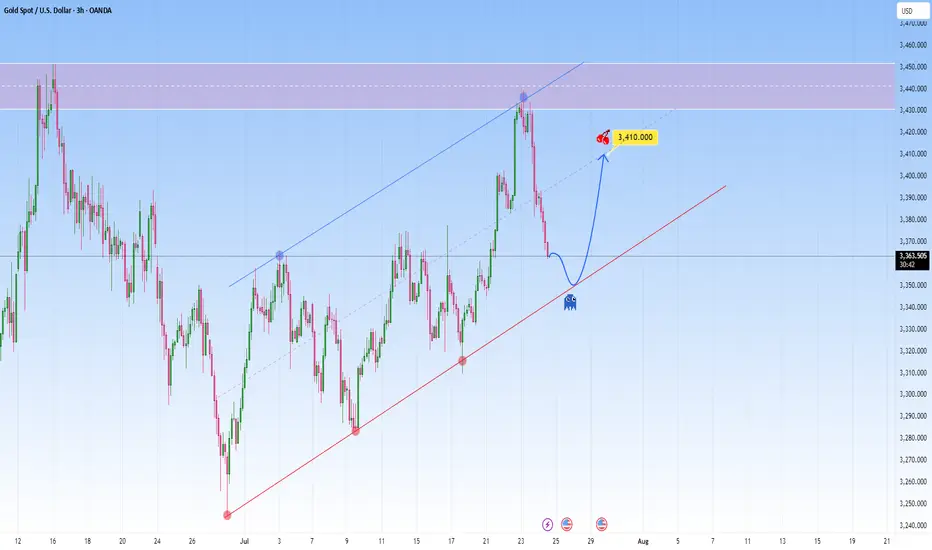
GOLD Reawakened: Corrects firmly but conditions remain bullishFrom a technical perspective Gold is climbing in a parallel channel, clearly bullish with a rhythm that’s hard to ignore. Price just bounced off the resistance with force, a classic overextension flush.
And the market is now approaching the lower boundary of this projected channel. This confluence of technical support is likely to attract renewed buying interest.
I expect it to bounce back toward 3,410, somewhere around the middle of the channel. The move up may not be determined right away. It could be consolitaing, fake dips first, or sudden acceleration.
GBPAUD: Possible bounce at supportI am watching for a possible reversal GBPAUD, expecting a rejection with a upside target at around 2.073.
This area is where it can become a decision point, either price finds support and bounces, or it breaks below, and the move can start to extend lower.
Just sharing my thoughts for the charts, this isn’t financial advice. Always confirm your setups and manage your risk properly.
Disclosure: I am part of Trade Nation's Influencer program and receive a monthly fee for using their TradingView charts in my analysis.

XAUUSD – Weak recovery, selling pressure still dominatesHello everyone! What do you think – is it time to buy or sell gold?
After clearly breaking the ascending trendline late last week, gold made a slight rebound from the 3,325 zone. However, in my view, this bounce was relatively weak and mostly technical in nature.
Currently, price is retesting a key confluence area around 3,345–3,355, which includes the previous trendline and a nearby resistance zone.
If we see a clear rejection candle form at this level, there's a high chance the price may reverse and continue its downward trend. The short-term target I’m watching is 3,300 USD – and if that level doesn’t hold, we could see stronger reactions near 3,283.
According to the VRVP indicator, volume is concentrated around lower price levels, suggesting that liquidity is still sitting near previous lows. Structurally, the market continues to form lower highs and lower lows, and with the EMA sloping downward, my primary bias remains to SELL on rallies within the trend.

GBPUSD – DAILY FORECAST Q3 | W31 | D29 | Y25📊 GBPUSD – DAILY FORECAST
Q3 | W31 | D29 | Y25
Daily Forecast 🔍📅
Here’s a short diagnosis of the current chart setup 🧠📈
Higher time frame order blocks have been identified — these are our patient points of interest 🎯🧭.
It’s crucial to wait for a confirmed break of structure 🧱✅ before forming a directional bias.
This keeps us disciplined and aligned with what price action is truly telling us.
📈 Risk Management Protocols
🔑 Core principles:
Max 1% risk per trade
Only execute at pre-identified levels
Use alerts, not emotion
Stick to your RR plan — minimum 1:2
🧠 You’re not paid for how many trades you take, you’re paid for how well you manage risk.
🧠 Weekly FRGNT Insight
"Trade what the market gives, not what your ego wants."
Stay mechanical. Stay focused. Let the probabilities work.
FX:GBPUSD

AUDUSD – DAILY FORECAST Q3 | W31 | D28 | Y25AUDUSD – DAILY FORECAST
Q3 | W31 | D28 | Y25
Daily Forecast 🔍📅
Here’s a short diagnosis of the current chart setup 🧠📈
Higher time frame order blocks have been identified — these are our patient points of interest 🎯🧭.
It’s crucial to wait for a confirmed break of structure 🧱✅ before forming a directional bias.
This keeps us disciplined and aligned with what price action is truly telling us.
📈 Risk Management Protocols
🔑 Core principles:
Max 1% risk per trade
Only execute at pre-identified levels
Use alerts, not emotion
Stick to your RR plan — minimum 1:2
🧠 You’re not paid for how many trades you take, you’re paid for how well you manage risk.
🧠 Weekly FRGNT Insight
"Trade what the market gives, not what your ego wants."
Stay mechanical. Stay focused. Let the probabilities work.
FX:AUDUSD

USDJPY – DAILY FORECAST Q3 | W31 | D29 | Y25📊 USDJPY – DAILY FORECAST
Q3 | W31 | D29 | Y25
Daily Forecast 🔍📅
Here’s a short diagnosis of the current chart setup 🧠📈
Higher time frame order blocks have been identified — these are our patient points of interest 🎯🧭.
It’s crucial to wait for a confirmed break of structure 🧱✅ before forming a directional bias.
This keeps us disciplined and aligned with what price action is truly telling us.
📈 Risk Management Protocols
🔑 Core principles:
Max 1% risk per trade
Only execute at pre-identified levels
Use alerts, not emotion
Stick to your RR plan — minimum 1:2
🧠 You’re not paid for how many trades you take, you’re paid for how well you manage risk.
🧠 Weekly FRGNT Insight
"Trade what the market gives, not what your ego wants."
Stay mechanical. Stay focused. Let the probabilities work.
OANDA:USDJPY

GBPUSD – DAILY FORECAST Q3 | W31 | D28 | Y25📊 GBPUSD – DAILY FORECAST
Q3 | W31 | D28 | Y25
Daily Forecast 🔍📅
Here’s a short diagnosis of the current chart setup 🧠📈
Higher time frame order blocks have been identified — these are our patient points of interest 🎯🧭.
It’s crucial to wait for a confirmed break of structure 🧱✅ before forming a directional bias.
This keeps us disciplined and aligned with what price action is truly telling us.
📈 Risk Management Protocols
🔑 Core principles:
Max 1% risk per trade
Only execute at pre-identified levels
Use alerts, not emotion
Stick to your RR plan — minimum 1:2
🧠 You’re not paid for how many trades you take, you’re paid for how well you manage risk.
🧠 Weekly FRGNT Insight
"Trade what the market gives, not what your ego wants."
Stay mechanical. Stay focused. Let the probabilities work.
FX:GBPUSD

USDJPY– DAILY FORECAST Q3 | W31 | D28 | Y25📊 USDJPY– DAILY FORECAST
Q3 | W31 | D28 | Y25
Daily Forecast 🔍📅
Here’s a short diagnosis of the current chart setup 🧠📈
Higher time frame order blocks have been identified — these are our patient points of interest 🎯🧭.
It’s crucial to wait for a confirmed break of structure 🧱✅ before forming a directional bias.
This keeps us disciplined and aligned with what price action is truly telling us.
📈 Risk Management Protocols
🔑 Core principles:
Max 1% risk per trade
Only execute at pre-identified levels
Use alerts, not emotion
Stick to your RR plan — minimum 1:2
🧠 You’re not paid for how many trades you take, you’re paid for how well you manage risk.
🧠 Weekly FRGNT Insight
"Trade what the market gives, not what your ego wants."
Stay mechanical. Stay focused. Let the probabilities work.
FX:USDJPY

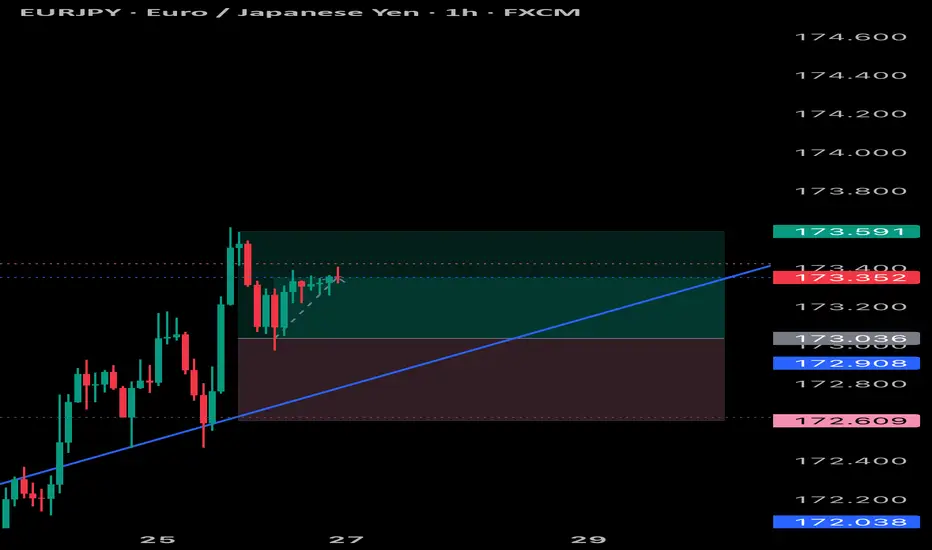
EURJPY – DAILY FORECAST Q3 | W31 | D29 | Y25📊 EURJPY – DAILY FORECAST
Q3 | W31 | D29 | Y25
Daily Forecast 🔍📅
Here’s a short diagnosis of the current chart setup 🧠📈
Higher time frame order blocks have been identified — these are our patient points of interest 🎯🧭.
It’s crucial to wait for a confirmed break of structure 🧱✅ before forming a directional bias.
This keeps us disciplined and aligned with what price action is truly telling us.
📈 Risk Management Protocols
🔑 Core principles:
Max 1% risk per trade
Only execute at pre-identified levels
Use alerts, not emotion
Stick to your RR plan — minimum 1:2
🧠 You’re not paid for how many trades you take, you’re paid for how well you manage risk.
🧠 Weekly FRGNT Insight
"Trade what the market gives, not what your ego wants."
Stay mechanical. Stay focused. Let the probabilities work.
OANDA:EURJPY

AUDCAD – DAILY FORECAST Q3 | W31 | D28 | Y25📊 AUDCAD – DAILY FORECAST
Q3 | W31 | D28 | Y25
Daily Forecast 🔍📅
Here’s a short diagnosis of the current chart setup 🧠📈
Higher time frame order blocks have been identified — these are our patient points of interest 🎯🧭.
It’s crucial to wait for a confirmed break of structure 🧱✅ before forming a directional bias.
This keeps us disciplined and aligned with what price action is truly telling us.
📈 Risk Management Protocols
🔑 Core principles:
Max 1% risk per trade
Only execute at pre-identified levels
Use alerts, not emotion
Stick to your RR plan — minimum 1:2
🧠 You’re not paid for how many trades you take, you’re paid for how well you manage risk.
🧠 Weekly FRGNT Insight
"Trade what the market gives, not what your ego wants."
Stay mechanical. Stay focused. Let the probabilities work.
FX:AUDCAD

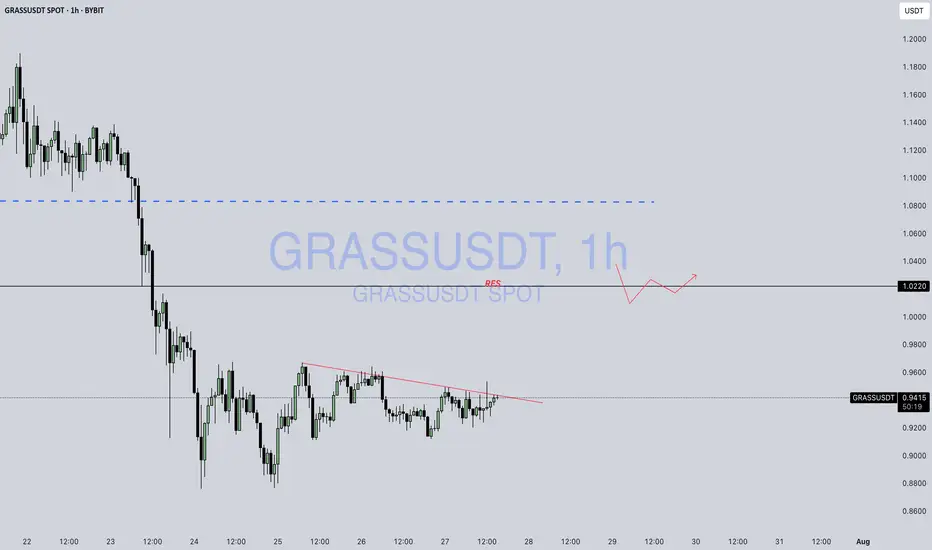
GRASS / USDTBYBIT:GRASSUSDT
Something’s cooking in GRASS coin… 🌱🔥
Be careful — big moves might be brewing. 👀📈
I mention guess it and enjoy the trade...
⚠️ Disclaimer: Not financial advice. Just market observation.
XAUUSD: Bearish Bias SetupI am watching for a possible reversal in XAUUSD, predicting a rejection with a downside target around 3.300.
This downside target is reasonable based on this setup, as it is based on a previous bullish move, from which price could find support and bounce, or break below, and the downside momentum could start to continue down.
I am just sharing my thoughts on the chart, this is not financial advice. Always confirm your setup and manage your risk accordingly.

AUDCAD – WEEKLY FORECAST Q3 | W31 | Y25📊 AUDCAD – WEEKLY FORECAST
Q3 | W30 | Y25
Weekly Forecast 🔍📅
Here’s a short diagnosis of the current chart setup 🧠📈
Higher time frame order blocks have been identified — these are our patient points of interest 🎯🧭.
It’s crucial to wait for a confirmed break of structure 🧱✅ before forming a directional bias.
This keeps us disciplined and aligned with what price action is truly telling us.
📈 Risk Management Protocols
🔑 Core principles:
Max 1% risk per trade
Only execute at pre-identified levels
Use alerts, not emotion
Stick to your RR plan — minimum 1:2
🧠 You’re not paid for how many trades you take, you’re paid for how well you manage risk.
🧠 Weekly FRGNT Insight
"Trade what the market gives, not what your ego wants."
Stay mechanical. Stay focused. Let the probabilities work.
FX:AUDCAD

EURJPY – WEEKLY FORECAST Q3 | W31 | Y25📊 EURJPY – WEEKLY FORECAST
Q3 | W31 | Y25
Weekly Forecast 🔍📅
Here’s a short diagnosis of the current chart setup 🧠📈
Higher time frame order blocks have been identified — these are our patient points of interest 🎯🧭.
It’s crucial to wait for a confirmed break of structure 🧱✅ before forming a directional bias.
This keeps us disciplined and aligned with what price action is truly telling us.
📈 Risk Management Protocols
🔑 Core principles:
Max 1% risk per trade
Only execute at pre-identified levels
Use alerts, not emotion
Stick to your RR plan — minimum 1:2
🧠 You’re not paid for how many trades you take, you’re paid for how well you manage risk.
🧠 Weekly FRGNT Insight
"Trade what the market gives, not what your ego wants."
Stay mechanical. Stay focused. Let the probabilities work.
OANDA:EURJPY

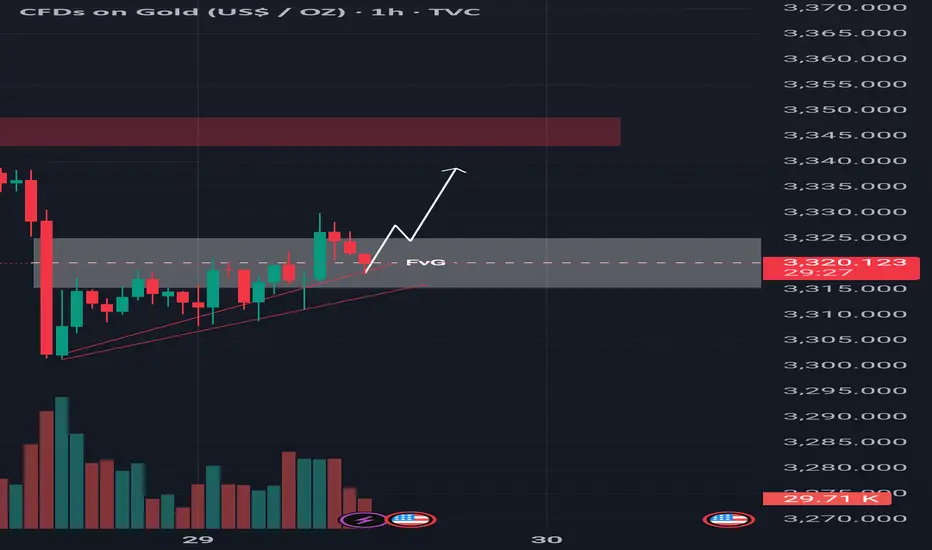
Technical Shift FVG Break and Retest Hints at Further Upside!Gold is currently showing strength after taking support from the trendline, indicating buyers are stepping in around that level. Moreover the price has successfully broken above the 4-hour bearish Fair Value Gap (FVG), which suggests a shift in market sentiment. This FVG zone has now transitioned into an inversion level meaning what was once a resistance area could now act as support. At the moment, the market is pulling back, likely to retest this newly flipped zone. If buyers defend this area on the retest, it could provide the base for a potential bullish continuation. From this zone, we may witness a strong upward move, with the next target likely being the liquidity resting above key resistance levels. As always, it’s important to conduct your own analysis and manage risk accordingly (DYOR).
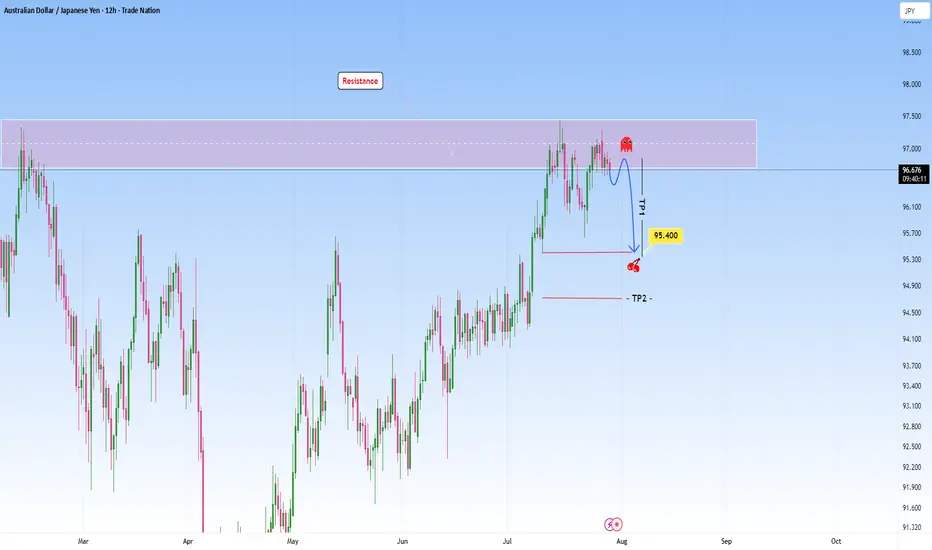
AUDJPY at Resistance: Could we see a reversal here?The market on this pair shows us a classic scenario where price presses into a resistance zone after a sustained bullish move. Price action approaching this zone appears hesitant, with smaller candles and wicks showing signs of exhaustion, meaning the possibility that buying momentum is weakening. There is a clear intention in this structure and I am anticipating a reversal here.
My first target (TP1) at 95.400 is placed just above a previous structure low and it’s a logical level for a partial exit, as price may pause or react there. The second target (TP2), placed even lower, hints at a full mean reversion idea targeting the origin of the previous bullish leg.
The setup requires patience, waiting for confirmation perhaps in the form of a strong bearish rejection before committing to the short. Overall, it’s a disciplined setup that mirrors the kind of analysis I like to gravitate toward: structured, simple and driven by high probability reversal zones.
Disclosure: I am part of Trade Nation's Influencer program and receive a monthly fee for using their TradingView charts in my analysis.
EURUSD – DAILY FORECAST Q3 | W31 | D29 | Y25📊 EURUSD – DAILY FORECAST
Q3 | W31 | D29 | Y25
Daily Forecast 🔍📅
Here’s a short diagnosis of the current chart setup 🧠📈
Higher time frame order blocks have been identified — these are our patient points of interest 🎯🧭.
It’s crucial to wait for a confirmed break of structure 🧱✅ before forming a directional bias.
This keeps us disciplined and aligned with what price action is truly telling us.
📈 Risk Management Protocols
🔑 Core principles:
Max 1% risk per trade
Only execute at pre-identified levels
Use alerts, not emotion
Stick to your RR plan — minimum 1:2
🧠 You’re not paid for how many trades you take, you’re paid for how well you manage risk.
🧠 Weekly FRGNT Insight
"Trade what the market gives, not what your ego wants."
Stay mechanical. Stay focused. Let the probabilities work.
FX:EURUSD

Trendline broken - Can XAUUSD hold the line or fall to new lows?Hello all dear traders, what do you think about XAUUSD?
Technically, XAUUSD has broken the important uptrend line, marking the end of the short-term bullish structure. After the breakout, the price has recovered slightly with the next expectation seemingly being a strong rejection, indicating that selling pressure may be returning.
Today, the US will release a lot of economic data, including the trade balance of goods. If the data is positive, it will cause the gold price to continue to fall further.
What do you think? Share your opinion in the comments!

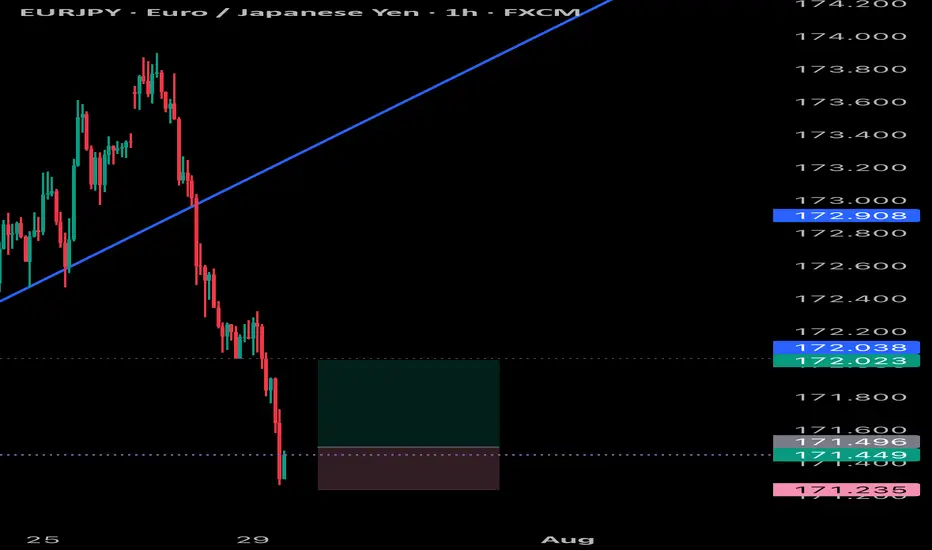
EURJPY SCALP Eurjpy quick scalp trade as it can still drop so it would be wise to not target higher than normal take profits , but will scalp it
C / UsdtBINANCE:CUSDT
### **📊 Chart Overview – CUSDT (1H):**
* **Current Price:** \$0.3225
* **Recent Trend:** Price is consolidating below a **descending trendline (red)** after a sharp decline from \$0.44–\$0.45.
* **Key Levels:**
* **Support:** \$0.31 – \$0.32 (highlighted zone).
* **Resistance:** \$0.34 – \$0.35 (trendline breakout needed).
* **Major Resistance:** \$0.4456.
---
### **🔍 Technical Breakdown:**
1. **Downtrend Continuation:**
* Price is still below the **red descending trendline**, which acts as dynamic resistance.
* As long as it stays below \$0.34, the bears remain in control.
2. **Bullish Scenario:**
* A **clear breakout above \$0.34** with strong volume could lead to a push toward **\$0.37 – \$0.40**.
3. **Bearish Scenario:**
* Failure to hold **\$0.31 – \$0.32 support** could open doors to a drop towards **\$0.30 or even \$0.28**.
---
### **📌 Summary:**
CUSDT is in a **critical consolidation zone**. Watch the **\$0.32 support** and **\$0.34 resistance** closely — a breakout or breakdown could decide the next move.
---
⚠️ **Disclaimer:**
*This analysis is for educational purposes only, not financial advice. Always do your own research and trade carefully.*

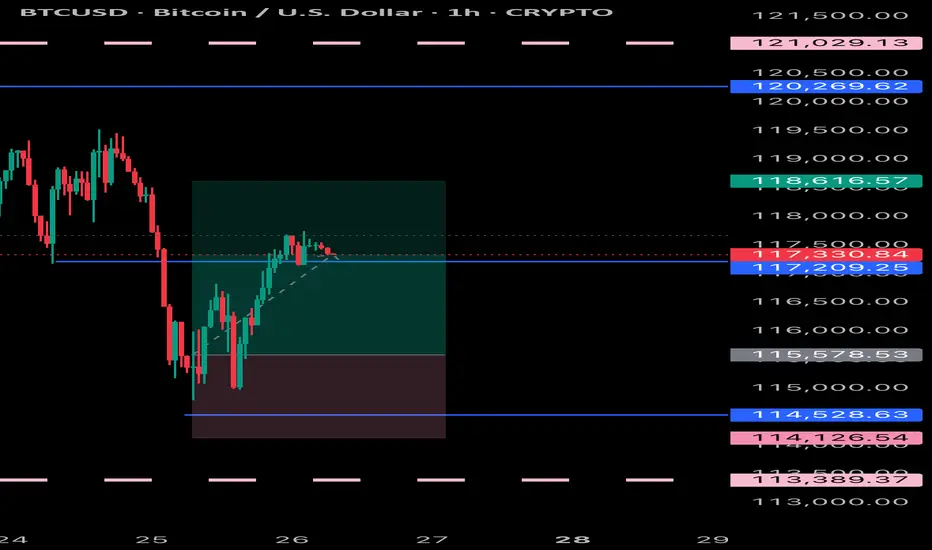
BITCOIN RESULTS Bitcoin has respected the analysis and held very well it’s been following the trend and can partial close some positions and wait for a nice pullback to buy the dip
EURJPY LOOKING GOOD Eurjpy has been behaving as expected and can continue to the up side and complete its pattern