BITCOIN BUY LIMIT Hello friends
If you are a risk taker, this position is for you...
Given the price growth, we expect a correction, so in the pullback we have identified important points to buy with capital and risk management and move towards the specified goals.
*Trade safely with us*
Freesignals

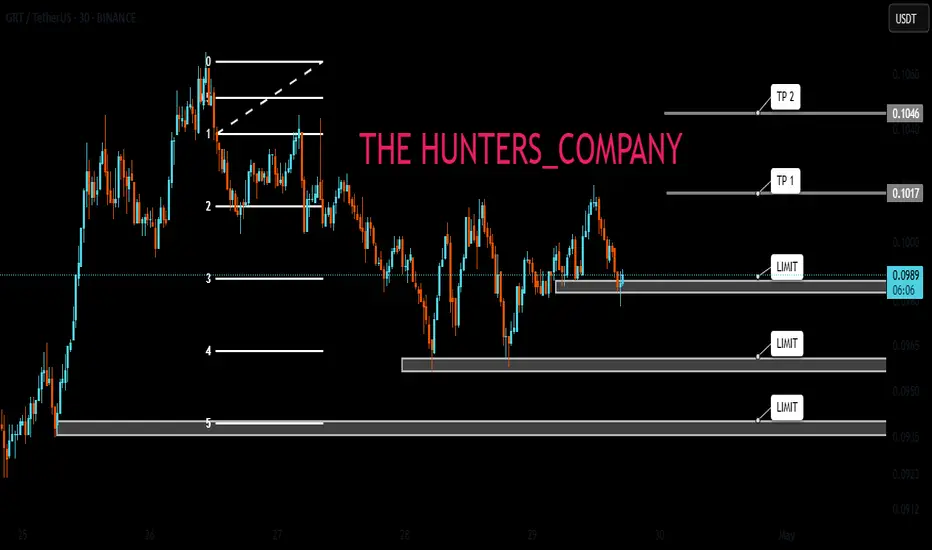
LITCOIN SIGNALSHello dears
You see that after a good growth, the price was in a range and then we had a decline until the support area was identified, which is also a good area and it was able to record a new ceiling, which is a good sign. Now the best and least risky thing is to buy steps.
We have identified the buying steps for you and the targets...
Note that this analysis is in daily time and may take a while, so if you are not patient, do not enter.
*Trade safely with us*

Gold 8H – Probable Scenario Until the End of May 2025Briefly today!
Greetings, let’s take a look at the current situation for gold.
Technically, we can see a classic symmetrical triangle forming on the 8-hour chart, with a support zone established in the 3291–3300 range.
I'm expecting a move towards the 3440–3450 area, followed by a retest and an upward push toward the 3833 level.
Fundamentally, we take into account Trump's policy stance and the ongoing conflict between Pakistan and India.

Stromm | BITCOIN Are You BULLISH Enough? When you zoom out to the 12-hour chart , Bitcoin actually looks really clean right now. Since my entry at $75,800, we’ve seen a solid 25% rally that’s clearly shifted the momentum back to bullish. -
But even with that move, I’m not fully convinced yet that we’re on our way straight to a new all-time high.
There’s still a lot of work to be done before that happens.
Right now, I’m watching the zone between $96,400 and $102,300 as a potential reaction area — basically a spot where we could see Wave B complete.
We’re hovering around the Yearly Open, which historically acts as both strong support and resistance, and we’re also right at the Previous Monthly High.
If BTC can hold this zone, we absolutely could push higher toward $102K.
However, I don’t think it’s realistic yet to expect a clean shot to $110K without a deeper pullback first.
Most likely, we’ll need another flush lower to reset before any major breakout.
That said, I’m still long and staying patient.
If we do somehow rip toward $120K, I’m already well-positioned.
And if we get another sell-off?
I’ll be adding even more — no hesitation there.
Of course, a lot of this depends on how the political and macro situation evolves.
There’s definitely a world where the perfect narrative gets laid down, and we rocket to $120K.
But there’s also a world where that doesn't happen — and it’s important to stay mentally flexible between "must happen," "could happen," and "might not happen at all."

Bitcoin: Blood in the Streets – Now is the Time!Once again, there’s blood in the streets—and from this point on I start scaling into spot positions again, slowly but deliberately.
All of these are spot entries with soft stop-losses—not hard exits, but areas I’ll react to if needed.
So why now? For one, we’re sitting right above the 38,2% Fibonacci level for the ending of the wave A. At the same time, we’re about to tap into a daily Fair Value Gap, while trying to hold the range support—two important technical levels lining up on the higher time frame.
Below that, we have an untapped VWAP at $65.5K, which could act as a magnet, as it often does. And yeah—if we go under $62K or even $60K, the classic “time to work at McDonald’s” joke comes back. But seriously: in markets like this, you need to stay calm, have some humor, and most of all, know what’s possible.
So I’m cautiously watching the S&P 500 closely, which plays a big role in this setup for me.
That’s where I stand on BTC right now—careful optimism, grounded in context and reasoning for me.

BNB BUY LIMIT Hello friends
Due to the entry of buyers and the registration of higher ceilings and floors, we can buy in the direction of the trend and with capital and risk management within the specified ranges and move to the specified targets.
*Trade safely with us*

BTC LIMITHello friends
Due to the price drop, we can buy in the price drop and move with it to the specified targets, of course with capital and risk management.
*Trade safely with us*

BUY MARKET!!!Hello dears
If you are risk-averse, this analysis is for you...
Given the decline we had, you can see that the price was supported within the specified support range and a range was formed that can be purchased with risk and capital management and moved to the specified ranges...
*Trade safely with us*

PEPE BUY ...Hello friends
Due to the price drop, good conditions have been created to buy with risk and capital management and move towards the specified goals...
If you are risk-averse, this signal is for you...
*Trade safely with us*

SOL LIVE TRADEHello dears
Given the price support by buyers and the formation of higher ceilings and floors, we can open a trade with risk and capital management.
*Trade safely with us*

WHAT DO YOU THINK ?Hello dears
Given the regular sinusoidal trend that gold is taking, it was expected to move to the specified numbers, but don't forget that we are at a price ceiling and a sharp upward movement at the end of the upward trend can be a trap...
In case of a drop, the specified ranges are good support.
*Trade safely with us*

EURAUD | 4H | SWING TRADINGHey there;
Traders, your likes are always my biggest source of motivation for me to share analysis. For this reason, I would like to ask each and every one of my followers; please do not miss your likes.
I sincerely thank everyone who supports me with their likes.
SIGNAL ALERT
BUY LIMIT ORDER ( EURAUD ) 1,74560
🟢TP1:1,75388
🟢TP2:1,77709
🟢TP3:1,81747
🔴SL:1,71135
RR / 2,00

NOT SELLHello friends
Due to the sharp drop in price, we can open a trade in the direction of the trend, of course with capital and risk management.
*Trade safely with us*

TRB SELLHello friends
Due to the sharp drop in price, we can open a trade in the direction of the trend, of course with capital and risk management.
*Trade safely with us*

USD-CAD Free Signal! Sell!
Hello,Traders!
USD-CAD is trading in a
Downtrend and the pair is
Consolidating below the
Horizontal resistance
Around 1.3880 so we are
Bearish biased and we can
Enter a short trade on Monday
With the Take Profit of 1.3725
And the Stop Loss of 1.3908
Sell!
Comment and subscribe to help us grow!
Check out other forecasts below too!
Disclosure: I am part of Trade Nation's Influencer program and receive a monthly fee for using their TradingView charts in my analysis.

ADA BUY LIMIT (FREE)Hello friends
Due to the entry of buyers and the registration of higher ceilings and floors, we can buy in the direction of the trend and with capital and risk management within the specified ranges and move to the specified targets.
*Trade safely with us*

TON TON TONHello friends
Due to the entry of buyers and the registration of higher ceilings and floors, we can buy in the direction of the trend and with capital and risk management within the specified ranges and move to the specified targets.
*Trade safely with us*

BTC IT'S TIME TO ...Hello friends
Due to the entry of buyers and the breakdown of the trading range, we can open a buy position in the direction of the trend and with capital and risk management.
*Trade safely with us*

DOGECOIN BUY LIMIT...Hello friends✌
Given the good price growth and the arrival of buyers, now that the price is correcting, it is the best time to buy.
🙏If you like it, support it with a ✔like✔ and ✔comment✔.
*Trade safely with us*

Is it time to buy?Hello friends✌
Given the good price growth and the arrival of buyers, now that the price is correcting, it is the best time to buy.
🙏If you like it, support it with a ✔like✔ and ✔comment✔.
*Trade safely with us*
EUR-JPY Free Signals! Sell!
Hello,Traders!
EUR-JPY keeps growing
But the pair will soon hit
A horizontal resistance
Of 164.930 from where
We can enter a short trade
With the Target Level of 163.778
And the Stop Loss of 165.018
Sell!
Comment and subscribe to help us grow!
Check out other forecasts below too!
Disclosure: I am part of Trade Nation's Influencer program and receive a monthly fee for using their TradingView charts in my analysis.

XAUUSD/GOLD | 4H | SWING TRADEHey There,
Guys, I advise you to just wait for the breakout in gold. This is swing trading. I am just waiting for a breakout; if this breakout is to the downside, the target will be at least 3.215 level.
I hope this matches your desired tone.
Don't forget to click the like button at the bottom of this post to stay up to date with the latest changes!
Dear friends, your likes are always the biggest motivation for me to share my analysis. Therefore, I would like to ask each and every one of my followers; please keep your likes coming.
I sincerely thank everyone who supports me with their likes.

Gold (XAUUSD, 2H) Potential Triangle Structure Near CompletionOn the 2-hour timeframe, gold continues to consolidate inside a well-defined contracting triangle, marked by a series of lower highs and higher lows, suggesting reduced volatility before a directional move. The structure appears to follow a five-leg correction (waves 1–5), which may now be nearing completion.
The focus is now on how price reacts to the upper boundary of the triangle, but $3,310 is not a decisive level. Instead, the key signal will come from a breakout from the triangle itself with confirmed follow-through and volume.
Technical view:
– Structure: classic five-leg triangle forming inside the broader retracement
– Volume is increasing on approach to the upper boundary
– Fibonacci retracement levels in play above:
• $3,351 (0.618)
• $3,380 (0.5)
• $3,443 (0.236)
– Critical support remains along the lower triangle base and near the $3,258–$3,192 zone
– Breakdown below $3,192 would invalidate the bullish scenario
Scenario outlook:
This is a hypothetical pattern completion. If the triangle resolves upward, momentum could push price toward $3,350+, aligning with Fibonacci recovery targets.
Conclusion:
Gold is moving toward the decision point inside a contracting triangle. Watch for breakout confirmation from the structure itself — not individual levels. Until confirmed, this remains a potential scenario, not an active signal.
