SUI/USDT:BUY LIMITHello friends
Due to the heavy price drop, it can be seen that the buyers have supported the price well at the specified support and by hitting higher ceilings and floors, they are giving us a sign that they have good strength. Now we can buy in steps with capital and risk management and move to the specified targets.
Don't forget to save profit on each target.
*Trade safely with us*
Freesignals

PEPE(UPDATE)Hello friends
Due to the heavy price drop, you can see that buyers are slowly entering, and now there is a good opportunity to buy in stages and with capital management and move towards the specified goals.
Don't forget to save profit on each target.
*Trade safely with us*

SOLANA(UPDATE)Hello friends
Due to the heavy price drop, you can see that buyers are slowly entering and the price is creating a good ascending channel, which now provides a good opportunity to buy in stages and with capital management and move towards the specified goals.
Don't forget to save profit on each target.
*Trade safely with us*

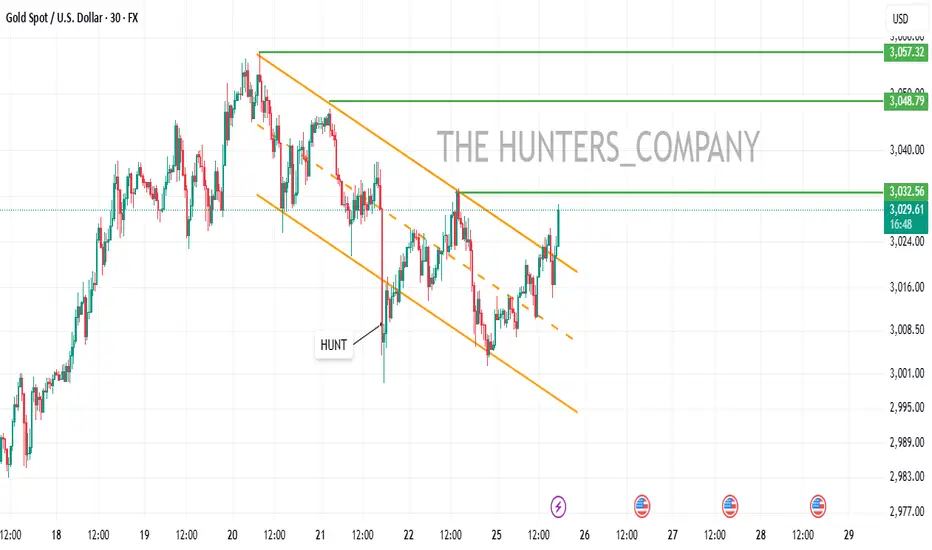
GOLD(UPDATE)Hello friends
Given the good and strong growth, gold is now engaged with an important resistance area, which if reached and the price trend weakens, it can correct to the specified areas.
*Trade safely with us*

XRP(UPDATE)Hello friends
Due to the heavy price drop, you can see that buyers are slowly entering, and now there is a good opportunity to buy in stages and with capital management and move towards the specified goals.
*Trade safely with us*

SOLANA at key support zone - Is $160 within reach?BINANCE:SOLUSDT has reached a major support level, an area where buyers have previously shown strong interest. This zone has acted as a key zone, increasing the likelihood of a bounce if buyers step in.
A bullish confirmation, such as a strong rejection pattern, bullish engulfing candles, or long lower wicks, would strengthen the case for a move higher. If buyers take control, the price could rally toward the $160 target. However, a decisive breakdown below this support would invalidate the bullish scenario and could lead to further downside.
This isn’t financial advice, just my take on how I approach support and resistance zones. Best to wait for clear confirmation, like a strong rejection or a volume spike, before making a move.
Every trader has a unique perspective. Let’s discuss this setup within the TradingView community!

GBP/JPYHello friends
Due to the price correction, the support area has now been identified, so you can buy in steps with capital management.
The target has also been identified.
*Trade safely with us*

GOLD BUYHello friends
Due to the channel breakdown, the price is expected to move to the specified targets. Be sure to follow capital management.
*Trade safely with us*
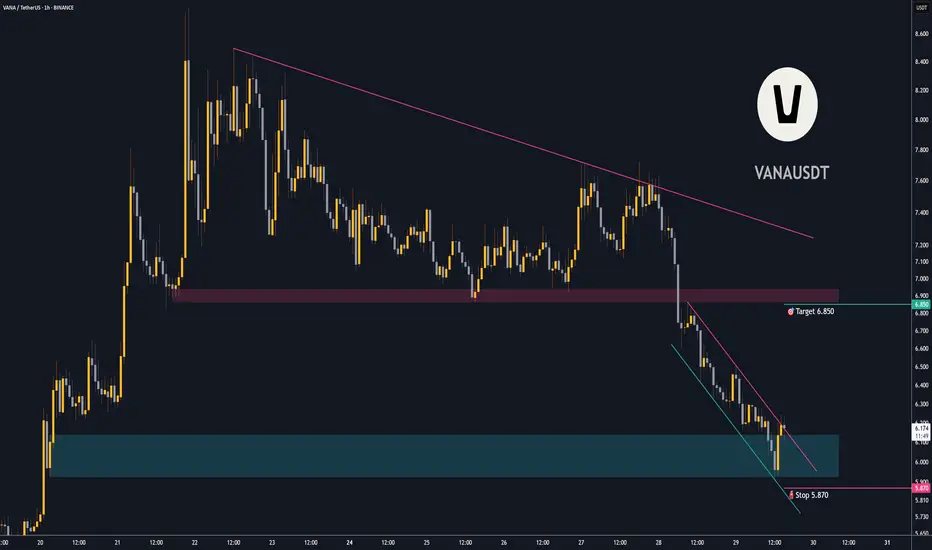
Trading opportunity for VANAUSDTBased on technical factors there is a Buy position in :
📊 VANAUSDT
🔵 Buy Now
🪫Stop loss 5.870
🔋Target 6.850
📏 R/R 2
💸RISK : 1%
We hope it is profitable for you ❤️
Please support our activity with your likes👍 and comments📝
DOGECOINHello friends
Due to the price falling in the specified support area, the price has been well supported. Now, due to the good price support by buyers, we can buy in steps within the specified purchase ranges, with capital and risk management, and move towards the specified goals.
*Trade safely with us*

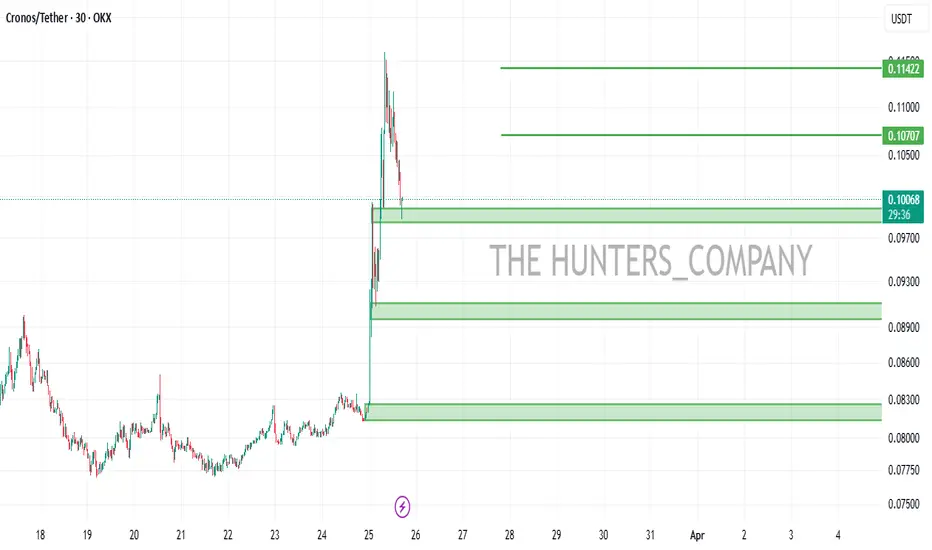
CRO/USDT : BUY LIMITHello friends
Given the good price growth, now in its correction, we can buy in steps with risk and capital management and move with it to the specified targets.
*Trade safely with us*
ETH/USDT : BUY LIMITHello friends
Given the price growth, now that the price is correcting, you can buy in steps and be careful to ensure that capital management is followed.
*Trade safely with us*

TRUMP/USDT:BUY LIMITHello friends
Given the price growth, now that the price is correcting, you can buy in steps and be careful to ensure that capital management is followed.
*Trade safely with us*

EURUSD:SELLHello friends
Given that the price is in this channel, we can now open a sell trade when the price has returned from the ceiling of the channel, of course with capital management...
The target is also specified.
*Trade safely with us*

GBP/USDHello friends
You can see that a trend continuation triangle pattern is forming, which we can enter into a trade if it fails.
The targets are also specified.
*Trade safely with us*

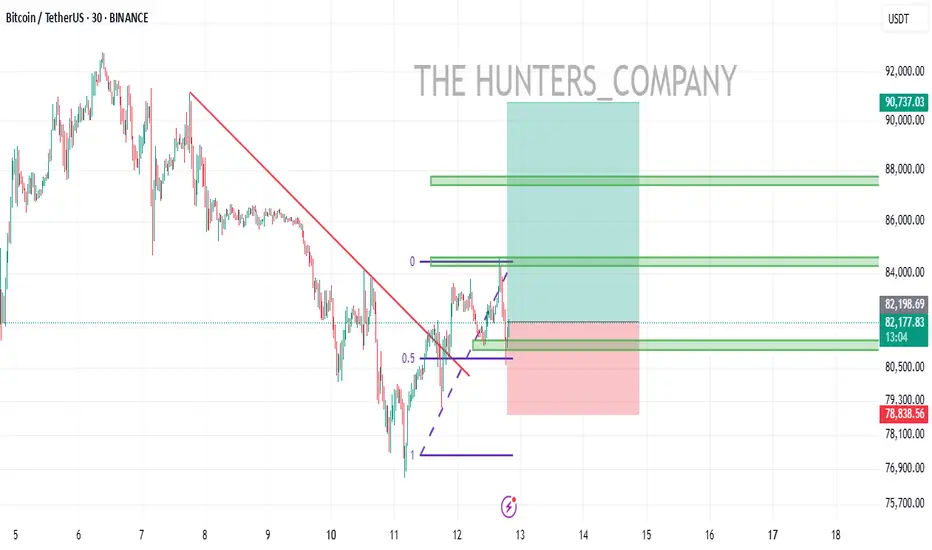
BTC/USDTHello friends
After a heavy fall, now with the trend line broken and the ceiling and floor higher after creating a pullback, you can enter the capital with capital management.
*Trade safely with us*
POPCAT...Hello friends
Given the good price growth and the arrival of buyers, you can enter into a transaction during the price correction with capital and risk management.
*Trade safely with us*

PEPE...Hello friends
Regarding the price drop, now that buyers are supporting the price, it was entered within the specified support ranges with capital and risk management.
*Trade safely with us*

AVAX/USDTHello friends
As you can see, the price has been well supported by buyers from the specified support area...
Now you can buy in steps with capital and risk management and move to the specified targets.
The red resistance area can also cause a price correction, so be careful and take profit.
*Trade safely with us*

BTCHello friends
You can see that after the price fell in the specified support area, the price was supported by buyers and caused the resistance to break, and now, when the price returns to the specified ranges, you can buy in steps and move with it to the specified targets, of course, with capital and risk management...
*Trade safely with us*

SUI/USDTHello friends
You can see that after the price fell in the specified support area, the price was supported by buyers and caused the resistance to break, and now, when the price returns to the specified ranges, you can buy in steps and move with it to the specified targets, of course, with capital and risk management...
*Trade safely with us*

XRP/USDT:BUY LIMITHello friends
You can see that after the price fell in the specified support area, buyers came in and supported the price and created higher ceilings and floors.
Now we can buy at the specified levels with capital and risk management and move with it to the specified targets.
*Trade safely with us*

BNB/USDT:BUY LIMITHello friends
You can see that after the price fell, buyers entered the specified support area and supported the price and created higher ceilings and floors.
Now we can buy at the specified levels with capital and risk management and move to the specified targets.
*Trade safely with us*
