EURGBP nearing resistance – Drop toward 0.8370 next?OANDA:EURGBP is getting close to a key resistance level that has previously acted as a strong barrier, triggering bearish momentum in the past -
This zone is once again a potential point of interest for those looking for short opportunities. Given this, how price reacts here could set the tone for the next move.
If signs of rejection appear: such as long upper wicks, bearish candlestick formations, or a slowdown in bullish momentum, a move toward the 0.83700 is highly possible . However, a decisive breakout above this resistance may invalidate the bearish bias and lead to further upside. Price action at this level will be critical in determining the next move.
Just my perspective on key levels, always confirm setups and maintain solid risk management.
Freesignals

WIF/USDTHello friends
According to the market cycle, the price decline is ongoing and is expected to continue.
Now the only important support is the green area, which the price reaches there and we will see what reaction we get from the buyers.
Will they support the price or will the decline continue...
If you want to be with us in this alt season, send us a message.
*Trade safely with us*

GMX/USDTHello friends
Due to the heavy price drop on the indicated support, buyers have provided good support for the price, which has caused a good price growth.
Now you can buy in steps in the indicated support areas.
If you want to be with us in the Alt Season, send us a message.
*Trade safely with us*

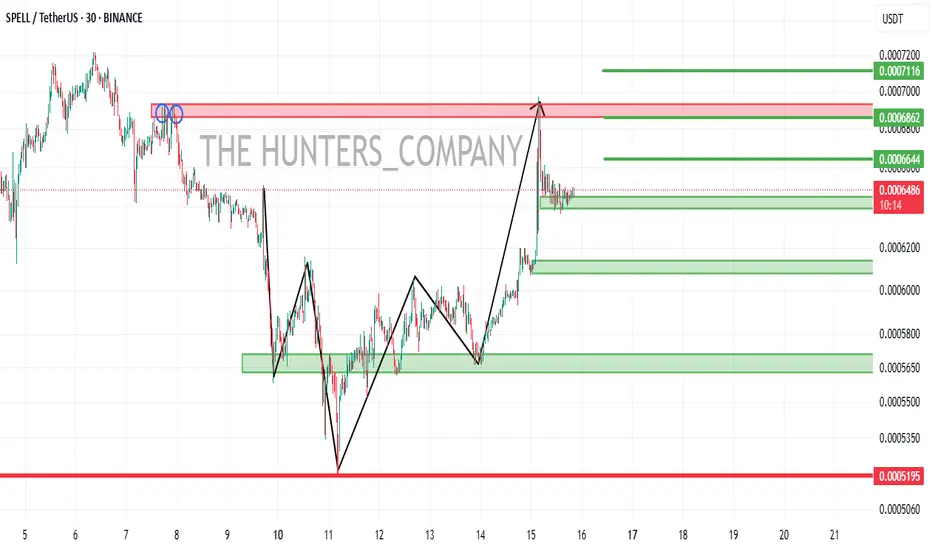
SPELL/USDTHello friends
Given the strong support of the price, you can buy within the specified ranges with capital and risk management.
Price targets are also specified...
*Trade safely with us*
BNX/USDTHello friends
Given the price growth and the arrival of buyers, now that the price has corrected, you can enter the transaction with risk and capital management.
*Trade safely with us*

BTC FOR SCALPERS AND DAY TRADERS *9400 POINTS **Guys pls like, share and follow my ideas
Entry price ,stoploss and Target already marked in the chart itself FYI.
Thank You All
ZIGZAG STRATEGY SIGNAL
GREEN ARROW INDICATES BUY
RED ARROW INDICATES SELL
STOP LOSS DONT RISK MORE THAN 2%
OF YOUR CAPITAL
BUY TARGET POINT 2900
SELL TARGET POINT 6500

NOTCOINHello friends
As you can see, the price has been very strongly supported by buyers from the support area we have identified, causing a price pump.
Now, in the areas we have identified, you can buy in steps with capital management and move to the specified targets.
*Trade safely with us*

MAV/USDTHello friends
After a heavy fall, now with the trend line broken and the ceiling and floor hit higher, it is expected to move to the resistance area.
You can enter the capital with capital management.
*Trade safely with us*

TRB...Hello friends
According to the formation of a trading range, if the price manages to break through the price, the specified ranges can be a good support.
*Trade safely with us*

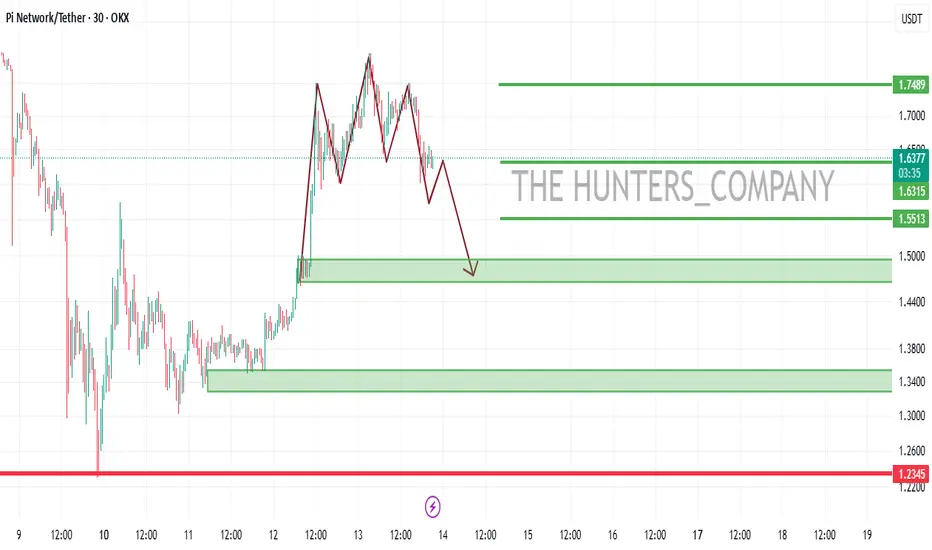
PI...Hello friends
Given the good growth we had, we now have the opportunity to buy in the pullback...
You can buy in steps within the limits we have specified for you with capital management...
*Trade safely with us*
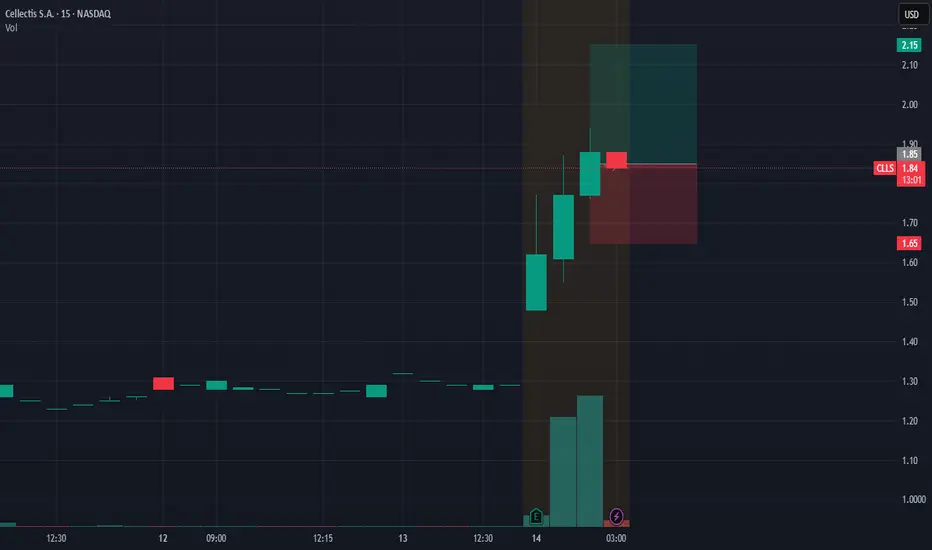
$CLLS free signal of the week.With a positive fundamental behind, we may see some action today on NASDAQ:CLLS
EURGBP - Approaching Key Resistance: Is 0.8370 the next target?OANDA:EURGBP is nearing a key resistance level that has previously acted as a strong barrier, triggering bearish momentum in the past. This zone also aligns with prior supply areas where sellers have stepped in, making it a potential point of interest for those looking for short opportunities. Given its historical significance, how price reacts here could set the tone for the next move.
If bearish signals emerge, such as rejection wicks, bearish candlestick patterns, or signs of weakening bullish pressure, I anticipate a move toward the 0.83700 level. However, a clear breakout above this resistance could challenge the bearish outlook and open the door for further upside. It's a pivotal area where price action will likely provide clearer clues on the next direction.
Just my take on support and resistance zones, not financial advice. Always confirm your setups and trade with a proper risk management.

SPY STRONG BREAKOUT|SHORT|
✅SPY made a bearish breakout
Of the key horizontal level
Of 568.00$ which is now
A resistance and the breakout
Is confirmed so we are bearish
Biased and we will be expecting
A further bearish move down
SHORT🔥
✅Like and subscribe to never miss a new idea!✅

AUD-USD Support Ahead! Buy!
Hello,Traders!
AUD-USD is going down
And will soon retest a
Horizontal demand level
Of 0.6260 from where we
Will be expecting a local
Rebound and a move up
Buy!
Comment and subscribe to help us grow!
Check out other forecasts below too!
Disclosure: I am part of Trade Nation's Influencer program and receive a monthly fee for using their TradingView charts in my analysis.

GOLD (XAUUSD): Rise Continues
Gold broke and closed above a resistance line of a horizontal
consolidation range on a daily.
We can expect a bullish movement to the All-Time high now.
Goal - 2952
❤️Please, support my work with like, thank you!❤️

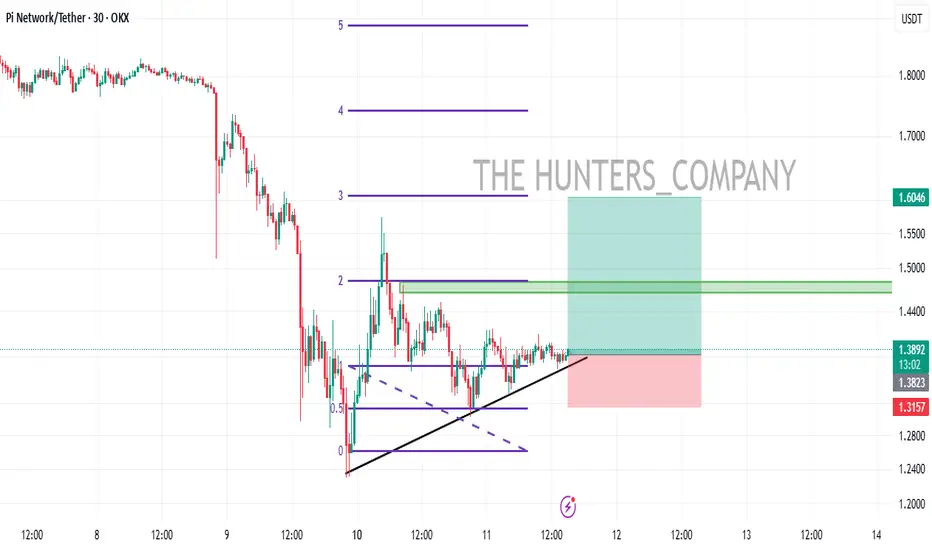
PI/USDT (UPDATE)Hello friends
Given the price drop, now with the formation of a triangle and the price compression, we will probably have a good pump, so we have determined the entry point and price targets for you to enter with risk and capital management.
*Trade safely with us*
GBPCHF: Bullish Wave Continues 🇬🇧🇨🇭
As I predicted yesterday, GBPCHF went up from support.
I see one more bullish pattern today:
this time we have a confirmed breakout of a neckline of a double bottom.
The market is going to rise and reach 1.148 level soon.
❤️Please, support my work with like, thank you!❤️

EUR-GBP Resistance Ahead! Sell!
Hello,Traders!
EUR-GBP keeps growing in
A strong uptrend but the pair
Is already overbought so after
It hits a horizontal support
Level of 0.8473 we will be
Expecting a local bearish correction
Sell!
Comment and subscribe to help us grow!
Check out other forecasts below too!
Disclosure: I am part of Trade Nation's Influencer program and receive a monthly fee for using their TradingView charts in my analysis.

NASDAQ100Hello friends
Our ascending channel had a strong break and considering the negative news, how far do you think the decline will continue?
The support levels identified can help you trade, but we need to see where the price will go with the news that will be announced this week...
*Trade safely with us*

Ethereum at Key Support: Will it bounce to 2,800$?COINBASE:ETHUSD price is moving inside a clear ascending channel , with the upper boundary acting as long-term resistance and the lower boundary providing dynamic support. After a steady climb, the price started showing weakness, confirmed by a head and shoulders pattern, a common sign that the trend might reverse. This led to a strong drop, bringing the price down to a key support zone around $2,000.
This support area is important because it meets with a major trendline, making it a likely spot where buyers could step in. The volume profile also shows a lot of activity in this zone, meaning traders have been interested in these levels before. If the price holds above this support, there’s a good chance it could bounce towards $2,800, which lines up with a previous resistance.
A breakdown below the trendline shifts the bias bearish toward 1,414. For now, as long as Ethereum stays above the support zone, a recovery toward $2,800 is on the table. But if it falls below, the bearish trend is likely to continue.
Just my take on support and resistance zones, not financial advice. Always confirm your setups and trade with solid risk management.

Solana's important supporthello friends
Due to the heavy demand of Solana and the construction of new floors based on the market cycle, we expect a new floor within the specified range.
If we reach the support range of 105-110 dollars, we can buy with confirmation, of course, with capital management...
*Trade safely with us*

GBP_CHF WILL GROW|LONG|
✅GBP_CHF is trading along the rising support line
And as the pair is going up now
After the retest of the line
I am expecting the price to keep growing
To retest the supply levels above at 1.1409
LONG🚀
✅Like and subscribe to never miss a new idea!✅

SUI/USDT UPDATE Hello friends
Given the floor that the price has made, we now see the power of buyers in the price reversal, and given the power of buyers, we can make purchases, of course, in stages and with capital management and move with it to the specified goals.
*Trade safely with us*
