LIVE TRADE (XRP)Hello friends🙌
🔥Here we are with live trading Ripple, please follow capital management.
📈Given the resistance break, we can enter a buy trade and move with it to the specified targets.
🔥Follow us for more signals🔥
*Trade safely with us*
Freesignals

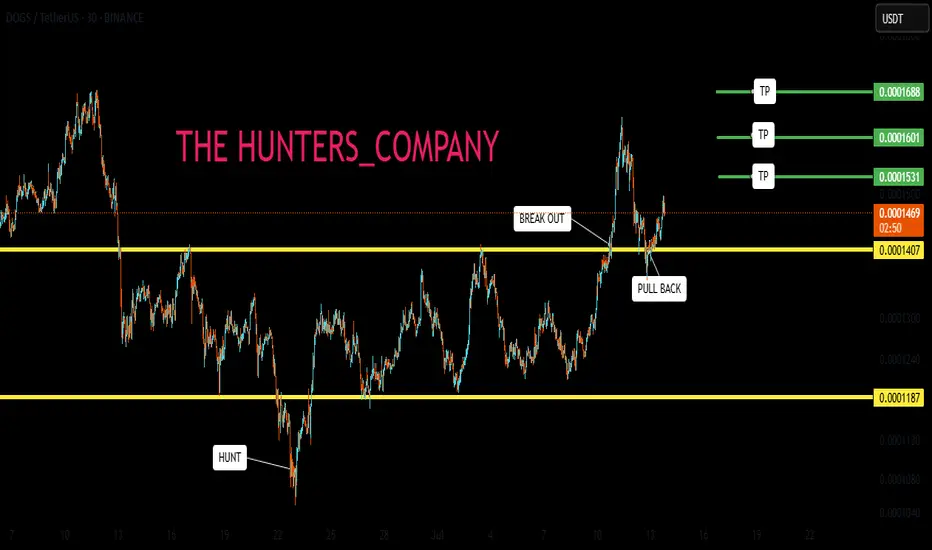
DOGS BUY !!!Hello friends🙌
📉Regarding the price drop, you can see that the price has been suffering for a while and even the resistance has broken, which is not a valid failure (80% of failures are fake in the range)
📈Now, with the successful failure we had and the moneyback that the price has made, we can expect the price to move to the specified targets. Note that for trading, be sure to observe capital management.
🔥Follow us for more signals🔥
*Trade safely with us*
BITCOIN UPDATEHello friends🙌
📈Given the upward trend we had, you can see that the price is in an upward channel and has also formed a bullish pattern, which, given the strength behind the trend, seems to have higher targets.
🔊Be careful, the basic principle of trading is capital management, so be sure to follow capital management.
🔥Join us for more signals🔥
*Trade safely with us*

Is Pepe growing? Read the caption, it's important.Hello friends🙌
✔Some factors caused the price to fall, but in a support area that we have drawn for you with several Fibonacci waves, you can see that a classic double bottom pattern has been formed and buyers have entered.
🔊Now there is no more news of a fall and buyers have raised the price to the point where it has created a higher ceiling and floor, and this is very important and signals a change in trend.
📈Now that the price has broken the specified resistance line and is well supported by the specified support line, we can expect the price to move to the specified areas, but do not forget that the most important thing to observe in trading is capital management⚠
🔥Follow us for more signals🔥
*Trade safely with us*

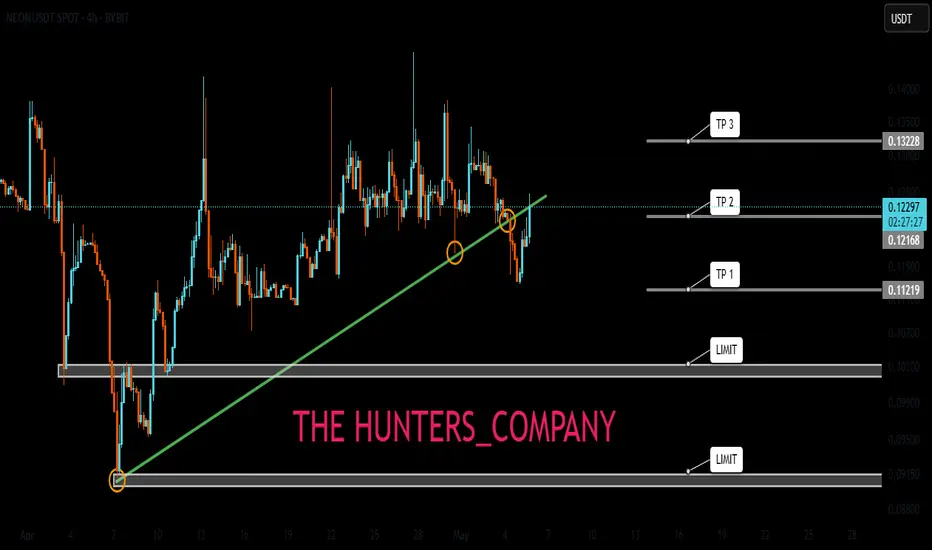
NEON : How long does the decline last?Hello friends
If you are a holder of this currency or have bought it, you should know that the token release is coming and this will cause the price to drop, so be careful.
We have identified good buying ranges for you, where you can buy in case of a drop, with risk and capital management.
*Trade safely with us*
AGI : The fall is comingHello friends
As the price has reached a strong resistance area, you can see that the price has been corrected and lower lows have been made. Now, given the token release that this currency has, there is a possibility of further decline, so we can buy at lower points with capital and risk management and move with it to the specified targets.
*Trade safely with us*
Today's signal is TONHello friends
Given the price growth after reaching resistance, it has entered a correction, which provides a good opportunity to buy in stages and with capital management and move to the specified targets.
*Trade safely with us*

Don't miss Ethereum todayHello friends
Given the good rise we had, you can see that the price has entered a correction and has provided us with a good opportunity to buy in steps, of course with capital and risk management.
*Trade safely with us*

LITCOIN : So what is an ETF ?Hello friends
Be careful with the recent fluctuations of this coin because the movements of this coin have become unpredictable and we suggest that if you want to buy, buy in the specified support areas and in steps, of course with capital and risk management...
We have also specified targets for you.
*Trade safely with us*

NOTCOIN AGAIN ...Hello friends
Due to the change in the bearish structure and the weakness of the sellers, you can see that the buyers entered and were able to create new ceilings.
Now, according to the trend, we can buy in steps at the specified support points and move with it to the specified targets.
*Trade safely with us*

Will key support be held or broken today?Hello friends
According to the complete analysis we conducted on this currency, we concluded that the price correction can continue with the failure of the specified support and go to lower supports, but if buyers support the price in the support area, it can have a good rise.
Note that with capital and risk management, you can buy in steps in the specified support areas and move with it to the specified targets.
*Trade safely with us*

Solana:Daily free signalhello friends👋
As you can see, after the drop that we had, insider buyers showed and were able to support the price well.
But it was not enough, and as you can see, a noisy pattern has formed, which can indicate a further decrease in the price.
Now we can take advantage of this opportunity and make step-by-step purchases with risk and capital management in the support areas that we have obtained for you and move to the specified goals.
🔥Follow us for more signals🔥
*Trade safely with us*

Ethereum:Daily signalhello guys👋
According to the drop we had, you can see that buyers came in and the price had a good growth, and after that a trading range was made in which the price got stuck.
Now, considering that the price is in the trading range and it seems that the buyers have shown their support, it is possible to step into the specified support areas with risk and capital management and move up to the set goals.
🔥Follow us for more signals🔥
*Trade safely with us*

Xrp:The fate of Ripple in the long termhello friends👋
After a good price growth that we had, you can see that the buyers gradually exited and a triangle pattern was formed.
Now, according to the specified support, it should be seen whether buyers support Ripple or not...
You have to wait and nothing can be said until the failure of the pattern, but we suggest that you buy step by step with capital and risk management in the identified areas that are very good supports and move to the set goals.
And in the end, we must say that don't forget that we are in a strong upward trend, that the probability of the continuation of the Bister trend is the possibility of a fall...
🔥Follow us for more signals🔥
*Trade safely with us*

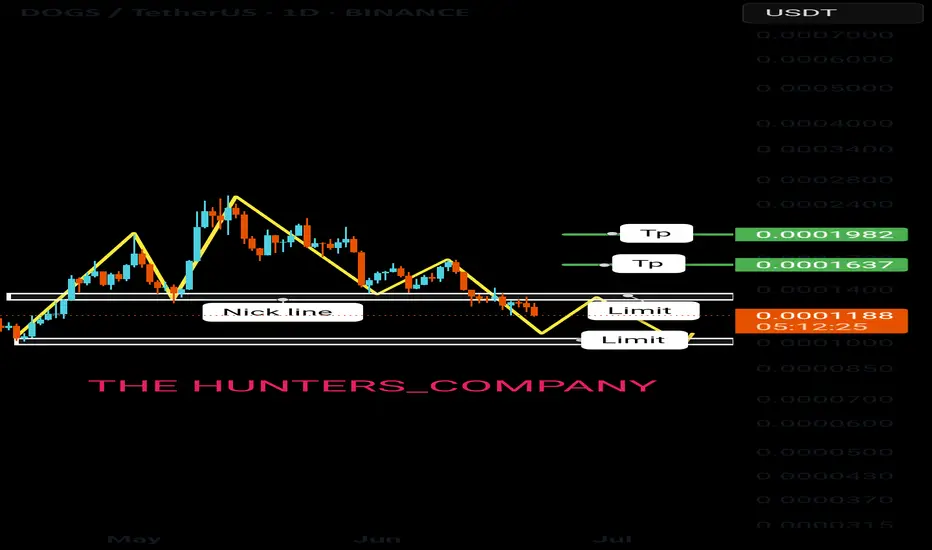
Dogs:Where is the time and point of purchase?hello friends👋
We come to another analysis, this time a popular coin meme that you requested a lot🔥
Well, let me start with the pattern that we specified for you, which is a sign of a price drop, and you can see this happening...
Now, in the important support areas that we have specified for you, you can buy step by step, of course, with risk and capital management.💰
🔥Follow us for more signals🔥
*Trade safely with us*
When does Bolran start?Read carefullyhello friends👋
💰Many of you are asking when Bolran will start or if it will start at all, we decided to explain it to you in a full post.
Well, you can see the Ethereum chart moving in a channel, and with a drop, it created a big fear that a fall is coming, and meanwhile, the buyers returned the price to above 2000 dollars with a strong and unexpected return.
✅️Now the price is stuck in the specified box between 2200 and 2500, and if this range is maintained, the price will easily move up to the range of 3200 in the first wave, and if it fails to maintain this range, the price will fall below 1500 dollars.
🧐Now, in our opinion, due to the rapid return of the price from the channel, this failure is a fake channel and the range will be maintained, and we are likely to see Ethereum rise in the coming weeks.
🤔You know that Ethereum is the leader of altcoins, and if it grows, important altcoins will grow, which is the beginning of Bolran, and there are important altcoins that can be used for good profit.
🌟You can join us if you like.🌟
🔥Follow us for more signals🔥
*Trade safely with us*

Price explosion is coming?Read carefullyhello friends👋
We have come to analyze a popular Kuwaiti meme that you have asked to analyze a lot.
🌟Well, according to the drop we had, it can be seen that the buyers came in and formed a good upward wave, and after that, Femt entered a channel, which can be said to be a flag pattern...🧐
Now, according to the formed channel, we can enter into a purchase transaction with capital and risk management in case of a valid failure of the channel.
🔥Follow us for more signals on Bolran.🔥
*Trade safely with us*

Free signal hello friends👋
🌟Considering that the price reaches an important weekly support, the price is expected to grow, so you can enter into a transaction with risk and capital management and move to the specified goals.
🔥Follow us for more signals🔥
*Trade safely with us*

AUDCAD Trade plan: Waiting for bullish confirmation at RetestPrice broke above resistance with a momentum candle, indicating buyer control. This is our first clue that a structure shift might have occurred.
This retest is essential. Many traders make the mistake of entering too early without confirmation. But it's right here, once price touches the former resistance, that you must observe how price reacts. Look for price exhaustion or reversal candlesticks such as bullish engulfing patterns, or even inside bars.
Once rejection is confirmed, I'm looking to go long to 0.90450.
Just sharing my thoughts for the charts, this isn’t financial advice. Always confirm your setups and manage your risk properly.

USDJPY LONG & SHORT – DAILY FORECAST Q3 | D15 | W29 | Y25💼 USDJPY LONG & SHORT – DAILY FORECAST
Q3 | D15 | W29 | Y25
📊 MARKET STRUCTURE SNAPSHOT
USDJPY is currently reaching for a key higher time frame supply zone, looking for price action to show weakness at premium levels. Structure and momentum are now aligning for a short opportunity backed by multi-timeframe confluence.
🔍 Confluences to Watch 📝
✅ Daily Order Block (OB)
Looking for Strong reaction and early signs of distribution.
✅ 4H Order Block
Break of internal structure (iBoS) confirms a short-term bearish transition.
✅ 1H Order Block
📈 Risk Management Protocols
🔑 Core principles:
Max 1% risk per trade
Only execute at pre-identified levels
Use alerts, not emotion
Stick to your RR plan — minimum 1:2
🧠 You’re not paid for how many trades you take, you’re paid for how well you manage risk.
🧠 Weekly FRGNT Insight
"Trade what the market gives, not what your ego wants."
Stay mechanical. Stay focused. Let the probabilities work.
🏁 Final Thoughts from FRGNT
📌 The structure is clear.
The confluences are stacked.
Let execution follow discipline, not emotion.

USDCAD LONG DAILY FORECAST Q3 D15 W29 Y25USDCAD LONG DAILY FORECAST Q3 D15 W29 Y25
Professional Risk Managers👋
Welcome back to another FRGNT chart update📈
Diving into some Forex setups using predominantly higher time frame order blocks alongside confirmation breaks of structure.
Let’s see what price action is telling us today! 👀
💡Here are some trade confluences📝
✅Daily Order block identified
✅4H Order Block identified
✅1H Order Block identified
🔑 Remember, to participate in trading comes always with a degree of risk, therefore as professional risk managers it remains vital that we stick to our risk management plan as well as our trading strategies.
📈The rest, we leave to the balance of probabilities.
💡Fail to plan. Plan to fail.
🏆It has always been that simple.
❤️Good luck with your trading journey, I shall see you at the very top.
🎯Trade consistent, FRGNT X

GBPCAD SHORT FORECAST Q3 D15 W29 Y25GBPCAD SHORT FORECAST Q3 D15 W29 Y25
Professional Risk Managers👋
Welcome back to another FRGNT chart update📈
Diving into some Forex setups using predominantly higher time frame order blocks alongside confirmation breaks of structure.
Let’s see what price action is telling us today! 👀
💡Here are some trade confluences📝
✅Daily Order block identified
✅4H Order Block identified
✅1H Order Block identified
🔑 Remember, to participate in trading comes always with a degree of risk, therefore as professional risk managers it remains vital that we stick to our risk management plan as well as our trading strategies.
📈The rest, we leave to the balance of probabilities.
💡Fail to plan. Plan to fail.
🏆It has always been that simple.
❤️Good luck with your trading journey, I shall see you at the very top.
🎯Trade consistent, FRGNT X

EURJPY SHORT – DAILY FORECAST Q3 | W29 | D15 | Y25💼 EURJPY SHORT – DAILY FORECAST
Q3 | W29 | D15 | Y25
📊 MARKET STRUCTURE SNAPSHOT
EURJPY is currently reacting from a key higher time frame supply zone, with price action showing weakness at premium levels. Structure and momentum are now aligning for a short opportunity backed by multi-timeframe confluence.
🔍 Confluences to Watch 📝
✅ Daily Order Block (OB)
Strong reaction and early signs of distribution.
Previous bullish momentum is losing steam; structure is flattening with rejection wicks forming.
✅ 4H Order Block
Break of internal structure (iBoS) confirms a short-term bearish transition.
✅ 1H Order Block
1H structure shift bearish
📈 Risk Management Protocols
🔑 Core principles:
Max 1% risk per trade
Only execute at pre-identified levels
Use alerts, not emotion
Stick to your RR plan — minimum 1:2
🧠 You’re not paid for how many trades you take, you’re paid for how well you manage risk.
🧠 Weekly FRGNT Insight
"Trade what the market gives, not what your ego wants."
Stay mechanical. Stay focused. Let the probabilities work.
🏁 Final Thoughts from FRGNT
📌 The structure is clear.
The confluences are stacked.
Let execution follow discipline, not emotion.
