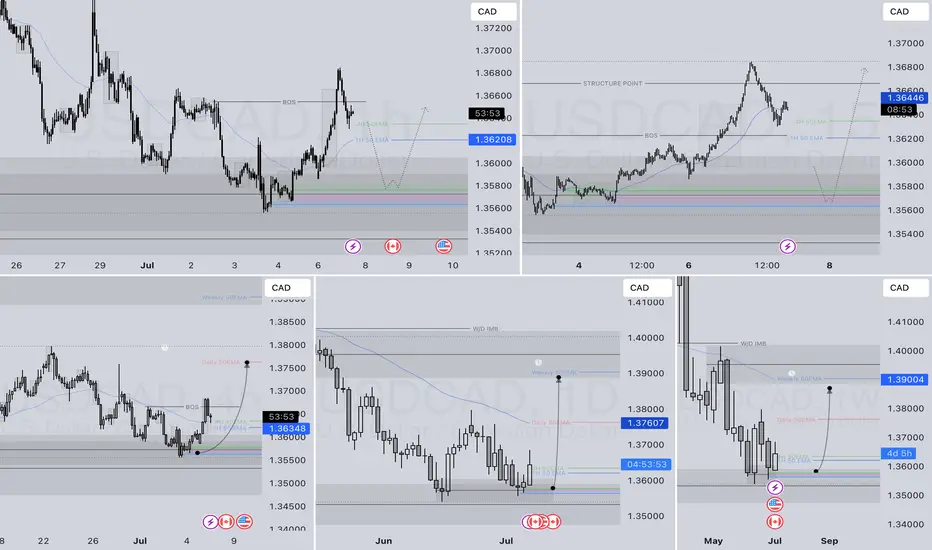
USDCAD LONG DAILY FORECAST Q3 W28 Y25USDCAD LONG DAILY FORECAST Q3 W28 Y25
Professional Risk Managers👋
Welcome back to another FRGNT chart update📈
Diving into some Forex setups using predominantly higher time frame order blocks alongside confirmation breaks of structure.
Let’s see what price action is telling us today! 👀
💡Here are some trade confluences📝
✅Daily Order block identified
✅4H Order Block identified
✅1H Order Block identified
🔑 Remember, to participate in trading comes always with a degree of risk, therefore as professional risk managers it remains vital that we stick to our risk management plan as well as our trading strategies.
📈The rest, we leave to the balance of probabilities.
💡Fail to plan. Plan to fail.
🏆It has always been that simple.
❤️Good luck with your trading journey, I shall see you at the very top.
🎯Trade consistent, FRGNT X
Freesignalsweek
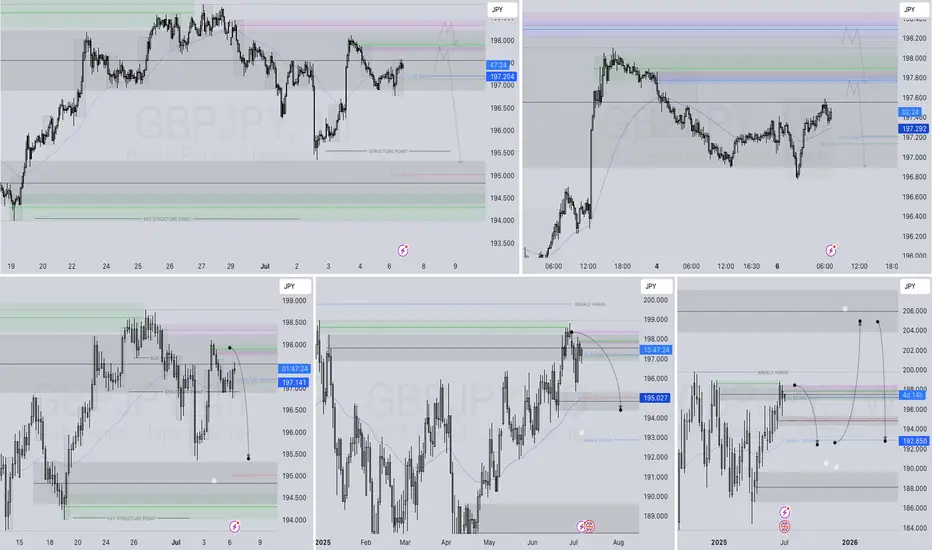
GBPJPY SHORT DAILY FORECAST Q3 D7 W28 Y25GBPJPY SHORT DAILY FORECAST Q3 D7 W28 Y25
Professional Risk Managers👋
Welcome back to another FRGNT chart update📈
Diving into some Forex setups using predominantly higher time frame order blocks alongside confirmation breaks of structure.
Let’s see what price action is telling us today! 👀
💡Here are some trade confluences📝
✅Daily Order block identified
✅4H Order Block identified
✅1H Order Block identified
🔑 Remember, to participate in trading comes always with a degree of risk, therefore as professional risk managers it remains vital that we stick to our risk management plan as well as our trading strategies.
📈The rest, we leave to the balance of probabilities.
💡Fail to plan. Plan to fail.
🏆It has always been that simple.
❤️Good luck with your trading journey, I shall see you at the very top.
🎯Trade consistent, FRGNT X
EURCHF LONG DAILY FORECAST Q3 D7 W28 Y25EURCHF LONG DAILY FORECAST Q3 D7 W28 Y25
Professional Risk Managers👋
Welcome back to another FRGNT chart update📈
Diving into some Forex setups using predominantly higher time frame order blocks alongside confirmation breaks of structure.
Let’s see what price action is telling us today! 👀
💡Here are some trade confluences📝
✅Daily Order block identified
✅4H Order Block identified
✅1H Order Block identified
🔑 Remember, to participate in trading comes always with a degree of risk, therefore as professional risk managers it remains vital that we stick to our risk management plan as well as our trading strategies.
📈The rest, we leave to the balance of probabilities.
💡Fail to plan. Plan to fail.
🏆It has always been that simple.
❤️Good luck with your trading journey, I shall see you at the very top.
🎯Trade consistent, FRGNT X

GBPJPY SHORT DAILY FORECAST Q3 D4 W27 Y25GBPJPY SHORT DAILY FORECAST Q3 D4 W27 Y25
Professional Risk Managers👋
Welcome back to another FRGNT chart update📈
Diving into some Forex setups using predominantly higher time frame order blocks alongside confirmation breaks of structure.
Let’s see what price action is telling us today! 👀
💡Here are some trade confluences📝
✅Daily Order block identified
✅4H Order Block identified
✅1H Order Block identified
🔑 Remember, to participate in trading comes always with a degree of risk, therefore as professional risk managers it remains vital that we stick to our risk management plan as well as our trading strategies.
📈The rest, we leave to the balance of probabilities.
💡Fail to plan. Plan to fail.
🏆It has always been that simple.
❤️Good luck with your trading journey, I shall see you at the very top.
🎯Trade consistent, FRGNT X

USDCAD LONG DAILY FORECAST Q3 D30 W27 Y25USDCAD LONG DAILY FORECAST Q3 D30 W27 Y25
Professional Risk Managers👋
Welcome back to another FRGNT chart update📈
Diving into some Forex setups using predominantly higher time frame order blocks alongside confirmation breaks of structure.
Let’s see what price action is telling us today! 👀
💡Here are some trade confluences📝
✅Daily Order block identified
✅4H Order Block identified
✅1H Order Block identified
🔑 Remember, to participate in trading comes always with a degree of risk, therefore as professional risk managers it remains vital that we stick to our risk management plan as well as our trading strategies.
📈The rest, we leave to the balance of probabilities.
💡Fail to plan. Plan to fail.
🏆It has always been that simple.
❤️Good luck with your trading journey, I shall see you at the very top.
🎯Trade consistent, FRGNT X

AUDUSD SHORT DAILY FORECAST Q3 D30 W27 Y25AUDUSD SHORT DAILY FORECAST Q3 D30 W27 Y25
Professional Risk Managers👋
Welcome back to another FRGNT chart update📈
Diving into some Forex setups using predominantly higher time frame order blocks alongside confirmation breaks of structure.
Let’s see what price action is telling us today! 👀
💡Here are some trade confluences📝
✅Daily Order block identified
✅4H Order Block identified
✅1H Order Block identified
🔑 Remember, to participate in trading comes always with a degree of risk, therefore as professional risk managers it remains vital that we stick to our risk management plan as well as our trading strategies.
📈The rest, we leave to the balance of probabilities.
💡Fail to plan. Plan to fail.
🏆It has always been that simple.
❤️Good luck with your trading journey, I shall see you at the very top.
🎯Trade consistent, FRGNT X

GBPJPY SHORT DAILY FORECAST Q3 D30 W27 Y25GBPJPY SHORT DAILY FORECAST Q3 D30 W27 Y25
Professional Risk Managers👋
Welcome back to another FRGNT chart update📈
Diving into some Forex setups using predominantly higher time frame order blocks alongside confirmation breaks of structure.
Let’s see what price action is telling us today! 👀
💡Here are some trade confluences📝
✅Daily Order block identified
✅4H Order Block identified
✅1H Order Block identified
🔑 Remember, to participate in trading comes always with a degree of risk, therefore as professional risk managers it remains vital that we stick to our risk management plan as well as our trading strategies.
📈The rest, we leave to the balance of probabilities.
💡Fail to plan. Plan to fail.
🏆It has always been that simple.
❤️Good luck with your trading journey, I shall see you at the very top.
🎯Trade consistent, FRGNT X

AUDUSD WEEKLY HIGHER TIME FRAME FORECAST Q3 W27 Y25AUDUSD WEEKLY HIGHER TIME FRAME FORECAST Q3 W27 Y25
Professional Risk Managers👋
Welcome back to another FRGNT chart update📈
Diving into some Forex setups using predominantly higher time frame order blocks alongside confirmation breaks of structure.
Let’s see what price action is telling us today! 👀
💡Here are some trade confluences📝
✅Weekly 50EMA Rejection
✅Daily Order block identified
✅4H Order Block identified
🔑 Remember, to participate in trading comes always with a degree of risk, therefore as professional risk managers it remains vital that we stick to our risk management plan as well as our trading strategies.
📈The rest, we leave to the balance of probabilities.
💡Fail to plan. Plan to fail.
🏆It has always been that simple.
❤️Good luck with your trading journey, I shall see you at the very top.
🎯Trade consistent, FRGNT X

GBPJPY SHORT FORECAST Q2 W26 D27 Y25GBPJPY SHORT FORECAST Q2 W26 D27 Y25
Professional Risk Managers
Welcome back to another FRGNT chart update
Diving into some Forex setups using predominantly higher time frame order blocks alongside confirmation breaks of structure.
Let’s see what price action is telling us today
Here are some trade confluences
Weekly Order Block Identified
Daily Order block identified
4H Order Block identified
15' Order block identified
Remember, to participate in trading comes always with a degree of risk, therefore as professional risk managers it remains vital that we stick to our risk management plan as well as our trading strategies.
The rest, we leave to the balance of probabilities.
Fail to plan. Plan to fail.
It has always been that simple.
Good luck with your trading journey, I shall see you at the very top.
Trade consistent, FRGNT X

EURGBP SHORT FORECAST Q2 W26 D27 Y25EURGBP SHORT FORECAST Q2 W26 D27 Y25
Professional Risk Managers👋
Welcome back to another FRGNT chart update📈
Diving into some Forex setups using predominantly higher time frame order blocks alongside confirmation breaks of structure.
Let’s see what price action is telling us today! 👀
💡Here are some trade confluences📝
✅Weekly Order block rejection
✅15' Order block to be confirmed
✅4H Order block identification
✅HTF 50 EMA support
🔑 Remember, to participate in trading comes always with a degree of risk, therefore as professional risk managers it remains vital that we stick to our risk management plan as well as our trading strategies.
📈The rest, we leave to the balance of probabilities.
💡Fail to plan. Plan to fail.
🏆It has always been that simple.
❤️Good luck with your trading journey, I shall see you at the very top.
🎯Trade consistent, FRGNT X

USDCAD LONG FORECAST Q2 W25 D17 Y25 12:18 GMT UPDATEUSDCAD LONG FORECAST Q2 W25 D17 Y25 12:18 GMT UPDATE
Professional Risk Managers👋
Welcome back to another FRGNT chart update📈
Diving into some Forex setups using predominantly higher time frame order blocks alongside confirmation breaks of structure.
💡Here are some trade confluences📝
✅1H order block
✅HTF 50 EMA
✅Intraday bullish breaks of structure to be identified
✅15’ order block identified
🔑 Remember, to participate in trading comes always with a degree of risk, therefore as professional risk managers it remains vital that we stick to our risk management plan as well as our trading strategies.
📈The rest, we leave to the balance of probabilities.
💡Fail to plan. Plan to fail.
🏆It has always been that simple.
❤️Good luck with your trading journey, I shall see you at the very top.
🎯Trade consistent, FRGNT X

Numerico ( NWC) Nwc usdt Daily analysis
Time frame daily
Risk rewards ratio >2.5
Nwc is a weak asset but it is good for daily trading. Nwc is not good for investment but great for short time trading

swing entry long in eurcadlets take this entry just using market stracture we have the market bullish

USDCHF FORECASTThe price may increase from here as we can see the market trying pull back from lower support and from few days there is bearish market here we can expect that market may change the movement and try for a bullish market. right now we can expect that market may reach till 1st resistance and if price breaks the resistance then we can expect that price may reach to 2nd resistance.

GBPNZD FORECASTAs we can see the price is nearest to resistance and and market is rejeting from here and price is trying to move downward from here. we can expect market will move in downward direction

New chart for AMD... Potential Levels to the Upside.Looking for potential short positions next week with September expirations.

Traders should consider going short if $SPY rises to $430Economic growth in the united states is projected to begin showing signs of slowing in the second half of the year. Potential double top coming near $430 on AMEX:SPY . This is also a 61.8% retracement from the high of 2021 to the lows of 2022. Taking a short position at September 15 expiration while hedging against the trade with a long call at June 16th expiration should make this trade go smoothly. This trade is not for low delta positions but 35 delta plus.

Eurusd weekly forecast Hello traders we are in a nice bull run strong push to the upside lets go to our lower time frame catch the trend let me know what you think new week new opportunity

gold signalhello traders gold is ready to make a move making nice symmetrical triangle means can broke to any side at the weekly zone gold will show us the dxn wait for 4hr candle close go to 5 min to enter your trade want to learn the Sause contact me i am happy to help

GBPJPY SELL LIMIT / RISK TO REWARD 1.6
For the next week, you can consider the specified range for sell.
Risk to reward 1.6

EUR/USD - Risk entry (Possible 1/9 RR) Market has produced one distribution schematic last week and it's currently printing one out near my POI. I'm look for market to give me an up thrust right into the 50% of my OB. It is a risk entry as the whole schematic hasn't been confirmed yet but it plays into my BIAS

ETH shifts bearish yet again. Long is not optimal right now.Everything is in the chart and linked idea, if any questions - just let me know. Thanks for your time)
📉 Text marks:
🔹 IL = impulse leg. Inside of IL we can usually see inside structure, which is secondary in nature, like a market noise, unless you trade it on LTF, as it’s own IL.
🔹 ph, pl = protected high or low, which holds current structural impulse.
🔹 bos = break of structure . Based on candle body close below/above previous structural impulse.
🔹 rsz, rdz = refined supply and demand zones. Specific areas to look for LTF confirmations. They are manipulative up-moves before real down moves, or vice versa. Strong hands (the Composite Man, as Wyckoff called it) often come back to such zones to close their manipulative orders at breakeven, before pushing prices further.
🔹 if confirmed = entry only if there's a shift of structure on lower TF inside of rsz or rdz, or any other type of backtested and approved confirmation.
🔹 liq target = liquidity target: next profit taking levels for strong hands, our main targets based on current price action.
👋 Disclaimer: All ideas here are for educational purposes only, not financial advice. Your trades are yours only, and your complete responsibility. I'm not particularly bullish or bearish on any given instrument, and I don't have a "fixed" bias. I'm just following the strategy I learned from my teachers and that's all. We can have completely different views on the market and still both make profits. Everything here should be treated as a simulation.
👉I believe a trader doesn't need to predict anything, so "right or wrong" mentality is a fundamental flaw of any beginner. A trader should find a system he's willing to work with long-term, hindsight test, backtest and then execute live. He's right only when he executes the system, and he's wrong only when he's taking random setups.
🚀Thanks for your BOOSTS and support🚀
💬Send your comments and questions below, share your ideas and charts, I'll be glad to talk to you💬

LONG POSITIONXAU/USD-GOLD
Long Term BUY As Per Above Given Chart or
You Can Also set Own Risk reward.
Let see what Will be Next Move.
Warning- I m Not a Financial Advisor this idea Only For Educational Purpose Only.
Thank You !
