FTM Possibility to LongFTM seems to retest the 0.33 USDT , the 1st resistance, then 0.37 USDT and 0.43 USDT
Before that FTM needs to break 0.29 USDT THE LOCAL RESISTANCE
FTM

FTM possible bounceMarket looks like it will stop falling for now. There is short term accumulation.


FTM- Fantom Attempting New Breakout 😺✌️new breakout attempt for FANTOM as it has just managed to breach over 0.2565 resistance.
At this stage we can be Long again over here with SL just below 0.253 and take profit at 0.2785 and 0.3050
DYOR, trading is not for most people.
One Love,
the FXPROFESSOR

FTM3S FTM price movement predictionFTM3S with possible bullish divergence
LOW VOLUME NODE identified on chart
BTC 1hr chart fighting against 50ma and price action below monthly resistance
DYOR - do your own research
price movement prediction
Price Prediction
not financial advice
this is for entertainment purposes only
always DYOR


Fantom (FTM) - July 2hello?
Traders, welcome.
If you "follow", you can always get new information quickly.
Please also click "Like".
Have a good day.
-------------------------------------
(FTMUSDT 1W chart)
Whether or not it can move higher than 0.6947 is crucial.
To do this, it is necessary to check whether it can be supported above 0.0160.
(1D chart)
The key is to find support and move higher above 0.2600.
If not, it is likely to lead to further declines.
When a wiggle up and down to the 0.3438-0.4254 section, it is expected that the ascent will begin to rise above 0.6947.
------------------------------------------------------------ -----------------------------------------------------
** All indicators are lagging indicators.
Therefore, it is important to be aware that the indicator will move accordingly as price and volume move.
However, for convenience, we are talking in reverse for the interpretation of the indicator.
** The MRHAB-T indicator used in the chart is an indicator of our channel that has not been released yet.
** The OBV indicator was re-created by applying a formula to the DepthHouse Trading indicator, an indicator disclosed by oh92. (Thanks for this.)
** Support or resistance is based on the closing price of the 1D chart.
** All descriptions are for reference only and do not guarantee a profit or loss in investment.
(Short-term Stop Loss can be said to be a point where profit and loss can be preserved or additional entry can be made through split trading. It is a short-term investment perspective.)
---------------------------------

💹FTM: on the way to the second target and...long traders trap?!Fantom is following my scenario. It`s almost not consolidate under the trendline and directly break it up. It`s a good sign of the bull strength.
After reaching the $0.30 key level and our first target price made local double top and break the trendline down. It would be too obvious to break this trend line with a strong dump, since after such a serious dump 2-3 weeks ago, not enough traders have accumulated for a trap.
There were a lot of buyers at the bottom and volume indicator confirmed it. During FTM growth we haven`t seen the huge volumes that confirms us the sellers presure.
So for the huge pullback and to entry the short we should wait for the local pump and the false breakout (liquidity collection) which can happen when the price reach our second target. This is the $0.34-0.38 value area. I don`t think that the pullback will be the deep but we to make 1:3, 1:5 RR we don`t need it.
✅This is the one out of severals scenarious and most possible of them so stay tuned to get more updates.
💻Friends, press the "like"👍 button, write comments and share with your friends - it will be the best THANK YOU.
P.S. Personally, I open an entry if the price shows it according to my strategy.
Always do your analysis before making a trade.

FTM In a local downtrendHello everyone, let's take a look at the 1H FTM to USDT chart as you can see the price is on the border of the uptrend line.
Let's start by setting goals for the near future that we can consider:
T1 - $ 0.3734
T2 - $ 0.3460
and
T3 - $ 0.3872
Now let's move on to the stop loss in case of further market declines:
SL1 - $ 0.2884
SL2 - $ 0.2698
SL3 - $ 0.2549
SL4 - $ 0.2412
and
SL5 - $ 0.2198
Looking at the CHOP indicator, we can see that in the 1H range we have less and less energy and the MACD indicator shows a local downward trend.


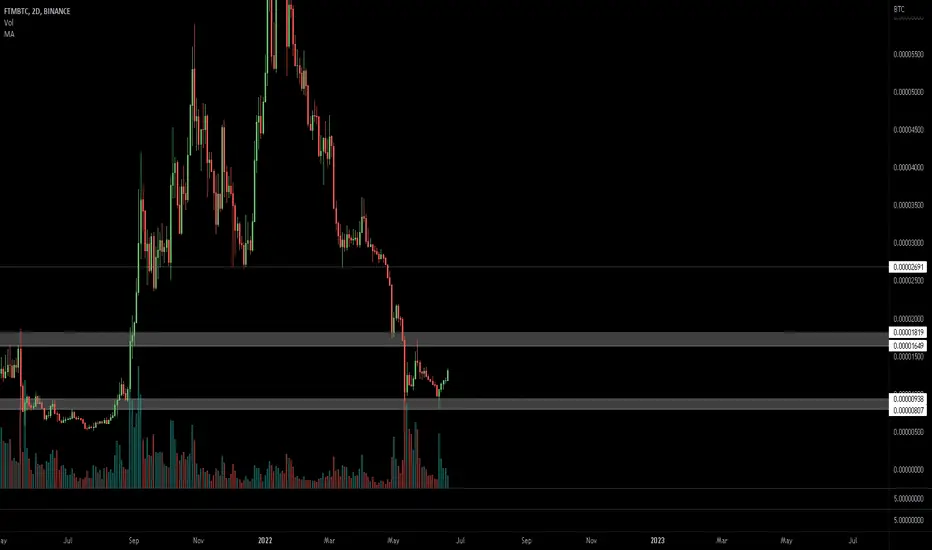
Fantom Adam & Eve Bottom Pattern Can Lead to 140%+We continue and this time Fantom (FTMBTC) is the altcoin pair at hand.
There are always so many signals and indicators to look at...
But the strongest of all signals is the market cycle.
If you can learn the market cycles you can know when everything will recover/bounce/move up.
Keeping track of the market cycles, once on a bullish wave we can also figure out all the peaks/highs and tops.
For FTMBTC, we have a strong RSI after a new low.
Prices trading above EMA21 and EMA10...
This is another chart setup with LOW RISK and HIGH POTENTIAL REWARDS.
You can find additional details (targets and stop-loss levels) on the chart.
Namaste.

FTMUSDT GOT REJECTION FROM TREND LINE ON SHORT TIME FRAMEFtm over all bullish but this time ftm got rejection from upper trend line.. now we where its stop

LONG FTM for 5X to 10X profits long term (2-6 months)$FTM is a very bullish lower cap coin. The coin definitely gives a BULL RUN when BTC STABLE and ALT Season Starts. In the previous 7 days, $FTM came back from 0.21 to 0.31, which means a 50% Gain already.
I could hold FTM for the Long term and my target will be 1.45 USDT, 1.69 USDT, 1.92 USDT
I am very bullish and expecting more than 10X profits from it with 2 to 6 months' hold
Let me know your thoughts

FTM/USDTFTM is going to touch 0.335
I got this coin at 0.25, and now i'm just watching its move
I hope u enjoy it 3>
Good Luck

$LINK massive opportunities! 2023-2024 $150-300 $LINK massive opportunities! 2023-2024 $150-300
Well... Maybe it sounds a bit too bullish, but so many altcoins are currently punished with a 90% drop. In the next few years we are really going to be amazed by the comeback even if it is not from other altcoins. But I am sure $LINK is not going to miss out on this rally. And then we are automatically looking at a new ATH.
With a LINK coin at $6 with possibilities of $150-300, that is a life changing opportunity. Of course, it is not a recommendation to buy anything, always do your own research. But like many other altcoins like $FTM and $ETH, I think these are opportunities you are not going to get again.


FTM/USDT - Potential Short ScenarioHello Traders!
FTM continues its downward price formation. Currently, the asset is testing the support level of $0.27.
The appearance of convergence on a two-day timeframe confirms the strength of a downtrend, the aggressive continuation of which will send the price to new support levels.
Soon we can assume that the downward movement will culminate in a withdrawal of $0.1025.
We can search medium-term entrances in the price range of $0.1025 - $0.1530.
The targets will be the price levels of $0.27 and $0.43
Good luck, and watch out for the market
P.S. This is an educational analysis that shall not be considered financial advice

FANTOM - Went well BUT....
Went well, great run but failed to go for the big test at 0.3049
Price might need to take a break and look for support 0.2565.
Not closing my Long positions today but i did cash out partially and strengthening my Short positions on other assets:
Let's be prepared for everything and anything. Been a GREAT last 3 days for Fantom..if you are a day tarder off course.
One Love,
the FXPROFESSOR

Fantom (FTM) formed bullish Gartley for upto 1808% big moveHi dear patrons, hope you are well and welcome to the new trade setup of the Fantom ( FTM ) coin.
Previously we had a nice trade of FTM:
Now on a monthly time frame, FTM has formed a big bullish Gartley pattern.
Note: Above idea is for educational purpose only. It is advised to diversify and strictly follow the stop loss, and don't get stuck with the trade

FTM 1h longSetup: In these kind of relief rally, you are looking to long crypto that outperforms BTC and has broken out of its accumulation phase. FTM is one of them. it has broken out of its accumulation range for both its US and BTC pairing with volume supporting it.
Entry: 0.29125
Trailing SL: Trial using the SAR indicator
TP: 0.36

$FTM, Trying for 1800 sats as the first important level$FTM UCTS signaled a new 1D Buy (up 13% since entry) on yesterday's close
I believe it is time for a relief bounce, which has not occurred this year.
Trying for 1800 sats as the first important level #FTM
Buy some FTM long it if possible FTM will flyBuy some FTM
FTM I looking good here though market is very scary 😨
Targets are open target sell at your wish
FtM will give u huge profits 📈

FANTOM - Updated ChartHello people!
back after a few days of resting (needless to say we were still actively trading and it ended up being a good period).
Instead of 'Fathers day' I do 'Father's Week' with my son who is 17 (I am 46 already, damn!).
Remember that the most important is family, health and the people near you..so go out there and buy them some Bitcoin at 20k these days.
Indices seem to be doing better, Feds last week said the rates will end up being around 3,5% not over 4% as we feared and the US Dollar seems to be taking a break.
Our analysis is more Bullish at this stage, given that BTC holds the 19-20k levels.
One Love,
the FXPROFESSOR
