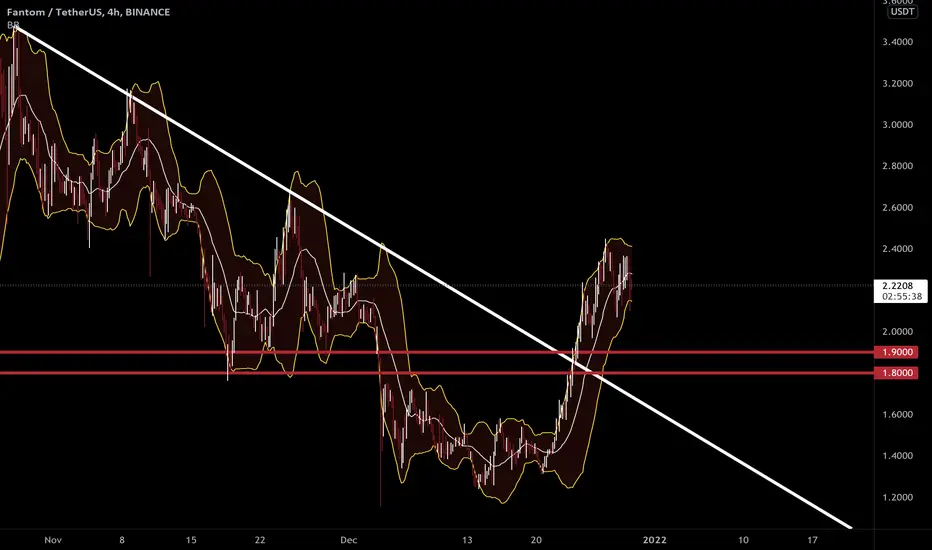
FTM - It can be prepared for a pullback to the trend lineOn a four-hour time frame, the negative trend line is broken, and now there is a weakness in the trend and a negative divergence, and it can be prepared for a pullback to the trend line. Enter for $ 1.9 and $ 1.8 targets if it re-tested.
FTMBTC
$FTM Fantom 4H chart updatelevels ww still
what a beast shoutout ct fr @eliz883 @ninjascalp put me on early
trimmed way too early lmao

Fantom Daily AnalysisFTM is at the resistance of a triangle and the most important level to determine if it's going to be bullish or bearish. If a daily candle closes above 2.4488 the higher target at $12 is reachable. In another scenario if this level gets rejected the right shoulder of a head and shoulders pattern will be formed and in case of losing the support at $1.4 next supports to hold the price are 0.94, 0.69 and 0.32.


FTM - Can it hit $9Hello Friends,
Nice rally in FTM, reaching new ATH.
Can we hit $9 ? Upside of the channel.
Not a financial advice. #DYOR

FTMUSDT Technical Analysis💎 FTMUSDT on H4 has broken above the descending triangle and the major resistance. After the Pullback and retest successfully It is expected that the price continues the bullish move to TP1 at 1.7069
🌐 Tradingview
💵 Invest Only 5% of your Portfolio
🎳 Entry/Pullback now or from 1.4881 - 1.2807
☕️ TP1 1.7069
🍺 TP2 2.0280
🍻 TP3 2.3576
🍾 TP4 2.6872
🍷 TP5 3.0000
🍸 TP6
🍹 TP7
🎁 TP8
🚫 SL SL 1.2494 - 1.0704
Good Luck 🎲

FTM IF WE GET A BEAR MARKET. ⚠CAUTION⚠In my last FTM analysis i showed how ftm could have seen it's top and was due for a correction and it played out (even tho i wish it didn't) as a ABC correction wave.
In todays analysis I will be showing possible future moves for FTM.
While The ABC correction in the last analysis we did (linked below/Chart beneath this statement) was correct, it seems that was only a smaller degree wave of a potential larger ABC correction to come.
Should Bitcoin lose its bullish structure, FTM could very well spiral into a 5-3-5 correction to complete a larger degree ABC correction as shown in the chart above. While I don't really see this happening and do think bitcoin will keep it's bullish structure, I can't overlook the possibility of this potential outcome.
Hope this helps with perspective and honestly hope the ABC was the correction and that we're done with it.

FTMStatic support of $ 0.9 to $ 1 is very important and I do not think we will miss it
But if we are going to reach the bottom of the canal for a long time ...
The head-to-shoulder pattern is created in which the right shoulder is probably at a point with the descending trend line
.
.
If you have any questions, you can write it in comments below, and I will answer them
And please don't forget to support this idea with your like and follow, thank you...

FTM huge potential in Long-Term (2500%)...FTM is Fundamentally one of the best projects and Technically is in a good uptrend...
Long Term target of this project may be around $50...
Please Do Your Own Research(DYOR) before taking action...

Fantom Grows by 12,400% Since January | Long-Term Winners!Fantom (FTMBTC) is not to be outdone by the other big winners and has grown a massive 12,400% since January 2021, WOW!
The way the chart is looking now there is room for additional growth.
I am sharing these charts today in order to try and bring some awareness into the bigger picture.
We need to think long-term.
Plan long-term.
Trade long-term if we want to win in this game.
When you really have experience, 3-5 years earning trading Spot, you can move up to margin/leverage/futures and so on.
But, you need to be successful being patient first.
If you can't make money in 3 years you won't be able to make it in 24 hours.
People want to make money fast, earn within a week and sometimes in just a few days, that's their idea.
But instead they have been losing money for years and there is absolutely no gain.
Focus on getting out in profits first, regardless of how long it takes.
Once you have been a winner for long, you can consider winning right away.
Namaste.

FTMUSDT Technical Analysis⏳ Spot
💎 FTMUSDT has just broken above the descending triangle. The retest has been successful and the price is moving up after the pullback. The first target would the first resistance
🌐 Tradingview
💵 Invest Only 5% of your Portfolio
🎳 Entry/Pullback now or from 2.4287 -2.1502
☕️ TP1 2.7725
🍺 TP2 3.2584
🍻 TP3 3.7147
🍾 TP4 1.81024
🍷 TP5 4.2000
🍸 TP6
🍹 TP7
🎁 TP8
🚫 SL 2.1502 - 1.8539
Good Luck 🎲
Check the Links in Description and if you LIKE this analysis, please support our page and Ideas by hitting the LIKE 👍 button. ❤️ Your Support is really appreciated! ❤️
Traders, if you have your own opinion about it, please write your own in the comment box. We will be glad for this.
Feel free to request any pair/instrument analysis or ask any questions in the comment section below.
We will have more FREE forecasts in TradingView soon
Have a profitable day 😊👍🏻

FTM 2H BUYFTM 2H support is at ~$2.1
Enter 50% here
and try to set some buy orders near the support zone
If FTM holds above the trendline,
the Take-Profit target would be $2.31, $2.52, and $2.94
Cheers

FTM longFANTOM bounced off the multi-month support level. Bullish movement to resistance at recent ATH is likely to happen.

#fantom fantom #ftmusdtRSI says that it will move to my buy zone. So You have to take order in my zone and than sell as per your convenience.
peace out traders

ftm long swing ~daily buy signal confirmed.
i think ftm is going to out perform some of the other projects, since this is the last leg.
last legs usually end up in a blow off top scenario.
i'm willing to hold this as high as it's willing to go, moving my stops up as i go.
now that duck season is over, it's time for alt season.
wave 5 target = $7.2


FANTOM - A good way to Buy the 'Black Friday Crypto discount' 🧙Correction took place, we got stirred BUT not too shaken and perhaps it is time to 'Buy yet another Dip'. After all, this correction felt a bit like a 'Black Friday' kind of discount before we enter the Xmas season.... 'it's all about sales' as a theory proposes.
FANTOM has been one of our favorite posts the last 2 months and yes, it went really well.
We have explained before the 'Why' (just check our previous posts below).
If you are not convinced just try the speed and low cost of an Opera network transaction; you will be impressed.
Let's Go FANTOM!
the Fantom of TA, aka FX PROFESSOR 🧙♂️

FTMUSD Bearish trend continuationIn two days we have done -22.67%.The immediate bearish volatility can imply. In the short term this might be confirmation of a lower high.
If we break the next resistance trendline. Then we might be closer to hitting our -35% target as analyzed in the linked chart.

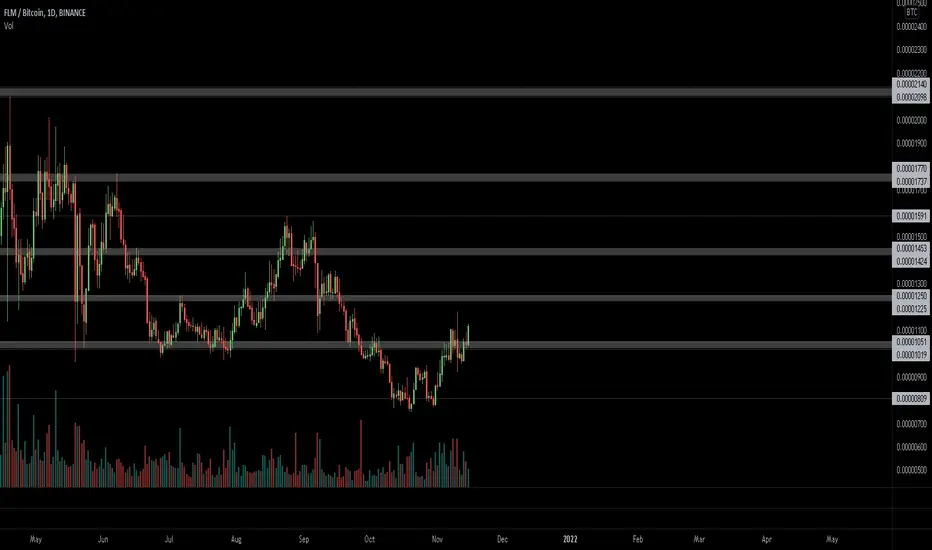
$FLM, Trying to get traction from a reclaim of the ~1k sats $FLM
Trying to get traction from a reclaim of the ~1k sats level
UCTS 1D Buy signal active (usually strong)
Long, aiming to ~1250sats as 1st target
#FLM
#FTM Fantom Lower High on DailyFantom (FTM) on the 1D chart shows a lower high. I charted a few trendlines to consider keeping an eye on along with a fib retracement.
What are your thoughts? Comment below, hit the like and follow me. Thank you!
Disclosure: This is just my opinion and not any type of financial advice. I enjoy charting and discussing technical analysis . Don't trade based on my advice. Do your own research! #cryptopickk #bitcoin #altcoins

FTMUSDT : WILL FTM HIT 10$ SOON ? Fantom is a highly scalable blockchain platform for DeFi, crypto dApps, and enterprise applications.
Described as an acyclic graph (DAG) smart contract project which offers decentralized finance (DeFi) services to developers utilizing its own bespoke consensus methodology.

FTM/USDT 4HOUR UPDATE Welcome to this quick ftm/usdt analysis.
I have tried my best to bring the best possible outcome me in this chart.
Reason of trade :- ftm/usdt is a bullish signal 50ma bounce
Entry:- CMP buy the green zone
Traget:- 30% to 50%
Stoploss:- $2.52
Remember:-This is not a piece of financial advice. All investment made by me is under my own risk and I am held responsible for my own profit and losses. So, do your own research before investing in this trade.
Happy trading.
Sorry for my english it is not my native languages.
Do hit the like button if you like it and share your charts in the comments section.
Thank you...

FTM/USDT 1HOUR UPDATEWelcome to this quick
FTM/USDT analysis.
I have tried my best to bring the best possible outcome me in this chart.
Reason of trade :- FTM/USDT is Look bullish buy the dip green zone.
Entry:- $3.01,$3.05
Traget:- 10% to 15%
Stoploss:- $2.91
Remember:-This is not a piece of financial advice. All investment made by me is under my own risk and I am held responsible for my own profit and losses. So, do your own research before investing in this trade.
Happy trading.
Sorry for my English it is not my native languages.
Do hit the like button if you like it and share your charts in the comments section.
Thank you...
