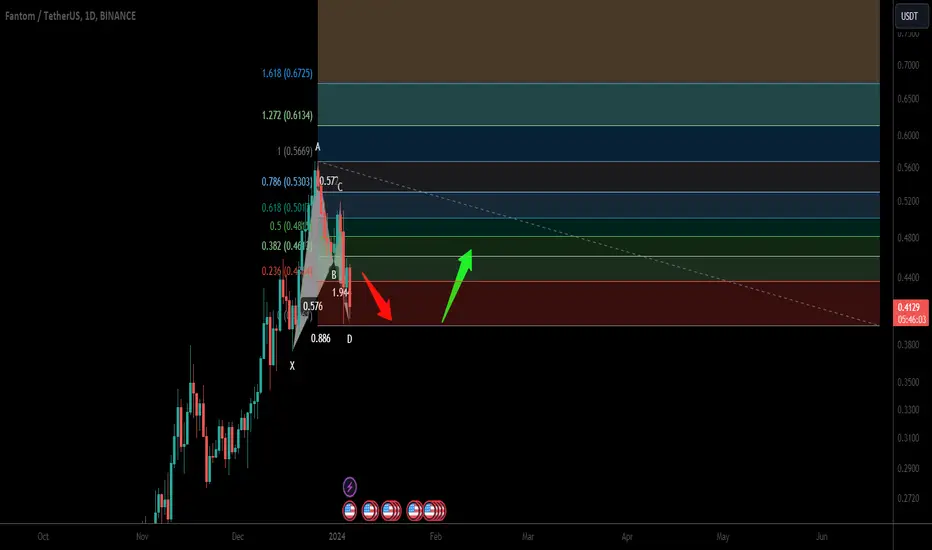
FTM after the pullback will continue the uptrend FTM after rejection from the key resistance zone and the pullback will continue the uptrend
🔵Entry Zone 0.4876 - 0.5084
🔴SL 0.4571
🟢TP1 0.5488
🟢TP2 0.6384
🟢TP3 0.7554
Risk Warning
Trading Forex, CFDs, Crypto, Futures, and Stocks involve a risk of loss. Please consider carefully if such trading is appropriate for you. Past performance is not indicative of future results.
If you liked our ideas, please support us with your likes 👍 and comments.
FTMBTC

FTM/BTC - Fantom: Failure Swing◳◱ On the $FTM/ CRYPTOCAP:BTC chart, the Failure Swing pattern suggests momentum building up for a significant move. Traders might observe resistance around 0.00000841 | 0.00000871 | 0.0000094 and support near 0.00000772 | 0.00000733 | 0.00000664. Entering trades at 0.00000806 could be strategic, aiming for the next resistance level.
◰◲ General info :
▣ Name: Fantom
▣ Rank: 73
▣ Exchanges: Binance, Kucoin, Hitbtc
▣ Category/Sector: Infrastructure - Smart Contract Platforms
▣ Overview: Fantom, founded in 2018, is a Layer 1 project that uses a single consensus layer to support the creation of multiple execution chains. FTM, the project's native token, is used for payments, governance, and ongoing block rewards sent to validators and delegators who stake FTM. The network's independent consensus layer, called Lachesis, features a novel consensus mechanism developed by the Fantom Foundation dubbed the "Lachesis Protocol." Lachesis can provide security to multiple other layers, the first of which is Fantom's EVM-compatible smart contract chain called Opera. The project's goal is to host an ecosystem of execution layers while enabling them to feature fast and cost-efficient transactions derived from the benefits of the proprietary Lachesis Protocol.
◰◲ Technical Metrics :
▣ Mrkt Price: 0.00000806 ₿
▣ 24HVol: 27.467 ₿
▣ 24H Chng: 3.599%
▣ 7-Days Chng: 2.63%
▣ 1-Month Chng: 22.76%
▣ 3-Months Chng: 32.72%
◲◰ Pivot Points - Levels :
◥ Resistance: 0.00000841 | 0.00000871 | 0.0000094
◢ Support: 0.00000772 | 0.00000733 | 0.00000664
◱◳ Indicators recommendation :
▣ Oscillators: NEUTRAL
▣ Moving Averages: STRONG_BUY
◰◲ Technical Indicators Summary : BUY
◲◰ Sharpe Ratios :
▣ Last 30D: 3.83
▣ Last 90D: 1.55
▣ Last 1-Y: 0.10
▣ Last 3-Y: 0.68
◲◰ Volatility :
▣ Last 30D: 0.60
▣ Last 90D: 0.93
▣ Last 1-Y: 0.89
▣ Last 3-Y: 1.45
◳◰ Market Sentiment Index :
▣ News sentiment score is N/A
▣ Twitter sentiment score is 0.54 - Bullish
▣ Reddit sentiment score is 0.53 - Bullish
▣ In-depth FTMBTC technical analysis on Tradingview TA page
▣ What do you think of this analysis? Share your insights and let's discuss in the comments below. Your like, follow and support would be greatly appreciated!
◲ Disclaimer
Please note that the information and publications provided are for informational purposes only and should not be construed as financial, investment, trading, or any other type of advice or recommendation. We encourage you to conduct your own research and consult with a qualified professional before making any financial decisions. The use of the information provided is solely at your own risk.
▣ Welcome to the home of charting big: TradingView
Benefit from a ton of financial analysis features, instruments and data. Have a look around, and if you do choose to go with an upgraded plan, you'll get up to $30.
Discover it here - affiliate link -

Fantom soon ready for 33% move!? - longDaily trend is broken.
But we see some resistance from 20 moving average for FTM/USD and FTM/BTC pair
If we break the 20 MA with a solid candle buy the retest and you should have a good entry for FTM.
The idea is that FTM will find some momentum after 20 MA is broken - Zoom in on lower time to reduce the risk and find that perfect entry.
I see a potential 33% trade here

The danger in the FTMUSDT chart!!!Firstly, what I'm about to convey is not to be considered as investment advice; it's merely a cautionary note. When examined on a 4-hour timeframe, a significant and noticeable Head and Shoulders (H&S) formation is observed in the FTMUSDT chart. The first indicator supporting this formation is volume. Upon examining the volume, you can notice a visible loss of strength. To further confirm this, if you want to be more certain, compare the volume of the candles forming the left shoulder to the volume bars forming the right shoulder. You'll see that the left shoulder's candle volume is stronger, whereas the current right shoulder has lower volume. We also supported this with our second indicator, which is the RSI (Relative Strength Index). There is a noticeable decline in strength in the RSI as well. In summary, while these three signals don't definitively predict a downturn, they indicate that FTM could be significantly impacted in the event of a potential market decline. If you hold it, please exercise caution. Good day and profitable trading.

Fantom - dead or alive - Long!I think too much airdrop farming and Bitcoin ETF talk have have moved the attention from Fantom blockchain.
I think Fantom is cheap, really cheap.
I marked the yellow Fib-levels in the chart as buy the dip zones for FTM.
I really think NOW is a good opportunity to buy Fantom.
Fantom Sonic testnet performed 0.5s to finality last week. Is there any other chains with that speed? Am I missing out something, please let me now?!
With close to 100% uptime and that speed - I don't see any reason for why Fantom not will start to move in price again.
I have patience and think the trust to Fantom (and the users) will come back again. I will play the long game!
My wild FTM prediction for Q1:
1. First Sonic release and then...
2. airdrop hype and meme-coin-rally and then...
3. FTM price explosion
I will come back to this post in Q2 and see if it aged well!

Trade signal | Fantom (FTM) a setup for upto 41.50% rallyHi dear friends, hope you are well and welcome to the new trade setup of the Fantom (FTM) coin with US Dollar pair.
Previously we caught almost 100% pump of FTM as below:
Now on a daily time frame, FTM has almost completed a bullish BAT move for the next pump.
Note: Above idea is for educational purpose only. It is advised to diversify and strictly follow the stop loss, and don't get stuck with trade.
FTM BUY SETUPFTM has an ascending structure. If it reaches the green range, we will enter the buy/long position.
Pay attention, we are only looking for buy/long positions on the green range and we will not enter positions in higher areas
Closing 1 daily candle below the green range will violate the analysis
The targets are clear on the chart. for risk management, please don't forget stop loss and capital management
When we reach the first target, save some profit and then change the stop to entry
Comment if you have any questions
Thank You

FTM ANALYSISBy examining the FTM waves, it appears that the formed pattern is a diametric one. From the green range it can step to complete the G wave. It takes some time to complete the F branch.
What the chart tells us is that the phantom rise will continue. The resistance range is the two red lines that I have marked.
For risk management, please don't forget stop loss and capital management
Comment if you have any questions
Thank You

#FTM/USDT#FTM
The price has been moving in a descending triangle since last February
The price gained support at 0.1730
The price is expected to break the downtrend at the current price
First target : 05160
Second target : 0.6555
Which represents 200% of the current price
With an oversold presence on the MACD
✅Thank you, for more ideas, hit 🚀 Like❤️ and 🌟Follow🌟!

//\\ Charming FTM //\\Will we see the terrifying rise of the FTM and its ecosystem? The ecosystem updates are very interesting and you can see the climb on the weekly chart, is FTM close to the following numbers?
$2 ,
$3 ,
$5 ,
$6 ,
$9 ,
$12

ftm flyFTM has been falling like the rest of crypto, but the price failed to fall through the main bullish support of the last few weeks.
In my view, this gives us a nice opportunity to play the bounce with a clearly defined stop and profit target

Fantom (FTM) coin completed setup for upto 26.50% pumpHi dear friends, hope you are well and welcome to the new trade setup of the Fantom (FTM) coin with US Dollar pair.
Our last successful trade of FTM was the below one, and it was almost 44% pump:
Now on a daily time frame, FTM has formed a bullish Gartley move for the next pump.
Note: Above idea is for educational purpose only. It is advised to diversify and strictly follow the stop loss, and don't get stuck with trade.

FTM daily 🔥 FTM is very nice, with great marketing, I hope you only see green candles and the news of its ecosystem will come out soon, everything will be compared to Bitcoin.

Next weeks for FTM#FTM is very nice, with great marketing, I hope you only see green candles and the news of its ecosystem will come out soon, everything will be compared to Bitcoin.
🔜🔥

Quick Update FTM Quick and short term update from FTM, the market is taking a break as we have talked about before and the next stage of the climb will be realized soon, the market is ready and the critical point of the FTM is 24 cents, as long as it is above this number it is possible to climb was hopeful.
#FTM

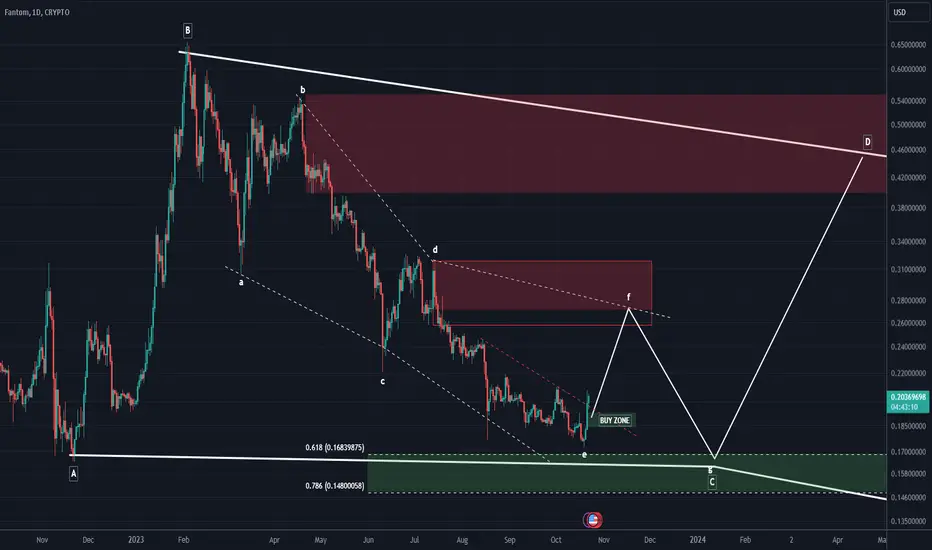
The FTM chart is amazing!The FTM symbol is inside a very large structure. Wave C of this large structure is a diametric, whose sides I marked with dashed lines. Now wave e is ending and we are entering wave f.
The Fibonacci on the chart is the ratio of wave A to G of the diametric pattern that I marked with a dashed line, and it is expected that wave G will end in this area in the future.
We expect the completion of the drawn movements from the FTM as shown.
For risk management, please don't forget stop loss and capital management
Comment if you have any questions
Thank You
🔥 FTM Daily 🔥I hope the market will remain bullish, the indicators are showing signs of growth.
This is not an investment offer
FTM DAILY

🔥 FTM 🔥Bull 🔥
Macd 🔥
Rsi 🔥
I hope the market will remain bullish, the indicators are showing signs of growth. This is not an investment offer

Fantom (FTM) long - big breakout soon!?FTM are squeezed between the daily 20 MA and 200MA, and at the same time the weakly trend are about to break to the upside. It could lead to big move to the upside.
If a weekly trend break will be confirmed, I don't think it takes much time before we can see a 100% move.
Zoom in to smaller time frames to find a perfect entry with lower risk and adjust your stop loss according to your trading style.
The main idea is - big move is probably coming for Fantom - prepare to catch it
The idea in the chart have risk/reward ratio 6, with potential 100% profit

FTM has a dropWe have reached the weekly resistance and weakness can be seen in the upward trend. A liquidity pool is created under the candles.
It is expected that the liquidity pool will be broken and we will move towards the green box
For risk management, please don't forget stop loss and capital management
Comment if you have any questions
Thank You

FTM doom predictions and golden opportunityFTM looks bearish.
Expecting a small bounce and getting rejected from the resistance .
Many altcoins have started making new lows so we believe that FTM will catch up and 0,1590 support will fail.
Looking for a buy orders in the green area:
0,055 - 0,038 usd
Long way to go. FTM may drop another 80 % from the current levels.
2 possible scenarios are shown on the chart.
Short it at the resistance or wait for a price to reach the buy zone .
Do you agree? Feel free to leave a comment

FTM ANALYSIS (1D TF)Examining the waves, I found that FTM inside a time-consuming diametric. This corrective diametric is large and time consuming and is related to the daily time frame. Now, we seem to be inside this diametric wave E, which itself is a diametric. I have drawn the expected movement path from FTM on the chart. I have such an expectation from FTM.
For risk management, please don't forget stop loss and capital management
Comment if you have any questions
Thank You

FTM 1DThis is my final analysis on FTM long and short term. The price of the floor covering and the most important support of FTM is 15 cents. If this support is broken, we will have a 50% drop
MOTHER ALL SUPPORT 15C
