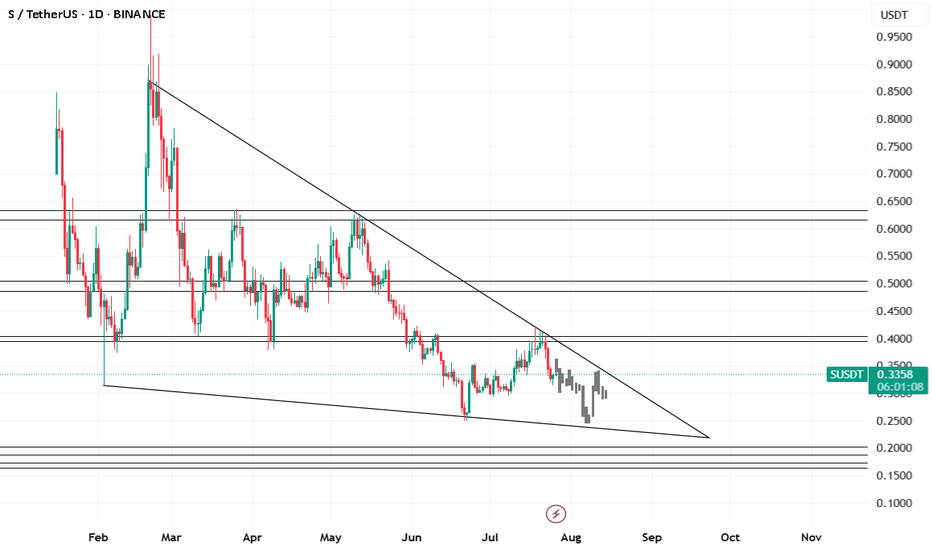
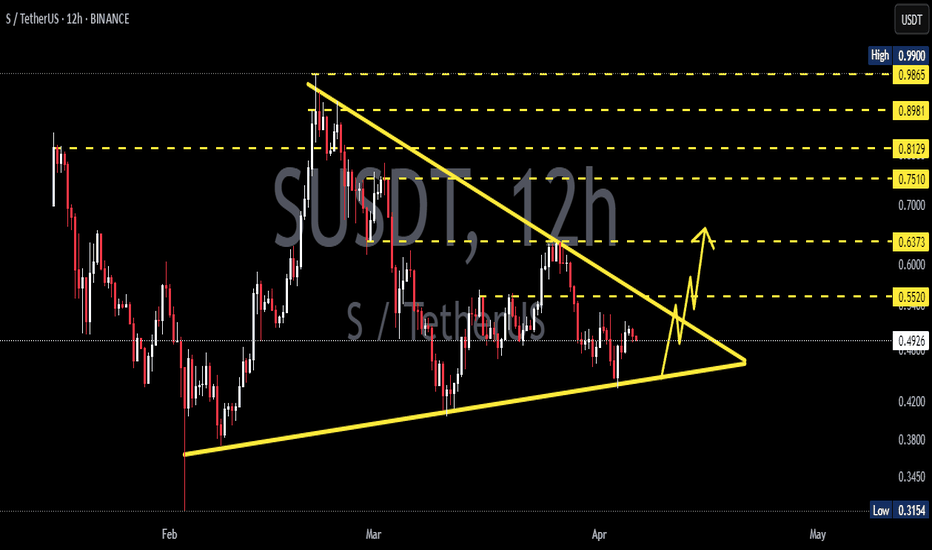
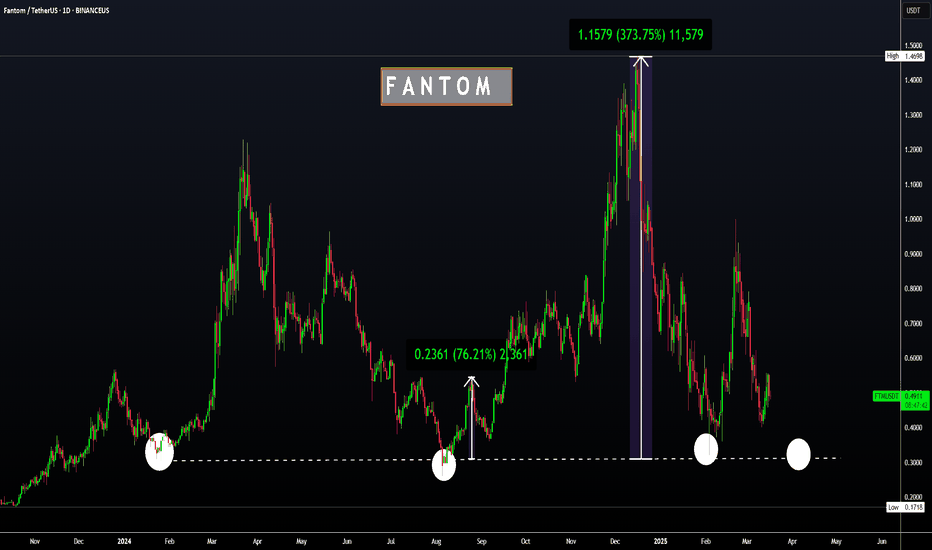
S - SONIC 1DSonic lacks the buying volume to break through its resistances.
The project, after a name change, has become Matic 2.
I expect that we'll soon reach support levels of 30 cents and 25 cents after the pullback is complete. If these supports are broken, the next support levels will be 20 cents and 17 cents.
If the 40 to 43 cent resistance breaks with high volume, there's a possibility of growth to 50 cents. If 50 cents is broken, growth to 63 cents becomes possible.
Ftmusd
S (Ex FTM) UpdateS is Preparing for a Key Liquidity Grab and Potential Reversal
Previously, S swept the liquidity from the upside and formed a zig-zag corrective structure within a descending channel. Following a clean breakdown, it has struggled to recover — despite broader bullish conditions in the market.
Now, the structure is showing strong signs of a potential long-side liquidity grab in the coming days or weeks. This setup often marks the final phase of accumulation before a major upside move.
Additionally, the price action aligns perfectly with Fibonacci extension levels, particularly around the $0.38 zone, which could act as a key support and entry area for long positions.
A decisive reaction from this zone could trigger the beginning of a strong reversal, leading to the next impulsive leg.
— Thanks for reading.
FTM Delisting | OFICIALLY Becoming SONIC (S)Although a name change for FTM was announced in Aug 2024 already, many exchanges still list FTM, and this will soon change.
It is expected the Fantom will officially be delisted and become SONIC within the next two months.
In August 2024, Sonic Labs announced that they would be replacing Fantom with a new token called Sonic (S). Sonic Labs have confirmed that all existing FTM holders would be able to convert to S at a fixed rate of 1 FTM : 1 S. However, many exchanges will only transfer now, as they will finally be delisting FTM for good and converting all FTM S. This will be done at a conversion rate of 1:1.
_________________________
Make sure you don't miss the latest ETH update, since BTC is likely heading towards a new ATH and ETH stands much more to gain.
_________________
CRYPTO:SONIUSD
POLONIEX:FTMUSDT
FTM - Time to Lock In for a 2x Ride to $1?Fantom ( UPCOM:FTM ) is sitting on its key floor support zone. A level that has historically triggered 50% to 100% pumps. Now, price is coiling within a triangle and looks ready to break out.
Could this be a start of a run to $1?
Let me know your thoughts below!
Kindly support this idea with a LIKE👍 if you find it useful🥳
Happy Trading💰🥳🤗
FTM/USD 1D ChartHello everyone, let's look at the 1D FTM to USD chart, in this situation we can see how the price is moving in a descending triangle where we are approaching the moment of trying to choose the direction in which the price can go further.
Let's start by defining the targets for the near future that the price has to face:
T1 = 0.66 USD
T2 = 0.81 USD
Т3 = 0.93 USD
Now let's move on to the stop-loss in case the market continues to fall:
SL1 = 0.44 USD
SL2 = 0.31 USD
SL3 = 0.21 USD
If we look at the MACD indicator we can see a return to a local downtrend, however we are still in a place where the trend can reverse and surprise us with growth.
SUSD 4H Chart – Easy Trend with RSI Signal!SUSD on the 4H chart is in a steady uptrend within a channel since February. After a drop to the 0.285 level, it’s now at 0.382, sitting near the channel’s midline. RSI is at 54.26, showing neutral momentum—room to move either way. The yellow line suggests a potential push to the channel top at 1.0000000 if the trend continues. On the downside, 0.3500000 is key support to watch.
ALTS Shine, +55% INCREASE !! FTM | RNDR | Render and Fantom have made steep increases over the past two weeks.
In the past two weeks, FTM increased a whopping 55%:
And RNDR increased around the same amount:
This naturally makes it likely to see a correction soon, which may be the ideal time to get into the accumulation boat - or just for a swing trade.
________________________
GEMINI:RNDRUSD CRYPTO:FTMUSD
FTM | FANTOM | Altcoin with GREAT UPSIDE POTENTIALFTM has recently increased 11% in the weekly, but is making more red candles in the daily and the impulse up seems to be over for now.
Looking at the corrections, from -45% to -80% is not uncommon for Fantom.
The good news, is that the bottom is likely close - and from here, there exists great upside potential.
I am NOT saying we can't fall lower here - infact, a full retracement may be likely, just as we saw the previous cycle. In which case, the upside is even bigger. 30c is indeed a very popular demand zone:
_____________________
BINANCEUS:FTMUSDT
FTM/USD 8H possible correction?Hello everyone, let's look at the 8H FTM to USDT chart, in this situation we can see how the price has broken out of the local downtrend line, which it is currently moving above.
Let's start by defining the targets for the near future that the price must face:
T1 = $0.75
T2 = $0.86
Т3 = $1.02
Т4 = $1.19
Now let's move on to the stop-loss in case the market continues to fall:
SL1 = $0.60
SL2 = $0.49
SL3 = $0.42
SL4 = $0.32
It is worth looking at the RSI indicator, which shows how strongly we have broken out of the upper limit of the range, moreover, here we can see how we have touched the level of 81, at which price rebounds were previously visible.
FTM low time frame update#FTM pattern tells us that the market is ready for a big rise
the pattern was a bind of an uptrend and a down trend the down trend wanted some liq to be stopped and it took this liq from stop losses and now its hungerness is done !
just because of the bearish pattern in the whole market we have 2 scenarios once is rising from here and the other one is rise after another down
there is a real positive pattern in higher time frames check this out
FTMUSDT BULISH FTMUSDT is looking bullish after a significant bearish period, and I believe the targets are quite achievable. I’m confident about most of them!
Here are my other ideas:
Reversal for Sonic has commencedSeems like 50 cents has some iron wall defending it and now double bottom at 50 cents was established, allowing those who wanted to exit to do so (capitulation), based on the volume.
We now have made a clean reversal on the hourly.
Next targets are the launch high, which is a nice take profit target to those on long positions, but i expect overall trajectory to be higher.
FTM long term update#FTM made a rising pattern in long term
wave 1 is made the wave 2 is like ABCDE which is completed now the market is heading to the 3rd wave this can make the market reach its last highs in past
there was a huge liq at the bottom of the chart which the market took it i think there is no reason for going down again !
FTM 1DHello, as you can see, the situation of Fantom is very bad and the important support that started from the bottom of 25 cents is breaking. I expect a drop until January 16th until it is listed again on all exchanges.
In any case, if we go below 66 or 65 cents, we can reach 35 or even 33 cents.
My personal opinion is a bearish scenario. I don't have much hope for price growth.
#FTM/USDT Ready to go higher#FTM
The price is moving in a descending channel on the 1-hour frame and sticking to it well
We have a bounce from the lower limit of the descending channel, this support is at 0.7824
We have a downtrend on the RSI indicator that is about to be broken, which supports the rise
We have a trend to stabilize above the moving average 100
Entry price 0.7826
First target 0.8170
Second target 0.8634
Third target 0.9046
#FTM/USDT Ready to go higher#FTM
The price is moving in a descending channel on the 1-hour frame and sticking to it well
We have a bounce from the lower limit of the descending channel, this support is at 0.6900
We have a downtrend on the RSI indicator that is about to be broken, which supports the rise
We have a trend to stabilize above the moving average 100
Entry price 0.7300
First target 0.7735
Second target 0.8078
Third target 0.2490
Bad news FTM holders markets require more blood sacrificeThe price action of the past few days from the latest bottom of 66 cents seems to have been a bearish retest.
the massive long term support has turned into resistance
the bearish retest has been completed
now down again
RSI also has hit resistance.
more blood more pain
the bit question is when after 68-69 cents is reached:
double bottom confirmation and bottom is in, with rising RSI
or
max pain, max blood scenario of visiting 53 cents with also rising RSI, forming a bullish divergence?
the second part remains to be seen in several days
first part is clear
more blood from FTM holders
sorry, bulls
This is a SHORT-TERM analysis only
FTM: The prospect of increasing?BINANCE:FTMUSDT
As you can see, FTM has created an ascending head and shoulders and is also located in the megaphone, which means that if it breaks, we expect the price to reach the target (AB=CD).
✨Traders, if you liked this idea or have your opinion on it, write in the comments, We will be glad.
_ _ _ _ __ _ _ _ _ _ _ _ _ _ _ _ _ _ _ _ _ _ _ _ _ _ _ _ _ _ _ _
✅Thank you, and for more ideas, hit ❤️Like❤️ and 🌟Follow🌟!
⚠️Things can change...
The markets are always changing and even with all these signals, the market changes tend to be strong and fast!
FTM strong bounce …will continue ?FTM / USDT
#FTM has news regarding its rebranding to #S which affected the price heavily in past few days
Currently it shows great bounce
stability here = going for these targets
Lose red level in HTF = invalidation of bullish setup
Bearish monthly for FTM S more dump incomingFTM S monthly broke through critical support on the HTF and is now poised for further downward correction. Don't worry, maybe when they launch new charts with S, it will not be visible. We will, however, remember...
FTMUSDT - All eyes on Sonic!Weekly chart displays A very strong support level where the price is expected to rebound significantly, located at the 0.75 area
This zone converges several weekly supports, including the 50 EMA, the 0.5 Fibonacci level, and the upper side of the symmetrical triangle pattern.
accumulation is suitable now and up to the 0.7 level.
On January 13, 2025, the token will automatically be rebranded to (S) , meaning Sonic .
This represents an upgrade to the FTM token, similar to what happened with RNDR transitioning to Render .
This is a significant update to FTM’s infrastructure to align with leading projects in the space.
And as a token supported by Dubai, you can be confident in its bright future.
Buy between: 0.8 - 0.7
Targets: 1 - 1.6 - 3.5 - 7.5 - 21
Best regards Ceciliones 🎯


