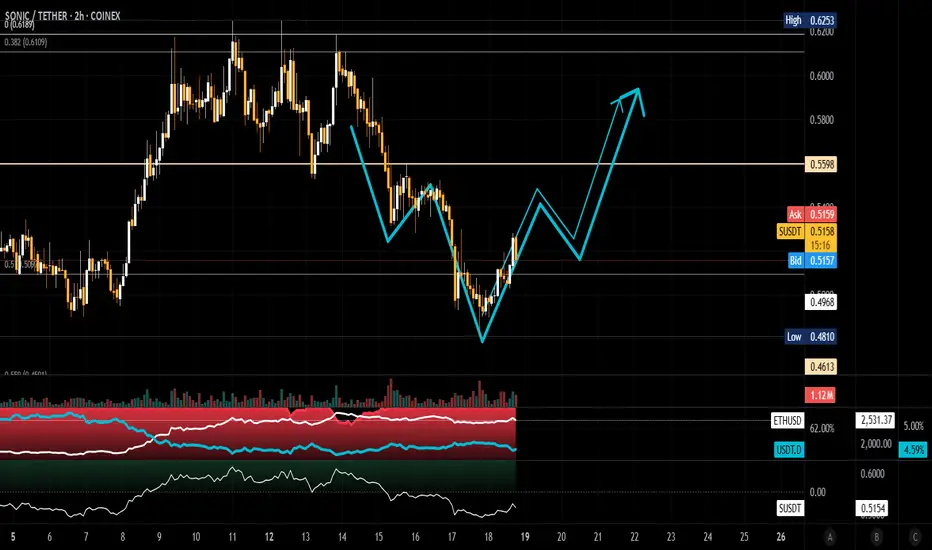
Sonic pull back - opportunity comingSonic - are we going for a deep pullback?!
If so...
We have confluence for a bonce - MA 200 (4h), Fib 0.618, Diagonal trendline.
I think Sonic cold respond nicely in the area 0.324-0.332 and after that move on for higher target (0.4).
FTMUSDT

Long Sonic (S) - before altcoin seasonSonic (S) - One of the strongest coins when it comes to fundandamentals.
Now listed on Coinbase. I expect more good news to come soon.
The risk reward now is incredible good for investors.
I think it is likely that we will see a bounce between 0.30-0.31 to set a higher low. that could be a killer entry before the altcoin season kicks off.
My idea is to buy and hold
I see 0.30 as a really good long term investment entry.
No financial advice.

S (Ex FTM) UpdateS is Preparing for a Key Liquidity Grab and Potential Reversal
Previously, S swept the liquidity from the upside and formed a zig-zag corrective structure within a descending channel. Following a clean breakdown, it has struggled to recover — despite broader bullish conditions in the market.
Now, the structure is showing strong signs of a potential long-side liquidity grab in the coming days or weeks. This setup often marks the final phase of accumulation before a major upside move.
Additionally, the price action aligns perfectly with Fibonacci extension levels, particularly around the $0.38 zone, which could act as a key support and entry area for long positions.
A decisive reaction from this zone could trigger the beginning of a strong reversal, leading to the next impulsive leg.
— Thanks for reading.

updateIs Sonic forming an ascending triangle? Sonic is acting confusingly and the market maker is probably planning a big rally after collecting all of Sonic from the public.
S = 55$
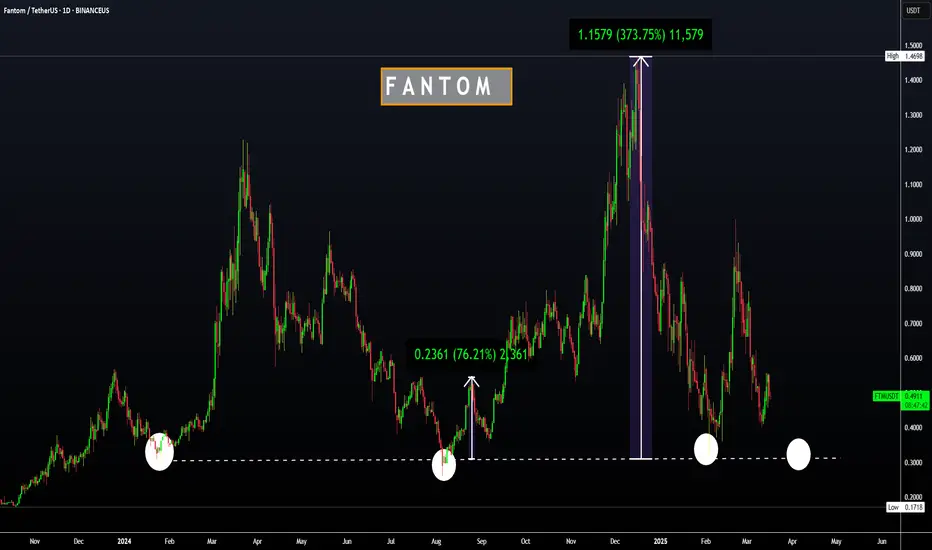
Fantom (FTM/USD) Target: $3Fantom (FTM/USD) shows a classic cup and handle breakout setup forming around the $0.57–$0.59 buy zone. The breakout looks strong, backed by volume and bullish momentum.
📈 Buy Zone: $0.57–$0.59
🎯 Target: $3
⏳ Timeframe: 4–6 months
🔄 Pattern: Cup & Handle
💡 Note: A breakout above $0.63–$0.65 could confirm the next wave.

SUSDT - This opportunity might not come around again.!All tokens built on the Ethereum network pumped yesterday as ETH moved up by just 4%, and SONIC (S) stood out as the top performer among them, surging by around 22%.
Currently, the coin has formed a symmetrical triangle pattern, which has been broken to the upside with a massive green candle. It's now retesting the 0.382 Fibonacci level — a key zone to watch for continuation.
This is a massive investment opportunity to buy the token at around $0.55 only.
The long-term targets for S in 2026 are insane — the most conservative target for now is $1.20.
Best regards Cecilion🎯

S (EX FTM) Update (4H)Like many other altcoins, S has formed an Inverse Head and Shoulders pattern, signaling a potential trend reversal.
Additionally, a bullish flag formation has broken out on the lower timeframes, further confirming the upward momentum.
The current price structure appears suitable for long positions, especially with confluence from multiple technical signals.
A conservative target lies around the $0.64 level, based on the measured move projections from the flag and neckline breakouts.
— Thanks for reading.

FTM Delisting | OFICIALLY Becoming SONIC (S)Although a name change for FTM was announced in Aug 2024 already, many exchanges still list FTM, and this will soon change.
It is expected the Fantom will officially be delisted and become SONIC within the next two months.
In August 2024, Sonic Labs announced that they would be replacing Fantom with a new token called Sonic (S). Sonic Labs have confirmed that all existing FTM holders would be able to convert to S at a fixed rate of 1 FTM : 1 S. However, many exchanges will only transfer now, as they will finally be delisting FTM for good and converting all FTM S. This will be done at a conversion rate of 1:1.
_________________________
Make sure you don't miss the latest ETH update, since BTC is likely heading towards a new ATH and ETH stands much more to gain.
_________________
CRYPTO:SONIUSD
POLONIEX:FTMUSDT

ALTCOINS | Alt Season | BUY ZONES1️⃣ATOM / BINANCE:ATOMUSDT
Ideal buy zone is the lower area, unless it CLOSES daily candles above the upper area - then the bottom is likely in and chance for lower entry is slim
2️⃣ Litecoin LTC / BYBIT:LTCUSDT
This likely means a longer wait until ideal entry points, weighted heavier towards the lower zones:
3️⃣ Fantom FTM / BITSTAMP:FTMUSD
Seeing a trendline here that should be noted for a likely buy:
4️⃣ DOGE / BINANCE:DOGEUSDT
DOGE price has not yet begun to trade UNDER moving averages in the weekly either, meaning the bearish cycle is still in early days:
DOGE ideal entry for me would be for accumulation, long-term:

SONICUSDT 12HS / SET:SONIC ~ 12H Analysis
#S / #SONIC Buy after successfully penetrating this resistant line with a short -term target of at least 10%+ from here.

SUSDT 12HS ~ 12H Analysis
#S Buy gradually from here if you still have a Conviction on this coin with a short -term target of at least 10%+.

FTM - Time to Lock In for a 2x Ride to $1?Fantom ( UPCOM:FTM ) is sitting on its key floor support zone. A level that has historically triggered 50% to 100% pumps. Now, price is coiling within a triangle and looks ready to break out.
Could this be a start of a run to $1?
Let me know your thoughts below!
Kindly support this idea with a LIKE👍 if you find it useful🥳
Happy Trading💰🥳🤗

S (Ex FTM) UpdateS has formed a mini bearish flag which will push S towards down.
It's target also lined up with an Orderblock left behind.
Reasonable entry would be 0.4760

S (The Ex FTM) Has Formed a Bull Pattern and in Wave 3In short time frame the S, AKA "Ex FTM" has formed a Cup&Handle pattern. The breakout has already copleted. If it can stay above the invalidation level, S can reach the level 0.62 easily.
For a better perspective for long term, S also completed it's Bearish A-B-C waves and seems bullish again.
Good Luck.

S (Ex FTM) Next MoveAt the moment, S is going in a parallel channel through upwards. Either right from around here or from a lower demand zone, S will be going through 0,63 level.
It's a low risk trade and might be usefull.
Below the are 0.58 which is marked on the chart might be dangerous and would be a usefull stoploss.
If you can follow the chart in low time frame wait for a 4 hour candle close before stop the position if it reaches the invalidation level.

FTM/USD target 20 ### **Analysis of FTM/USD Chart (Monthly Timeframe)**
1. **Cup Formation**:
- The chart shows a **rounded bottom pattern**, indicating **accumulation** and a potential long-term bullish reversal.
- The **blue curved line** suggests a cup-like structure, commonly seen before a **parabolic breakout**.
2. **Current Price & Target**:
- **CMP (Current Market Price)**: **$0.62**
- **Target**: **$15 - $20** within 1 year (high-risk, high-reward trade).
- The upside target suggests a **~24x - 32x move** if the breakout occurs.
3. **Resistance Levels to Watch**:
- **$1.15 - $1.70**: Initial resistance zone
- **$3.35**: Mid-term breakout level
- If price sustains above these, **exponential upside is possible**.
4. **Suitability**:
- The note suggests it is **for aggressive traders**, indicating **high volatility and risk**.
- Patience is needed for this setup to play out.
### **Conclusion**:
- If momentum continues, **FTM/USD could see a strong rally**.
- A breakout above **$1.15 - $1.70** could confirm a **major bull run**.
- **High-risk, high-reward trade**—position sizing is key.

ALTS Shine, +55% INCREASE !! FTM | RNDR | Render and Fantom have made steep increases over the past two weeks.
In the past two weeks, FTM increased a whopping 55%:
And RNDR increased around the same amount:
This naturally makes it likely to see a correction soon, which may be the ideal time to get into the accumulation boat - or just for a swing trade.
________________________
GEMINI:RNDRUSD CRYPTO:FTMUSD

FTM | FANTOM | Altcoin with GREAT UPSIDE POTENTIALFTM has recently increased 11% in the weekly, but is making more red candles in the daily and the impulse up seems to be over for now.
Looking at the corrections, from -45% to -80% is not uncommon for Fantom.
The good news, is that the bottom is likely close - and from here, there exists great upside potential.
I am NOT saying we can't fall lower here - infact, a full retracement may be likely, just as we saw the previous cycle. In which case, the upside is even bigger. 30c is indeed a very popular demand zone:
_____________________
BINANCEUS:FTMUSDT

FTMUSDT BULISHFTMUSDT IS TRYING TO BE BULISH AGAIN IN THIS TIME, SOME OF TARGETS ARE ALREADY REACHED AND THAT PRICE POINTS CAN BE THE CORRECTION LEVELS IN THE FUTURE.
PAY ATTENTION TO STOP LOSS AND DANGER ZONE PLEASE.
Note: My ideas are not intended for any type of scalping or scalpers!
You can find the full list of my ideas here: www.tradingview.com
Here are some of my ideas:

Bullish Breakout for Sonic – Ideal Entry Levels to Watch!SET:SONIC (previously FTM) has broken above $0.733, confirming bullish momentum. However, a short-term pullback toward $0.645 - $0.618 could offer a better entry before the next move higher.
If support holds, the price may target $0.85 - $1.00, while a drop below $0.55 could weaken the bullish outlook. Patience is key for an optimal risk-reward setup.

FTMUSDT BULISH"FTM, like some others, has started a slow upward movement. Let’s observe its progress in the future.
The targets, danger zone, and stop loss levels are marked on the chart. Please pay close attention to all of them when managing your positions.
Note: My ideas are not intended for any type of scalping or scalpers!
You can find the full list of my ideas here: www.tradingview.com
Here are some of my ideas:

FTM low time frame update#FTM pattern tells us that the market is ready for a big rise
the pattern was a bind of an uptrend and a down trend the down trend wanted some liq to be stopped and it took this liq from stop losses and now its hungerness is done !
just because of the bearish pattern in the whole market we have 2 scenarios once is rising from here and the other one is rise after another down
there is a real positive pattern in higher time frames check this out
