FTMUSDT Weekly Technical and Fundamental Analysis
Upward Channel Analysis:
FTMUSDT is currently trading within its established long-term ascending channel on the weekly timeframe.
This channel, formed since late 2022, has provided support and resistance levels for FTMUSDT's price.
The current resistance sits at around $0.54, while support rests at roughly $0.38.
Weekly Candle Analysis:
The current weekly candle is still forming and hasn't closed yet.
FTMUSDT is currently positioned above the 200-week Moving Average (MA200), indicating potential bullish momentum.
A weekly close above $0.54 could be a sign of bullish strength and continuation of the uptrend.
Target Zones:
If the price breaks above and sustains itself above $0.54, we could witness FTMUSDT potentially reach the $1.63 zone.
This target zone is identified using the Fibonacci retracement tool based on the ascending channel's highs and lows.
Important Notes:
This analysis is solely for informational purposes and does not constitute financial advice.
Conduct your own research and employ proper risk management strategies before making any investment decisions.
Fundamental Analysis:
Fantom Roadmap: Fantom recently unveiled its new roadmap outlining its development goals and plans for 2024 and 2025.
Fantom Network Growth: The daily active users on the Fantom network are on the rise, indicating increasing demand for the platform.
Fantom Collaborations: Fantom has established partnerships with several prominent companies and projects within the cryptocurrency space.
Conclusion:
FTMUSDT is currently positioned technically well and possesses the potential to reach the $1.63 zone.
However, conduct your own due diligence and utilize proper risk management strategies before making any investment decisions.
Keywords:
FTMUSDT
Technical Analysis
Fundamental Analysis
Ascending Channel
Weekly Candle
200-week Moving Average (MA200)
Target Zones
Roadmap
Network Growth
Collaborations
Risk Management
Resources:
TradingView: www.tradingview.com
Fantom Foundation: fantom.foundation
FTMUSDT

FTM after the pullback will continue the uptrend FTM after rejection from the key resistance zone and the pullback will continue the uptrend
🔵Entry Zone 0.4876 - 0.5084
🔴SL 0.4571
🟢TP1 0.5488
🟢TP2 0.6384
🟢TP3 0.7554
Risk Warning
Trading Forex, CFDs, Crypto, Futures, and Stocks involve a risk of loss. Please consider carefully if such trading is appropriate for you. Past performance is not indicative of future results.
If you liked our ideas, please support us with your likes 👍 and comments.

#FTM #FTMUSD #FTMUSDT #Analysis #Eddy#FTM #FTMUSD #FTMUSDT #Analysis #Eddy
(("All the relevant areas and explanations on the chart are clear and clear, the trading setups need to get confirmation to enter, if you don't know how to get a trigger and confirm entering into transactions, this analysis is not suitable for you, the above analysis is for professionals. and if you are a beginner, my suggestion is that you don't destroy your capital and first learn technical analysis and basic trading along with psychology and risk and capital management from reputable sources and courses, and then enter the financial markets."))
(("The above analysis and setups and points and areas are combined with most of the combined styles such as price action, supply and demand, RTM, ICT and also with the analysis of important indicators such as Dominance Tether and Bitcoin.
If you are familiar with the mentioned styles and know how to get approval to enter the above styles, use the above analysis.
This is not an investment proposal and only my opinion, please act based on your experience and decisions."))
~~~~~~~~~~~~~~~~~~~~~~~~~~~~~~~~~~~~~~~~~~
BTCUSDT.P Setups 1+2 :
BTCUSDT.P Setups : 3+4 :
I also suggest you to view my #Analysis of #Bitcoin from the link below :
Related Tether Market Cap USDT Dominance Analysis : (( USDT.D )) : Check Link :

FTM heating up, first really big move about to comeFTM price lagging but not the technology.
If you're not already in FTM you should consider.
The first big FTM bull run wave hasn't started yet, big opportunity before the weekly resistance break.
This idea is simple - buy on touch on the daily trendline (front run the big move) or wait for breaking the daily and weekly resistance area.
Ride FTM to close to 1 dollar (0.99 or so) or hold longer - non financial advice.

FTMUSDT,🟢Is it bullish?🟢
Well, the price reached the important demand zone that formed as a rejection block and had a bullish reaction, and then the price hit the bearish order block that broke the previous low.
Now if the price can stabilize above 0.3965, we can expect a more bullish move.
the first target can be the liquidity above 0.446 and the FVG.
💡Wait for the update!
🗓️03/02/2024
🔎 DYOR
💌It is my honor to share your comments with me💌

FTMUSDT 😄 Bullish ContinuationWe finally see FTM breaking the downward trendline yesss!
Now there are 2 short term scenarios that could happen:
Bullish Continuation
We need see price breaking above 0.33 that would confirm bullish bias to the upside
Target: 0.38 - 0.40 area
Bearish Continuation
Price would correct itself down to liquidity area.
Target: 0.24 - 0.20 area
We'll see how it plays out. Market has gotten all greedy these days!
Trade Safely,
Kina 😄

FTM → Fantom Aims for Resistance Zone! Should We Short Here?FTM came into contact with the Daily 200EMA support after three pushes down, a pullback from the $0.57 high. The price bounced off of the 200EMA and is in now what appears to be a second leg up toward the high. Should we prepare to enter a short?
How do we trade this? 🤔
We need this bull pattern to play out and give us a reversal signal before we entertain a short. I believe Bitcoin has some more time in the coming days and even weeks to potentially top out and reverse hard to the downside. That gives the altcoin market some time to either go sideways or find some momentum toward the upside. ETH is showing us that momentum now.
Wait for another push or two toward the $0.57 high, wait for a double top reversal signal, then enter a short position with a stop loss placed above the Resistance Zone. An entry around $0.51 gives us enough room for a 1:2 Risk/Reward trade since the second take profit will be in the Daily 200EMA support area at $0.35. Close out the first half of your position at 1:1 Risk/Reward and move the stop loss up to the entry price, this locks in profits and allows the second half of the trade to be executed without the fear of loss.
This, being a counter-trend trade in a bull market, comes with a lower probability of profit, which is why half of our position ought to be a scalp. The conditions listed must be met for this trade to work. I will also add that longing here is not recommended with the crypto market burning as hot as it is for as long as it has been. We're due for a hard pullback of at least 30-50% before we see new all-time highs for Bitcoin. I stand firm on that warning, given the distance we've traveled since the $15,000 low; the probability falls the longer we march upward.
💡 Trade Idea 💡
Short Entry: $0.51
🟥 Stop Loss: $0.59
✅ Take Profit #1: $0.43
✅ Take Profit #2: $0.35
⚖️ Risk/Reward Ratio: 1:2
🔑 Key Takeaways 🔑
1. Found Support at the Daily 200EMA after a three-legged pullback from the $0.57 high
2. Two legs up in a new bull pattern
3. Looking for a third leg up followed by a double-top reversal signal
4. RSI at 57.00 and at the moving average. Room to move up before a fall.
5. Wait for these conditions to be met then aim for a 1:2 Risk/Reward short.
💰 Trading Tip 💰
It's reasonable to take half profits at the first resistance target in a long trade, or the first support target in a short trade. Using a 1:1 Risk/Reward Ratio for your first target, you can move your stop loss up to your entry price, locking in profits. This allows you to watch the rest of the trade execute without worry of losing money. This helps improve trading psychology and the equity in your account.
⚠️ Risk Warning! ⚠️
Past performance is not necessarily indicative of future results. You are solely responsible for your trades. Trade at your own risk!
Like 👍 and Follow to learn more about:
1. Reading Price Action
2. Chart Analysis
3. Trade Management
4. Trading Psychology

FTM Big Potential a head , dont miss the train FTM Big Potential a head , dont miss the train
Sleeping giant ready to fly , we are on demand zone
DCA from here to 0.6 short term and 3 $ long term
3 $ is very near than you think

FTMUSDTFTMUSDT is in strong bullish trend.
As the market is consistently printing new HHs and HLs.
currently the market is retracing a bit after last HH, which is 50% Fib retracement level and local support as well. if the market successfully sustain this bullish confluence the next leg high could go for new HH.
What you guys think of this idea?

FTM/USDT 1DInterval ChartHello everyone, I invite you to review the FTM chart on a one-day interval. As we can see, the price has broken the downward trend line, above which the price movement is currently maintained.
When we look at the EMA Cross 10 and 30 indicator, we can see that the red EMA Cross 10 line has crossed the green EMA Cross 30 line from below, which indicates a local return to the uptrend.
Looking at the current price increases, it is worth moving on to determining the resistance that we should take into account. And here there is a strong resistance zone from $0.56 to $0.66, only when the price overcomes it and then tests positively should we see an upward movement to the level of approximately $0.97.
In the second direction, you can see how the price stays above the newly formed support at $0.42, then you can see support at $0.32, and then you can see how $0.25, which previously maintained a move in one and the other direction.
The RSI indicator shows an upward movement with room for the price to go a little higher, but caution should be exercised because the STOCH indicator reflects at the upper limit, which may limit the growth.


STGUSDT H4Hi Guys Hope You well
We are now Here to share you our idea.
Do the best .
SecondChanceCrypto
⏰ 19/FEB /24
⛔️DYOR
Always do your research.
If you have any questions, you can write them in the comments below and I will answer them.
And please don't forget to support this idea with your likes and comments.

FTMUSDT Elliott Waves (Local Setup)Hello friends.
Please support my work by clicking the LIKE button👍(If you liked). Also i will appreciate for ur activity. Thank you!
Everything on the chart.
Entry: Market and lower
Targets: 0.4 - 0.42 - 0.44
after first target reached move ur stop in breakeven
Stop: ~0.31 (depending of ur risk).
RR: 1 to 2
ALWAYS follow ur RM.
risk is justified
Good luck everyone!
Follow me on TRADINGView, if you don't want to miss my next analysis or signals.
It's not financial advice.
Dont Forget, always make your own research before to trade my ideas!
Open to any questions and suggestions

FTMUSDTHi traders!
All is clear!
Fantom USDT , Entry: 0.4235
Stop: 0.3989
TP: 0.5
Duration: about 7 Days. (Until Feb 23th)

📈 FTM - Testing Range Resistance for Potential Breakout! 🚀
🔄📈 FTM (Fantom) Trade Analysis - Testing Range Resistance for Potential Breakout! 💹🚀
📊 Technical Overview:
FTM (Fantom): Testing top of the range resistance at $0.4025.
Scenario 1 (Breakout): Potential entry if it breaks and converts $0.4025 into support.
Scenario 2 (Retrace): Entry if it retraces and retests around $0.3750.
Stop Loss: Scenario-specific stop losses.
Take Profit: Next resistance levels at $0.45 - $0.48 and $0.55 - $0.60.
📈 Trade Strategy:
Scenario 1: Entry after breakout confirmation.
Scenario 2: Entry on retracement and retest.
Risk Management: Tailored stop losses for each scenario.
Take Profit: Targeting next resistance levels.
🚨 Note: Market conditions and Bitcoin movements may influence FTM. Trade cautiously! 🔄🚀 #FTM #TradeAnalysis #Cryptocurrency 📊💹


The last word is the rise, but the breaking of the range is moreIn this analysis, we take a second look at the important support and resistance ranges of this currency, and we have specified the signal for friends who are risk aficionados.
Also, for friends who have this currency, we specified important limits for reducing the average.
In this analysis, we mentioned the safe entry for the medium term, that by breaking this resistance range, we can consider 350% growth for this currency.

FTM → Fantom Falls to 200EMA! Long back to $0.53? Let's Answer!FTM marched to the upside with three pushes up in a bull channel touching $0.565, followed by a pullback with three pushes down and strong bull support. Is it time to long?
How do we trade this? 🤔
A long entry is nearly justified. Here's what we have in favor of the long bias; Three pushes up in a bull channel ending at $0.565, followed by three pushes down in a micro-bear channel with strong bull signal bars, and we have a good follow-through bars leading up to the price action being just above the Daily 30EMA. The Daily 200EMA is showing some strong support as well.
What we need is a break of the Daily 30EMA to justify to our long. You could argue a long is justified here simply by the data we already have, and I wouldn't argue against you; I would just say that Daily 30EMA is in the way, so this is a lower probability trade, but also less initial risk because your stop loss is closer.
I believe we need to be conservative longing at this stage in the crypto market, which is why I only advocate for a 1:1 scalp at a lower-than-maximum position size allowed for your trading strategy. I think Bitcoin and Ethereum have a larger pullback on the horizon, but do believe the market will come up a bit before it goes down.
💡 Trade Idea 💡
Long Entry: $0.403
🟥 Stop Loss: $0.323
✅ Take Profit: $0.483
⚖️ Risk/Reward Ratio: 1:1
🔑 Key Takeaways 🔑
1. Three pushes up in a bull channel
2. Micro Bear Channel forms with three pushes down.
3. Strong bull signal bars at Daily 200EMA
4. Suggested to wait for break of Daily 30EMA
5. RSI at 48.00 and above the Moving Average, supports long bias.
💰 Trading Tip 💰
The longer a trend continues after 3 legs, the probability of that trend continuing lessens. Because of this decreased probability, we ought to reduce our risk when entering trades.
⚠️ Risk Warning! ⚠️
Past performance is not necessarily indicative of future results. You are solely responsible for your trades. Trade at your own risk!
Like 👍 and Follow to learn more about:
1. Reading Price Action
2. Chart Analysis
3. Trade Management
4. Trading Psychology

FTMUSDT IMMENSE LONG POTENTIAL !FTMUSDT broke of a long downtrend and retested support successfully.
It is now setting up an optimal entry at a demand area that could potentially lead to large gains in the mid-long term, while the RSI is testing a new uptrend line after breaking a long term downtrend line and testing support.
Invalidation of this trade would be breaking and closing below this area while RSI breaks structure.

FTMUSDT.1DBased on the provided data, FTM (Fantom) is currently trading at $0.36 against USDT.
Looking at the 4-hour timeframe, the RSI (Relative Strength Index) is at 54.49, suggesting that the market is relatively neutral, not in overbought or oversold conditions. The MACD (Moving Average Convergence Divergence) is at -0.10, indicating a bearish signal. The Bollinger Bands indicator is at 0.3954, and the price is below the upper band, suggesting a potential downward movement. The first, second, and third support levels are at $0.3480, $0.3440, and $0.3223 respectively, while the resistance levels are at $0.395, $0.4177, and $0.4468.
On the 1-day timeframe, the RSI is at 44.71, which also suggests a neutral market. The MACD is at -0.0122, which is a bearish signal. The Bollinger Bands indicator is at 0.4170, with the price below the upper band, indicating potential downward movement. The support levels are at $0.3475, $0.3036, and $0.2780, while the resistance levels are at $0.4151, $0.4500, and $0.4660.
On the 7-day timeframe, the RSI is slightly higher at 53.86, still suggesting a neutral market. The MACD is at 0.029, indicating a bullish signal. The Bollinger Bands indicator is at 0.5144, with the price below the upper band, indicating potential downward movement. The support levels are at $0.3110, $0.16, and $0.075, while the resistance levels are at $0.55, $0.66, and $0.96.
Based on this analysis, FTM seems to be in a neutral to slightly bearish trend. Short-term traders should be cautious and watch for any breakouts above the resistance levels or break downs below the support levels. Long-term investors may want to watch the 7-day MACD for a sustained bullish signal. However, this analysis is solely based on the provided data. It's crucial to consider other market factors and conduct further research before making any investment decisions.

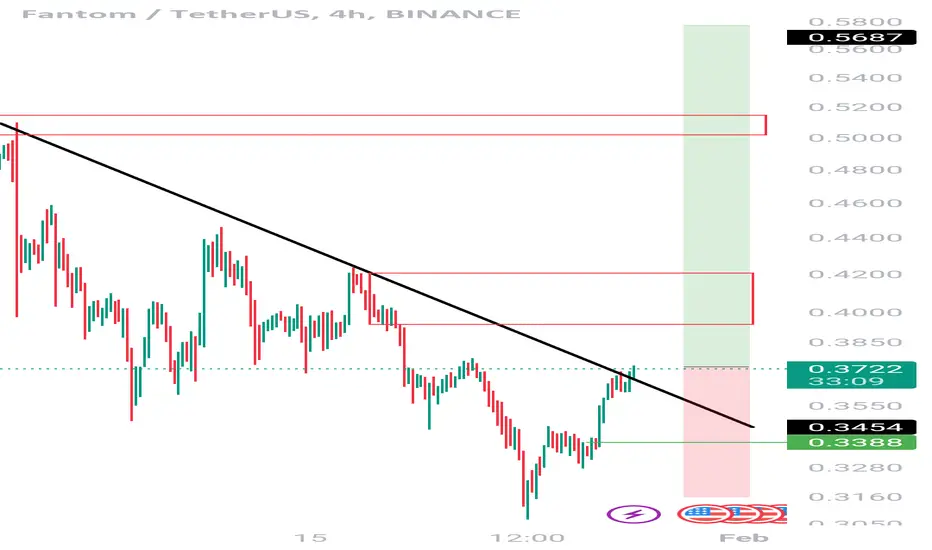
FTM ANALYSIS🔮 #FTM Analysis - Breakout 🚀🚀
💲💲 There is a breakout of Falling Wedge Pattern in #FTM and trying to retests the level. It's a 4hr time frame breakout and we can see more higher price in long-term. If the price closes above the major resistance or Breakout the major resistance then there will be a confirmation of bullish movement 📈📈
💸Current Price -- $0.3805
📈Target Price -- $0.5100
⁉️ What to do?
- We have marked crucial levels in the chart . We can trade according to the chart and make some profits. 🚀💸
🏷Remember, the crypto market is dynamic in nature and changes rapidly, so always use stop loss and take proper knowledge before investments.
#FTM #Cryptocurrency #Breakout #DYOR

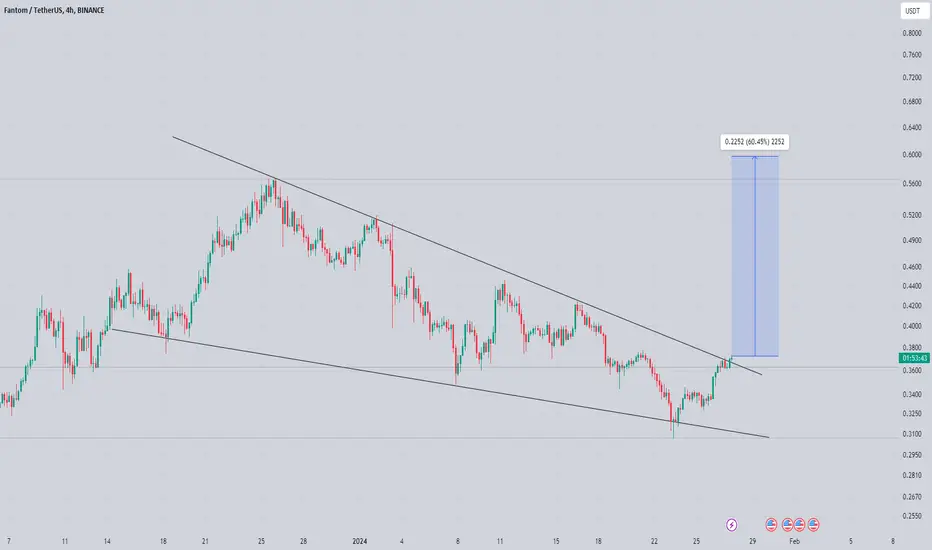
Ftm/Usdt Trying For breakout FTM/USDT is currently attempting a breakout on the 4-hour time frame. In the event of a successful breakout, there is potential for a bullish move ranging between 30% and 60%. However, it is important to note that this information is not to be considered as financial advice. It is recommended to conduct your own research and analysis before making any investment decisions.
ftm getting ready for another leg higher seems like getting ready for another 50 to 55% bullish rally
trend is up and strong currently breaking falling wedge consolidation in h4 timeframe incase of successful breakout expecting solid bullish rally towards 0.55 to 0.60$
keep eyes on ftmusdt for successful breakout