1H SignalHello
You can take long position after fixation breaking out.
Don't forget SL/TP.
A nice double bottom.
FTMUSDT

FTM could turn bullish soonHi, dear traders. how are you ? Today we have a viewpoint to BUY/LONG the FTM symbol.
FTM ascended from where I entered "origin of motion" and removed 3 supplies and created ascending CH. The move continued until it reached a strong resistance, which I have marked with a yellow circle, and from there it underwent a correction after collecting many sell orders.
Now after a lot of correction it is coming back to the "origin of motion" where I think there are a lot of buy orders left. By hitting this area and collecting buy orders in this area, it can move up.
When the orders are collected and we move up, I have specified 2 TPs, but it is not necessary to be able to move up to the second TP. So you should take some save profit when we get to TP 1 and place your stop on the entry or you can completely exit the market at TP 1. It's really personal and up to you.
Also, in the chart, we have liquidity pools that I have shown with $$$. Pool 1 has been collected, but pools 2 and 3 have not yet been collected.
One thing you should know is that when candles reach a strong support/resistance and we have liquidity pools, after a CH, candles tend to collect liquidity pools ahead.
For risk management, please don't forget stop loss and capital management. Be sure to set a stop loss, because a smart trader will try to preserve capital before thinking about taking profit.
Comment if you have any questions
Thank You

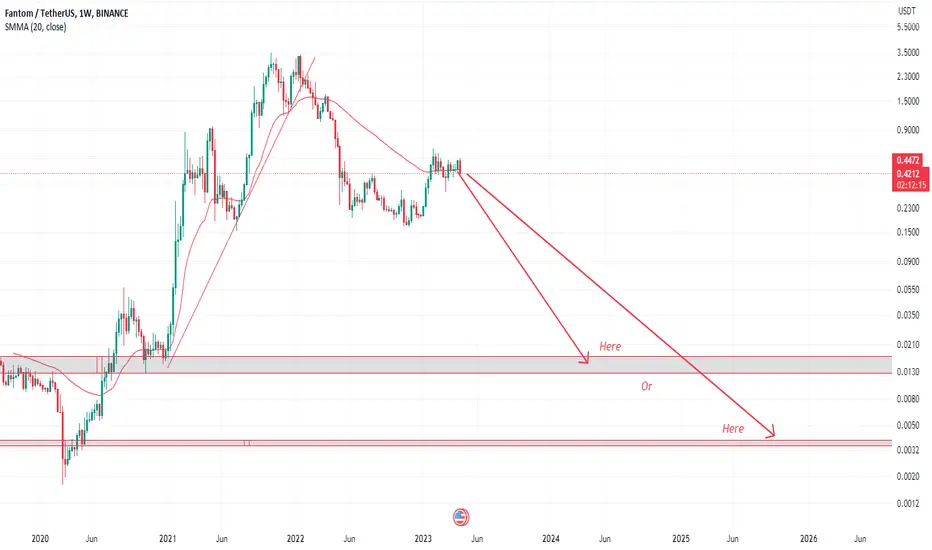
Test Again?From the current general shape, this ascent is nothing but a test of the last broken bottom and closed its predecessors.. Therefore, it will complete a decline again after completing the re-test to the shaded area below.
Note: the analysis fails if the price closes in the highest area 0.392

📈Fantom weekly --> 50% price jump📉BINANCE:FTMUSDT
BITFINEX:FTMUSD
Hello Traders, please check out my previous ideas.
If the price stabilizes above the indicated areas in daily or 4H timeframe--> 💥50% price jump💥
targets are on the chart.
optimum stop-loss is below the 0.215$ level.
✌💥If you are satisfied with my analytical content, please share my ideas💥✌
✍🐱👤Otherwise, make sure you leave comments and let me know what you think.🐱👤✍
🤑🍾Thank you for your support. I hope you will gain profit by following my analyses.🍾🤑
CrazyS✌

Dangerous breakdown!Hello
Be carful about your money in this market in particular FTM.
There is a essential trendline like a tons of gas on your money waiting a Spark.
I think it relates to Ukraine and Russia's war.

FTMUSDTThis is a 1D frame analysis for FTMUSDT As you can see, the price has been ranging between the first support line and our resistance line for several days, forming double bottoms which is a sign of indecision in the market. The price is once again attempting to break the resistance line and double bottoms have formed. However, keep in mind that if the price cannot establish itself above the resistance line and fully break below the support line, it may start to move towards the next support line.

#BTCUSDT H1 : Long situation Hi Guys , Hope you well
As indicated in the chart, I have specified two buying positions, but you must receive confirmation for trading these in the lower time-frame and then enter. I remind you that the market is extremely confused. Trading in these intervals can be very difficult, so be very carefull.
SecondChanceCrypto
⏰ 10/August /23
⛔️DYOR
Always do your research.
If you have any questions, you can write them in the comments below and I will answer them.
And please don't forget to support this idea with your likes and comments.

FTMUSDT and the sad chartHello everyone! Let's analyze the FTMUSDT coin, which differs from its counterparts in a rather dull schedule. If now many coins (such as eth and btc) have formed a certain foundation for further growth, then there is no enlightenment yet. The price has come close to the resistance level and the trend line is still covering the top. From here there is a high probability of going further down to the 0.17 mark

BTCUSDT DAILY : Very complicated situationHi Guys , Hope You well
According to the previous analysis that I had in the daily time frame, Bitcoin started moving on its own. But due to some good fundamental news, it is possible that the price can even reach the level of 35,000 USDT . I recommend that you follow new analyzes and be very careful if you are in sell positions.
SecondChanceCrypto
⏰ 8/August /23
⛔️DYOR
Always do your research.
If you have any questions, you can write them in the comments below and I will answer them.
And please don't forget to support this idea with your likes and comments.

BTCUSDT H4Hi Guys hope you well.
As I said about the direction of movement in the daily time in the previous analysis, I expect such a movement in the 4-hour time frame, Box 30500 can be the last chance for sellers.
The analysis is in the high time frame and only shows the way. For trading, you must have your strategy in the short time.
SecondChanceCrypto
⏰ 2/August /23
⛔️DYOR
Always do your research.
If you have any questions, you can write them in the comments below and I will answer them.
And please don't forget to support this idea with your likes and comments.

FTMusdt Big Picturethis analyse for bullrun and not for short term
this analyse targets and entrypoint for ppl have buy spot and HODL on Bullrun
GL
EntryPoint:
0.1994
0.1744
0.1439
Supports:
0.1
0.0781
0.0565
Resistances:
0.2572
0.3140
Targets:
3442
0.5408
1.1353
1.9120
3.7439
GOAL:
8.7720
GL

Good signal for reversing to 0.32Weekly Chart
Fantom BINANCE:FTMUSDT has ChoCh after closed above 0.5185 on Jan 30 2023
Daily Chart
BINANCE:FTMUSDT has buying pressure and it can be done a hammer candle
Chart 4H TF
Fantom is creating a divergence RSI and price, so it's a good signal for reversal
Wait for next move

FTM BULL FLAG ! Fantom has been moving like a snail lately.
I see a bull flag pattern forming up. If bitcoin stops being a bully to altcoins, we can go higher !
PUMP or Breakdown??
NFA,DYOR

FTM ""Double Bottom"" Weekly ChartFTM is looking great as it is also forming a double bottom on weekly timeframe. The higher the timeframe the better it is.
It also started to form bullish divergence on 4h timeframe as shared in the previous idea.
We need to wait for the BREAK and RETEST of the NECKLINE marked with orange dotted line.
LETS PUMP IT !!
DYOR, NFA

FTMUSDT"Daily crypto market analyses I provide are personal opinions & not financial advice. Trading carries risks, so do your own research & seek advisor's help."
Don't forget to like and comment

Fantom – Long Entry Based on wick fill.In a previous TV idea, I suggested a S/R flip long trade for FTM (linked).
Unfortunately, the market is bearish, and I think that this trade is not a high-confidence setup.
I would like to suggest another trade setup based on the wick-fill strategy. This trade has a higher chance of success IMO. Trade Idea
Entry: 0.2256 (50% of the wick)
SL: 20.90 (below the wick)
Target: 0.33
TP: 0.258, 0.33
R: R: 1:6.6

FTM Potential ""DOUBLE BOTTOM"" !FTM price consolidating in the GOLDEN POCKET ZONE.
Setting up for an amazing higher timeframe DOUBLE BOTTOM.
Wait for the confirmation to long after breaking the neckline of double bottom.
That is all nice and simple for you guys !
DO NOT FORGET TO DROP A FOLLOW TO GET REGULAR UPDATES AND FREE LONG SETUPS :)
NFA , DYOR !

FTM - Nice S/R TradeEntry: 0.2583
SL: 0.252
Target: 0.33
R: R: 1:12
if FTM breaks through the zone between 0.334 - 0.3516, I will update with additional targets

FTM ANALYSIS (4H)Hi, dear traders. how are you ? Today we have a viewpoint to BUY/LONG the FTM symbol.
For risk management, please don't forget stop loss and capital management
When we reach the first target, save some profit and then change the stop to entry
Comment if you have any questions
Thank You

FtmusdtFantom is in bearish form of itself
Ftm needs to break the orange trend line and breaks 0.28$ to rise up and go up with the others .if it cannot do it we will see soon 0.24$ and maybe 0.19$ levels of price
Btc.d range or red and total3 green and usdt.d red is good news for altcoins like ftm as we call fantom 🙂🚬


ftmAccording to the investigations, such a movement can be observed for this currency in the long term. The first encounter in the two green lines, and if it is not supported, the green box is suitable for buying and checking.
