FTMUSDT BULISH AGAINAfter the significant decline in the market a few days ago, including FTMUSDT, I can now see bullish signals for FTMUSDT. The targets are marked on the chart as always.
Note:
If the close candle passes the ‘Danger Zone,’ please be cautious with your positions.
If the close candle passes the ‘Stop Loss,’ exit this position, as it is no longer valid.
Note: My ideas are not intended for any type of scalping or scalpers!
You can find the full list of my ideas here: tradingview.com/u/TheMandalor/
Here are some of my ideas:
FTMUSDT

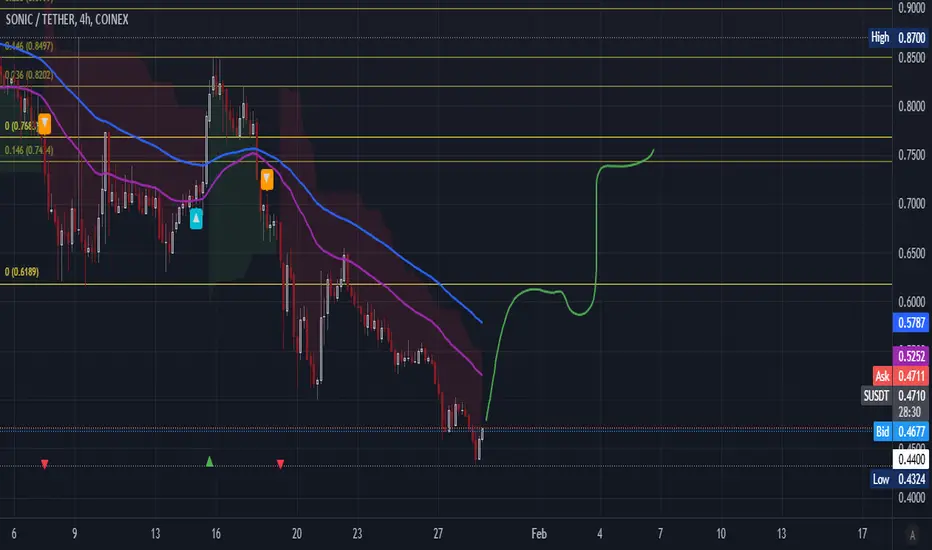
S 01/29/2025@Sonic has been abandoned by the market, market maker and team in terms of pricing and therefore has acted completely bearish, even in the positive parts of the market and the positive signals issued by the indicators, #Sonic still failed to grow and falls with the slightest event.
According to the Sonic team's opinion and conclusion to support the price, this trend will change soon and I think we will see the price increase according to the green line.
#S #FTM #FANTOM
FTMUSDT BULISH FTMUSDT is looking bullish after a significant bearish period, and I believe the targets are quite achievable. I’m confident about most of them!
Here are my other ideas:

Quick updateSonic Update: The drop I predicted in FTM happened exactly and now the indicator has signaled an increase, I hope it will soon compensate for these drops due to migration and return above $1. My targets for FTM and Sonic are very high,
the first target is $7, $20 and $70 according to previous analysis in my account
FARSI:
rizeshi keh dar fantom pish bini kardam daghighan etefagh oftad va alan andikator soud ra signal kardeh ast, omidavaram zudtar in rizesh ro jabran koneh bekhater mohajerat va bargardad balaye 1 dolar. targat man baraye fantom va sonik besiar balast, targat 7 dolar va 20 dolar va 70 dolar ast tebgh tahlil ghabli dar akantam

Reversal for Sonic has commencedSeems like 50 cents has some iron wall defending it and now double bottom at 50 cents was established, allowing those who wanted to exit to do so (capitulation), based on the volume.
We now have made a clean reversal on the hourly.
Next targets are the launch high, which is a nice take profit target to those on long positions, but i expect overall trajectory to be higher.

FTM long term update#FTM made a rising pattern in long term
wave 1 is made the wave 2 is like ABCDE which is completed now the market is heading to the 3rd wave this can make the market reach its last highs in past
there was a huge liq at the bottom of the chart which the market took it i think there is no reason for going down again !

ftmI think it's a good place to buy in the lower areas as long as the red lines aren't broken in the short term.

Quick updateQuick update Sonic (FTM) NYSE:S
Sonic performed very poorly due to the migration situation from FTM, but if trading volume increases and exchanges support it, Sonic will soon see $1 again. I hope the upward trend starts and doesn't stagnate for so long.

S 1D - FTm 1D Hello, should we finally say goodbye to Sonic
After the launch of Sonic, the price has dropped from $1.47 to 54 cents, which is not a normal or natural drop at all.
This project reminds us of the former Matic, when the network and its name changed, the token price went into a crisis.
Currently, after holding this token for 3 years, there is no hope for its future, and I believe that the price will soon decrease to 30 to 33 cents.
We can only expect an upward movement if the price stabilizes above 84 cents."

Sonic the Hedgehog Fantom Sonic performed very poorly due to the migration situation from Phantom, but if trading volume increases and exchanges support it, Sonic will soon see $1 again. I hope the upward trend starts and doesn't stall for so long.
#s
#ftm

Breaking: Fantom ($FTM) Faces Turbulence Amid Coinbase DelistingOverview
Fantom ( UPCOM:FTM ), a popular blockchain platform known for its speed and scalability, is under the spotlight following Coinbase’s decision to suspend its trading. This move, effective January 24, 2025, has sent ripples through the market, sparking fears of a potential price dip to $0.50. Despite this looming challenge, UPCOM:FTM has shown short-term resilience, with a slight uptick in its price. However, technical indicators suggest a bearish trajectory, warranting close observation from traders and investors alike.
The Delisting Announcement
Coinbase, one of the leading crypto exchanges, announced the suspension of UPCOM:FTM -PERP trading across its platforms, including Coinbase International Exchange and Coinbase Advance. The final settlement price will be calculated based on the average index price 60 minutes before trading ceases. Open positions will be automatically settled at the time of suspension, with funding rates set to zero for the final funding period.
This announcement coincides with the ongoing scrutiny of Coinbase by the US Commodity Futures Trading Commission (CFTC) in connection to the Polymarket investigation. The regulatory body has issued a subpoena to Coinbase, seeking customer-related information, further adding to the uncertainty surrounding $FTM.
Current Market Performance
Despite the negative sentiment, UPCOM:FTM ’s price has risen by 5.38% in the last 24 hours, reaching $0.6953. However, the token remains down by 11.80% over the past week and 41.62% over the past month. With a 24-hour trading volume increase of 0.35% and market cap growth of 6.56%, UPCOM:FTM appears to be attempting a recovery from its recent losses.
Nevertheless, bearish sentiments dominate, as evidenced by a volatility rate of 22.52%. The market’s response to the delisting announcement and regulatory developments will likely dictate the token’s short-term trajectory.
Upcoming Developments: Sonic Rebranding
In a bid to counter negative market sentiment, Fantom is undergoing a rebranding initiative. On January 13, 2025, UPCOM:FTM will transition to a new identity, “Sonic,” with a 1:1 token swap ratio. Binance, a major supporter of this transition, will enable deposits for Sonic on January 16, 2025, and open trading pairs shortly thereafter. This rebranding could provide a fresh narrative for the project, potentially mitigating some of the damage from the delisting.
Technical Analysis
As of this writing, UPCOM:FTM ’s RSI stands at 39, indicating weak momentum and oversold conditions. The token’s chart reveals a falling wedge or bearish symmetrical triangle pattern, signaling a potential downward breakout. A close below the current candlestick could trigger a selling spree, with UPCOM:FTM potentially testing the $0.50 support level.
Fundamental Concerns
1. Regulatory Pressure: The CFTC’s investigation into Coinbase adds an additional layer of uncertainty, impacting both the exchange and tokens like UPCOM:FTM listed on it.
2. Market Sentiment: The delisting has raised questions about UPCOM:FTM ’s future accessibility and liquidity, contributing to bearish market sentiment.
3. Rebranding Efforts: While the Sonic rebranding initiative is a positive development, its success will depend on market reception and execution.
Conclusion
Fantom ( UPCOM:FTM ) faces significant challenges following Coinbase’s delisting announcement and ongoing regulatory scrutiny. While the token’s short-term resilience is commendable, technical indicators and market sentiment suggest a bearish outlook. The upcoming rebranding to Sonic offers a glimmer of hope, but traders should remain cautious and monitor key support levels.
FTM 1DHello, as you can see, the situation of Fantom is very bad and the important support that started from the bottom of 25 cents is breaking. I expect a drop until January 16th until it is listed again on all exchanges.
In any case, if we go below 66 or 65 cents, we can reach 35 or even 33 cents.
My personal opinion is a bearish scenario. I don't have much hope for price growth.

#FTM/USDT Ready to go higher#FTM
The price is moving in a descending channel on the 1-hour frame and sticking to it well
We have a bounce from the lower limit of the descending channel, this support is at 0.7824
We have a downtrend on the RSI indicator that is about to be broken, which supports the rise
We have a trend to stabilize above the moving average 100
Entry price 0.7826
First target 0.8170
Second target 0.8634
Third target 0.9046

#FTM/USDT Ready to go higher#FTM
The price is moving in a descending channel on the 1-hour frame and sticking to it well
We have a bounce from the lower limit of the descending channel, this support is at 0.6900
We have a downtrend on the RSI indicator that is about to be broken, which supports the rise
We have a trend to stabilize above the moving average 100
Entry price 0.7300
First target 0.7735
Second target 0.8078
Third target 0.2490

FTM/USDT Bulish and Correction As you can see, All targets of my last Idea about bearish FTMUSDT is touched and right now it is possible to touch these prices less than 2 weeks.
Previous IDEA:

Bad news FTM holders markets require more blood sacrificeThe price action of the past few days from the latest bottom of 66 cents seems to have been a bearish retest.
the massive long term support has turned into resistance
the bearish retest has been completed
now down again
RSI also has hit resistance.
more blood more pain
the bit question is when after 68-69 cents is reached:
double bottom confirmation and bottom is in, with rising RSI
or
max pain, max blood scenario of visiting 53 cents with also rising RSI, forming a bullish divergence?
the second part remains to be seen in several days
first part is clear
more blood from FTM holders
sorry, bulls
This is a SHORT-TERM analysis only

FTM: The prospect of increasing?BINANCE:FTMUSDT
As you can see, FTM has created an ascending head and shoulders and is also located in the megaphone, which means that if it breaks, we expect the price to reach the target (AB=CD).
✨Traders, if you liked this idea or have your opinion on it, write in the comments, We will be glad.
_ _ _ _ __ _ _ _ _ _ _ _ _ _ _ _ _ _ _ _ _ _ _ _ _ _ _ _ _ _ _ _
✅Thank you, and for more ideas, hit ❤️Like❤️ and 🌟Follow🌟!
⚠️Things can change...
The markets are always changing and even with all these signals, the market changes tend to be strong and fast!

should we assume deviation and downtrend breakout for FTM?let's see if this breakout holds. FTM massively broke down and then broke down some more, but could be considered deviation. Either way, we can now look forward to a potential scenario of retesting the HTF support and resume return to upward move.

Regular and principled...hello friends
We came up with FANTOM currency analysis.
This potential coin, which is active in the DEFI field, has been able to grow well by forming an upward channel.
Now we have specified the purchase limits for you in case of modification.
Now it is logical to buy one step, but in case of correction, we can wait until the specified areas and then make our purchase.
But in case of successful failure of the channel, we can still buy and move with the specified goals.
Note that this coin has a high growth potential....

FTM strong bounce …will continue ?FTM / USDT
#FTM has news regarding its rebranding to #S which affected the price heavily in past few days
Currently it shows great bounce
stability here = going for these targets
Lose red level in HTF = invalidation of bullish setup

"FTM eyes a rebound with Sonic conversion and airdrop catalysts! Fantom (FTM) shows a recent downtrend, but the upcoming Sonic (S) conversion and the associated incentives like the free swaps and airdrop could catalyze significant price action. Here’s a detailed analysis:
Current Technical Overview:
1. Price Action:
- The price is currently trading at $0.74250, down significantly from its recent highs, but it appears to be nearing a support level.
- Historically, these levels may attract buyers looking for value or anticipating upcoming events.
2. Moving Averages:
- The yellow line represents the 50-day moving average (MA), while the red line is the 200-day MA.
- The price is below both MAs, suggesting bearish momentum in the short term. However, a catalyst like the Sonic conversion could reverse this trend if it sparks significant buying activity.
3. RSI (Relative Strength Index):
- The RSI is near 38.93, which is close to the oversold region (below 30).
- This indicates potential for a rebound, especially with the upcoming news providing a fundamental driver.
4. Volume:
- There is moderate volume, but it hasn't yet shown the surge that might accompany the January 19 event. If trading activity picks up in anticipation, this could signal increased interest.
Impact of Upcoming Events:
1. Sonic (S) Conversion:
- The free swaps for the first 90 days provide a strong incentive for current holders to stay invested and for new investors to join.
- This could reduce selling pressure on FTM while potentially driving demand.
2. Airdrop*:
- A points-based airdrop with 6% of the supply set aside can encourage accumulation of FTM to qualify, likely increasing buying pressure over the coming months.
3. Psychological and Market Sentiment:
- Such large-scale events often generate positive sentiment and FOMO (Fear of Missing Out), potentially pushing the price upwards as we approach the event.
Strategy and Outlook:
1.Short-Term:
- As the January 19 date approaches, there is a strong possibility of a price rebound if volume picks up and sentiment turns bullish.
- Traders may look for entries near the current support level with tight stop-losses in case of further downside.
2. Mid-Term:
- The incentives from the free swaps and airdrop could sustain higher interest in FTM through Q1 2025.
- Monitor for a breakout above the 50-day MA as a confirmation of trend reversal.
3. Risks:
- If the broader market remains bearish or if the events fail to meet expectations, the price could consolidate or continue its downtrend.
- Keep an eye on the volume and RSI for early signals of a move.
Key Levels to Watch:
- Support: $0.70 (current zone) and $0.60 (major support).
- Resistance: $0.95 (50-day MA) and $1.20 (recent high).
With the January 19 event on the horizon, this could be a pivotal moment for Fantom's price action. It's a good opportunity to prepare for potential volatility and capitalize on positive momentum.

FTM Ready to Pump? Exclusive AI-Powered Analysis### Technical Analysis of the Market 🎯
---
#### 📊 Overall Market Trend (Based on ADX Indicator)
The ADX indicator, with a value of 46.08, indicates a strong trend. Given the +DI value of 11.54 and -DI value of 23.83, the overall market trend is bearish as -DI is greater than +DI.
🔍 **Analysis:** In a strong bearish trend, traders tend to see more sellers entering the market, avoiding buying positions. Short-term selling opportunities (short positions) on similar assets may be attractive.
---
#### 📉 Overbought and Oversold Conditions (Based on RSI and Stochastic Indicators)
- **RSI Indicator:** The RSI value of 33.34 suggests the market is nearing the oversold zone.
- **Stochastic Indicator:** K-line at 24.50 and D-line at 22.57 indicate the market is already in the oversold zone.
🔍 **Analysis:** This situation shows strong selling pressure, but a potential price reversal or short-term correction could occur soon. Cautious traders may wait for clear reversal signals.
---
#### 📈 Moving Averages Analysis (EMA and SMA)
- **Short-term Averages (10-Day):** EMA at 0.6866 and SMA at 0.6819 are above the closing price of 0.6775, indicating bearish momentum.
- **Long-term Averages (50- and 200-Day):** Both EMA50 and EMA200 are also above the current price, reinforcing the bearish market sentiment.
🔍 **Analysis:** The downward movement relative to all moving averages across timeframes provides a strong sell signal. Traders may capitalize on this situation by selling or entering short positions.
---
#### 🔍 Key Indicator Analysis (MACD, CCI, and Momentum)
- **MACD Indicator:** The MACD value is -0.024, with the signal line at -0.025. The MACD line is below the signal line but close to a bullish crossover.
- **CCI Indicator:** The CCI20 value of -82.30 indicates an oversold condition.
- **Momentum Indicator:** The Momentum value of -0.029 confirms declining price strength.
🔍 **Analysis:** These indicators continue to signal selling pressure, though there is a slight possibility of a minor reversal in the short term.
---
#### 🛑 Key Support and Resistance Levels
- **Support Levels:**
- First support level: 0.6830 (based on classic pivots).
- Second support level: 0.5832 (based on classic pivots).
- **Resistance Levels:**
- First resistance level: 0.8686 (based on classic pivots).
- Second resistance level: 0.9684 (based on classic pivots).
🔍 **Analysis:** Traders may use the support level at 0.6830 as an entry point for short-term buying, while the resistance level at 0.8686 could serve as a take-profit target.
---
#### ✅ Summary and Recommendations
📉 **Recommendation:** The market is currently in a strong bearish phase. Traders can adopt short-term selling strategies and cautiously buy near identified support levels.
💡 If the price approaches the 0.6830 support level and is accompanied by reversal signals (e.g., rising RSI or positive MACD), a good buying opportunity may arise.
⚠️ **Disclaimer:** This analysis is AI-generated and should be combined with personal knowledge and experience. Trading decisions are solely your responsibility.

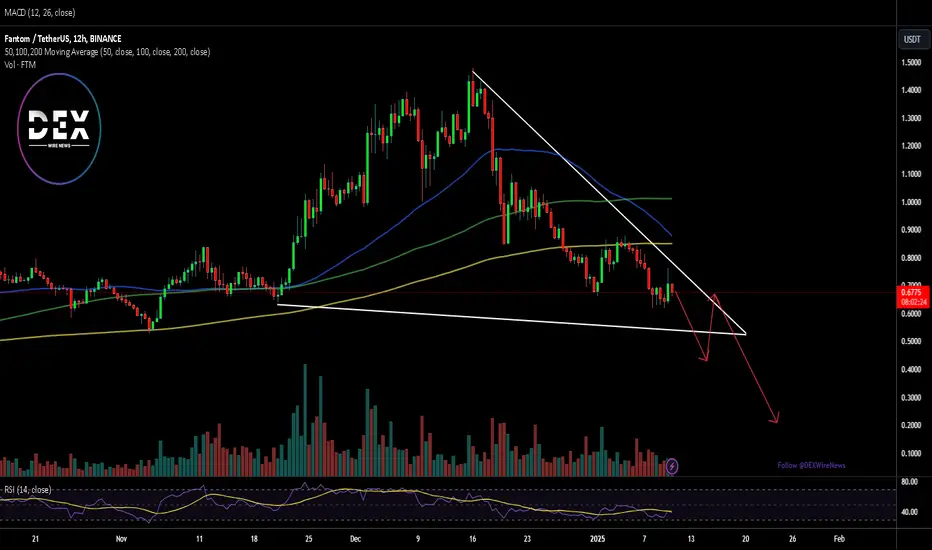
Bearish monthly for FTM S more dump incomingFTM S monthly broke through critical support on the HTF and is now poised for further downward correction. Don't worry, maybe when they launch new charts with S, it will not be visible. We will, however, remember...
