🟢 FTMUSDT - 1D (17.09.2022)FTMUSDT
TF: 1D
Side: Long
Pattern: 78.6 Fib Retracement Bounce
Leverage: 5x
Entry: $0.2483349
SL: $0.2209672
TP 1: $0.2802929
Hold for few days. Should get one giant daily green candle to hit that TP so set limit order at that TP.
You can hold longer if you want but I am just going for the TP 1.
Will not use SL myself, will aim to DCA the position as usual.
FTMUSDT


🔥 Fantom (FTM): do this if WHALES make a trapHi friends! Fantom is close to it`s bottom as the most of the altcoins. So it`s a good chance to make profit, because the biggest impulse happen after the accumulation at the dip.
Now i see that situation on crypto market is not clear, no trend, a lot of bad news, but a lot of signals that BTC close to bottom. As the altcoins follow the BTC we need to keep an eye on it.
✅ I marked on the chart volume bars growing every single time when FTM reaching the bottom. A big chance that the whales (buyers) buy FTM to sell it higher!
📊 Look for this to open a long:
🔥 collection the liquidity (trap of sellers and buyers) bellow the $0.25-0.28 value area
🔥 volume growth on the volume indicator (the whales are here)
🔥 squeeze to the trendline
🔥 whales BUY orders on DOM and Footprint
🚩 DOM and Footprint are the tools that i use for scalping. They help me to identify the best places to buy and sell crypto with the whales. Everyone can use because it`s avaliable for free.
📊 The targets:
1. $0.28 - the top of the value area
2. $0.33-0.375 - the value area
💻Press the "boost"🚀 button, write comments and share with your friends - it will be the best THANK YOU.
P.S. Personally, I open an entry if the price shows it according to my strategy.
Always do your analysis before making a trade.

Possible Scenario Fantom has broken rising channel and and pullback is completed .we may see more dump!!!

FTM/USDT :: Step by Step !!_It looks like Da Vinci painted it .
FTM/USDT :::
Short , Long Both of them are good options .
Just follow the support and resistance .
am I right ?

DAY 4 #FTMUSDT (LONG) DAY 4: #FTMUSDT (LONG)
2% of the deposit
Margin: isolated
⚖️Leverage: x10-20
🗝Entry point: 0.2595-0.25603
🎯target 1 - 0.2653
🎯target 2 - 0.2712
🎯target 3 - 0.2770
🎯target 4 - 0.2827
🎯target 5 - 0.2894
❌stoploss: 0.2532

$FTMUSDT UPDATE!!!!Hi Snipers,
Please refer to the recording for the next price levels and scenarios.
Thanks
MS

Fantom (FTM) - September 5Hello?
Welcome, traders.
By "following", you can always get new information quickly.
Please also click "Like".
Have a good day.
-------------------------------------
(FTMUSDT 1W chart)
Whether or not it can move higher than 0.3661 is crucial.
(1D chart)
Resistance: 0.3206-0.3661
Support: 0.1892-0.2372
In order to turn into an uptrend, it must rise above the HA-Low indicator.
So, we need to see if we can rise above 0.3018.
------------------------------------------------------------ -----------------------------------------------------
** All descriptions are for reference only and do not guarantee a profit or loss in investment.
** The MRHAB-T indicator, which is inactive on the chart, contains indicators that indicate support and resistance points.
** Background color of Long/Short-S indicator: RSI oversold and overbought sections
** Background color of CCI-C indicator: When the short-term CCI line is below -100 and above +100, oversold and overbought sections are displayed.
** The OBV indicator was re-created by applying a formula to the DepthHouse Trading indicator, an indicator disclosed by oh92. (Thanks for this.)
(Short-term Stop Loss can be said to be a point where profit and loss can be preserved or additional entry can be made through split trading. It is a short-term investment perspective.)
---------------------------------

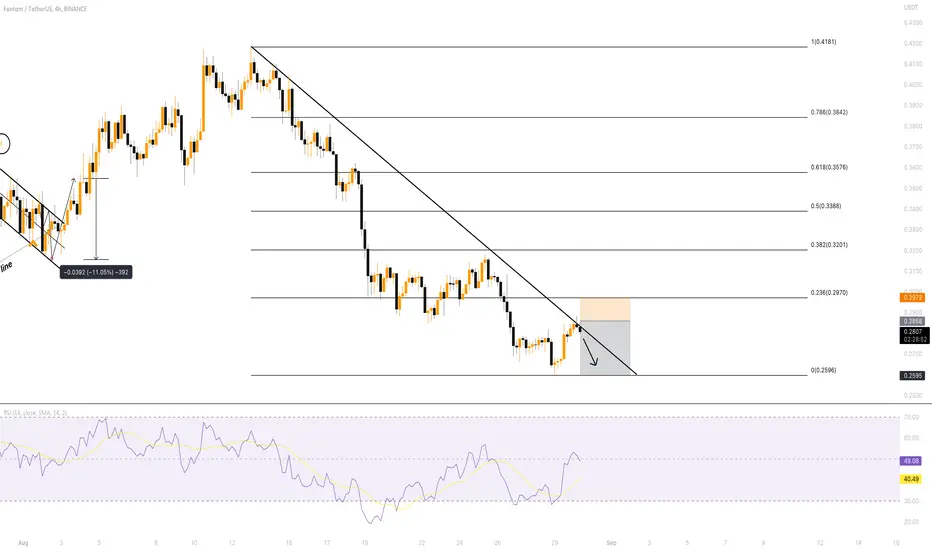
FTM / USDT 4H Interval - Targets and ResistanceHello everyone, let's take a look at the 4H FTM to USDT chart as you can see the price is moving at the high end of the local downtrend channel.
Let's start by setting goals for the near future that we can consider:
T1 - $ 0.2739
T2 - $ 0.2818
T3 - $ 0.2891
T4 - $ 0.2959
and
T5 - $ 0.3053
Now let's move on to the stop loss in case of further market declines:
SL1 - $ 0.2709
SL2 - $ 0.2664
SL3 - $ 0.2604
and
SL4 - $ 0.2430
Looking at the CHOP indicator, we can see that in the 4H range we have a lot of energy and the MACD indicator shows a local upward trend.

Bullish on Fantom, bears weaken, bulls are gaining momentum The price is up and down between the box area. The bulls are accumulating more and more position, and I think it will go back to the resistance at 0.3168, and if the bull is strong, we might see a pump to 0.4135.

FTM Potential Short / LongThe above chart is based on symbol FTMUSDT - Binance.
Alerts have been set.
The trading plan is to ladder in 0.25% below Entry, on Entry and 0.25% above entry.
Stoploss(SL) is at 1.5%.
Risk Management is always important. Let the trade come to you.
Take Profits(TP) at 1% increments.
First TP1 will have a higher percentage of take profit.
If/when TP1 is hit, SL will be move to entry.
Do Techincal Analysis(TA) stick to your plan, let the trade come to you, and don't FOMO, if your plan does not come to fruition (not hit) then you have not lost any money, have a SL to ensure best practice so you can continue trading, journal your trade for self development and reflection.

$FTMUSDT UPDATE!!!Hi Snipers,
Please refer to the recording for the next price levels and scenarios.
Thanks
MS

FTMUSDT 4H analysis ftm has hit the resistance zone and is falling , the support zone has been identified.


FTM Spot buyingFTM has come to the HTF point of interest for me where I look for a potential higher low on the daily time frame. although I expected lower prices, the 4h chart is changing the market structure from bearish to bullish so I started to DCA into a spot position on this coin, looking for a potential 40 to 50 percent gain. if the lows at 0.22 cents are breached my idea is invalidated and I will scale out of this position.

FTMUSDT |Overview|Hello everyone, I wrote a new idea for you. I think it's easy to like and subscribe to the channel, thanks😉
📌 In the short term, I see such a scenario, we fought off the countertrend two and go down.
📌Short Stop set for the countertrend, in case of a breakdown, we can test the $3 zone
hello guys today must buy ftm. <33$ftm - Fantom - things are about to get silly in the market - expect $ftm to pop quickly - be smart - do not blame the chain - this is manipulation. Anything above .90 in this market condition is a sell - take profits where possible. dont forgt stop loss and dont gt rekt

Good Potential for FTMUSDTit should start when it hits my gray line in long position and then goes up to my target...
Be Rich and Happy *-*


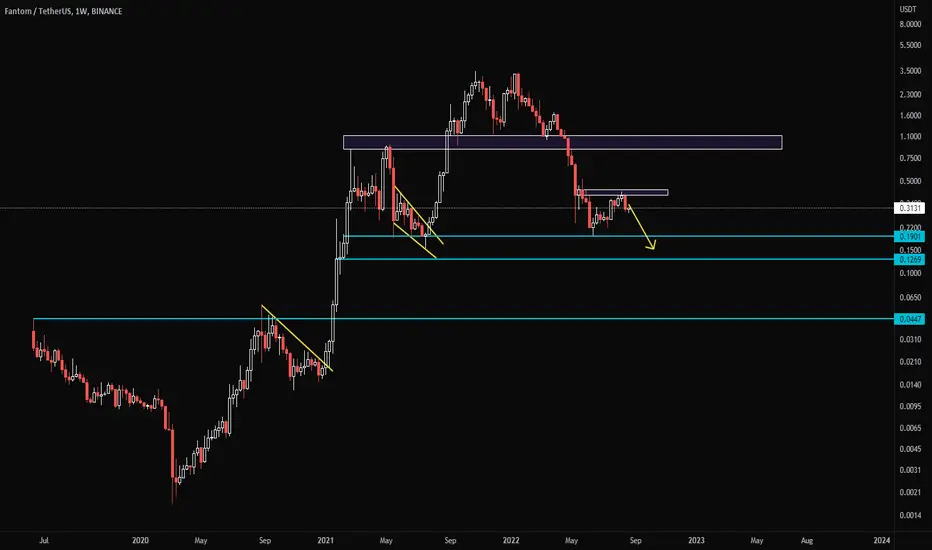
FTM HTF ChartI think FTM is undervalued at this market cap, it's like rank 65, should be in top 30 for sure. Wouldn't be bad to pick this one around 0.13$ for long term, I think it will sweep the current lows.
Fantom (FTM) - August 25Hello?
Welcome, traders.
By "following", you can always get new information quickly.
Please also click "Like".
Have a good day.
-------------------------------------
(FTMUSDT 1W chart)
The interval 0.3661-0.4874 is the interval that determines the trend.
So, the key is whether it can move higher than 0.3661.
- As the Stoch RSI indicator is falling, it is necessary to check if it is supported above 0.2665 when it turns upward.
If it doesn't, it's expected to drop to around 0.1280.
(1D chart)
The HA-Low indicator is showing signs of going up.
Therefore, it is important to be able to rise above the HA-Low indicator point and above the 60 SMA line.
If the climb fails, you should check to see if there is support around 0.2665.
If not, it should be supported in the 0.1892-0.2372 interval.
- Since the RSI indicator has not yet moved out of the oversold zone, it is natural for further declines to occur.
However, as the Stoch RSI and CCI(9) indicators are out of the oversold zone, and the Stoch RSI indicator is showing an upward trend, it can be said that there is a possibility that it will rise further.
At this time, what is important is whether it is supported or resisted at the HA-Low indicator point, the 60SMA line.
When using most indicators, what matters is how they perform at support and resistance points.
Therefore, the ability to establish support and resistance points should be a priority when studying charts.
Prices can always go up or down.
Occasionally, there are people who comment on such things.
That's natural, but if you don't know the settings for support and resistance points and the movements at those points when you look at the chart, it's just a comment accusing you of being a worthless analysis.
At the heart of chart analysis is neither Elliott wave nor trend.
The most important key is support and resistance.
This is because the win or loss of a trade is determined by what kind of trading strategy you make at the support and resistance points.
You might ask yourself whether you need to know how far to rise or how far to fall before you can create a trading strategy, but it is not.
At the heart of your trading strategy is whether you can create a way to reduce your losses.
If you can't come up with a way to reduce your losses, you shouldn't even start the trade at all.
The MRHAB-T indicator used in this chart is a private indicator, but if the chart is shared, the indicator can be used normally.
Among the indicators included in the MRHAB-T indicator, indicators are included to indicate support and resistance points.
------------------------------------------------------------ -------------------------------------------
** All descriptions are for reference only and do not guarantee a profit or loss in investment.
** The MRHAB-T indicator, which is inactive on the chart, contains indicators that indicate support and resistance points.
** Background color of Long/Short-S indicator: RSI oversold and overbought sections
** Background color of CCI-C indicator: When the short-term CCI line is below -100 and above +100, oversold and overbought sections are displayed.
** The OBV indicator was re-created by applying a formula to the DepthHouse Trading indicator, an indicator disclosed by oh92. (Thanks for this.)
(Short-term Stop Loss can be said to be a point where profit and loss can be preserved or additional entry through split trading. It is a short-term investment perspective.)
---------------------------------

FTM/USDT TA AUGUST 21, 2022After a bearish weekend alongside btc, ftm made a double bottom as you can see from a chart. Slowly building momentum and potential harmonic patterns. 1st pattern (big) is a potential cypher pattern. If you try to study the chart, it can also be seen that it's potentially forming an inverted head and shoulder (no right shoulder yet.) A small potential cypher pattern as well can be formed which can be the right shoulder for our TA.
p:s this is my own technical analysis. Trade at your own risk.

FTM Scalp long - Time to rise babyTake a look at this beautiful setup!
⭐️ BTC looks bullish
⭐️ Accumulation 3 days
⭐️ Domination looks bearish
⭐️ We have volume at bottom, someone is holding the price
⭐️ 4th approach
⭐️ Over VWAP
Will enter when price makes a trap, then slowly squeezes to the trendline on 5m timeframe, the base will form and the tape will get faster.
Fix profit by parts:
1% - 1/3
2% - 1/3, stoploss to breakeven
What's left, hold to the maximum
What do you think of this idea? What is your opinion? Share it in the comments📄🖌
If you like the idea, please give it a like. This is the best "Thank you!" for the author 😊
