UKX Hourly - Good RR for a small longRsi divergence coupled with some long tailed candles. Small long targetting 7085.. Stop at the todays lows
FTSE

UKX Hourly - Decent RR for a bounce I think theres a decent RR on offer here for a small long... stop at this mornings lows. Targeting 7140, 7155 and 7180

Elliott Wave View: Rally in FTSE Expected to FailShort-term Elliott wave view in FTSE suggests cycle from September 20, 2021 low has ended with wave (1) at 7403.36. The Index is currently correcting that cycle within wave (2). Internal subdivision of wave (2) is unfolding as a zigzag Elliott Wave structure. Down from wave (1), wave ((i)) ended at 7342.61 and rally in wave ((ii)) ended at 7370.01. Index resumes lower in wave ((iii)) towards 7241.99 and bounce in wave ((iv)) ended at 7289.51. Final leg lower wave ((v)) ended at 7198.76 and this completed wave A.
Rally in wave B is in progress to correct cycle from November 12, 2021 high. Internal subdivision of the rally is unfolding as another zigzag in lesser degree. Up from wave A, wave ((a)) ended at 7307.89 and pullback in wave ((b)) ended at 7245.98. Near term, expect the Index to extend higher in wave ((c)) towards 100%-123.6% extension area at 7355.55 – 7381.47 . This should complete wave B in higher degree before the Index turns lower. As far as pivot at 7403.36 high remains intact, expect the rally to fail in 3, 7, or 11 swing for further downside in wave C.

UKX Hourly - Bear flag loading After a false break higher out of the upward channel (bearish), the sell off has been relatively quick. Currently a bear flag building. First target is 7185 with lateral support coming in around 7140

UK100 - Breakout or Correction Imminent?The UK100 has been on a good run in recent weeks, in keeping with the broader trend in stock markets that have reacted very positively to a strong third-quarter earnings season.
This followed an adjustment prior to the start of the season as investors started pricing in earlier and earlier rate hikes, not to mention more of them over the next couple of years, in response to higher inflation signals.
Broadly speaking, they find themselves caught between two opposing forces at the moment. Earnings euphoria and inflation fear which is why in many markets we're only seeing marginal moves and in some, simply treading water and waiting for the next signal.
So for the FTSE to continue making steady, albeit small gains has been encouraging. It has recently run into resistance though at 7,400 which is a notable historic level of support and resistance, as the big round numbers so often are. It was particularly the case in the late summer to early winter period of 2019 when it really struggled to break above here. We all remember what came shortly after.
For the first time since the pandemic, it's trying to break back above here again but it's struggling once more. The MACD and stochastic show it was struggling for momentum in the days leading up to the level and we appear to have since seen some profit-taking.
This begs the question, is a breakout imminent or are we facing a deeper correction after a decent run? That will depend on how the index responds around 7,300-7,320.
Not only is this the next big number down, but it also coincides with the 55/89-period SMA band on the 4-hour chart that has tracked the rally higher, offering support on any pullbacks. A break below here could signal a deeper correction.
A rebound off here could trigger another run at 7,400. If this happens, the momentum indicators will be key. And a failure to make a new high will be another red flag as far as the rally is concerned.

Elliott Wave View: FTSE Extending in Wave 5Short Term Elliott Wave view on FTSE suggests the rally from September 20, 2021 low is unfolding as a 5 waves impulse. Up from September 20 low, wave 1 ended at 7159.61 and dips in wave 2 ended at 6945.50. The Index then rallies higher in wave 3 towards 7281.176, and pullback in wave 4 ended at 7192.05. Internal subdivision of wave 4 unfolded as a zigzag structure as 30 minutes chart below shows. Down from wave 3, wave ((a)) ended at 7219.71 and wave ((b)) ended at 7251.55. Wave ((c)) of 4 lower ended at 7192.05.
Wave 5 higher is currently in progress with internal subdivision as another impulse in lesser degree. Up from wave 4, wave ((i)) ended at 7303.39 and pullback in wave ((ii)) ended at 7232.28. Wave ((iii)) rally is in progress as another impulse in lesser degree. Up from wave ((ii)), wave (i) ended at 7331.25 and dips in wave (ii) ended at 7268.79. Near term, expect wave (iii) to end soon, then it should pullback in wave (iv) before the next leg higher in wave (v) of ((iii)). Near term, as far as pivot at 7232.28 low stays intact, expect dips to find support in 3, 7, or 11 swing for more upside.

UKX Hourly - Top of channel + divergence continuesOnce again at the top of the channel. Bearish RSI divergence continues. Good RR for a short

FTSE on the rise.. Short back down to the strong support.From a Pro FTSE Stock Index trader..
Looking for the FTSE to come back to the Support + Mixture of MA's and we will look long again. For now, It is short back down to this area, where we will then flip long.
Lets get it!

UKX Hourly - Top of channel, RSI divergence Index has reached the top of the upward channel. I would expect to see a pullback here. RSI has failed to make a higher high in line with the price action, indicating divergence.

UK100 buy running ⤴️🙌We are using our POW reversal strategy for this trade a UK100 long.
Trade details for current trade are shown on the chart.
We are working the 15M time frame on this strategy.
We're looking for the green line which is take profit target.
Little blue arrow is entry point and purple line is stop loss.
Trade history can be seen at the foot of this trade idea too for full transparency.
Previous trades also can be seen on chart.
Both were long trades and both found TP so lets see if we can go three for three.
------------------------------------------
I try and share as many ideas as I can as and when I have time. My trades are automated so I am not sat in front of a screen daily.
Jumping on random trade ideas 'willy-nilly' on Trading View trying to find that one trade that you can retire from is not a sustainable way to trade. You might get lucky, but it will always end one way.
------------------------------------------
Please hit the 👍 LIKE button if you like my ideas🙏
Also follow my profile, then you will receive a notification whenever I post a trading idea - so you don't miss them. 🙌
No one likes missing out, do they?
Also, see my 'related ideas' below to see more just like this.
The stats for this pair are shown below too.
Thank you.
Darren

$UKX Hourly - Target hit & can re-enter short We hit target out the gates this morning, but the subsequent bounce has offered another opportunity to re-short. Stops at 7255. Targeting initially 7190, but would like to see 7150 tested. Month end today so volatility not unusual.
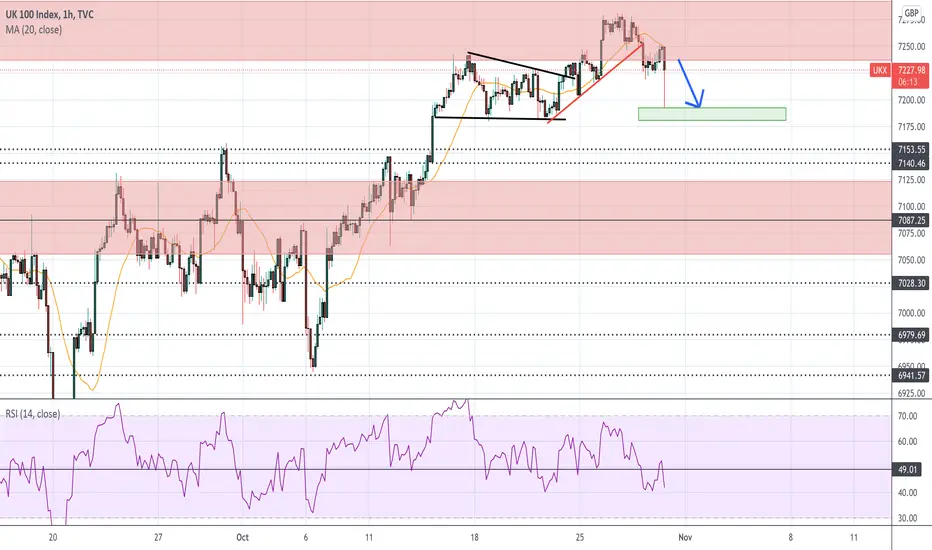
UKX Hourly - Consolidating below prior support Index has broken upward sloping support and has been consolidating below prior support for the majority of the day. I favour further downside - looking initially for 7180 region.

Elliott Wave View: FTSE in wave 4 PullbackFinancial Times Stock Exchange (FTSE) has continued higher following other major indices world wide. Short term Elliott Wave view suggests the rally from September 20, 2021 low is unfolding as a 5 waves impulse Elliott Wave structure. Up from September 20 low, wave 1 ended at 7159.61 and pullback in wave 2 ended at 6945.04. Index then resumes higher in wave 3 towards 7243.85. Internal subdivsiion of wave 3 is unfolding as an impulse in lesser degree.
Up from wave 2, wave ((i)) ended at 7146.85 and pullback in wave ((ii)) ended at 7063.43. Index then extends higher in wave ((iii)) towards 7243.85. Index then pullback in wave ((iv)) which completes at 7180.20. Afterwards, it resumes the rally to 7281.17 to complete wave ((v)) and wave 3. Wave 4 pullback is currently in progress to correct cycle from October 6 low before the rally resumes. Potential support area for wave 4 comes at 7153 – 7202. This is 23.6 – 38.2% Fibonacci retracement of wave 3. Near term, as far as wave 2 pivot at 6945.04 low remains intact, expect wave 4 pullback to find support in 3, 7, or 11 swing for further upside.

FTSE 100 TESTING POST-COVID HIGHSFollowed by news for less than expected inflation expansion in the UK and an hourly uptrend since 6 Oct, FTSE is expected to retest POST-COVID highs.
Technical analysis for fibbonaci extensions levels and Elliot impulse wave, suggest that a final extensions WAVE 5 is expected towrd 127.2% extensions of current trend. (7335.1)
Open Position at100% breakout (7250.8)
Take Profit at 127.2% extensions (7335.1)
Stop Losses at 78.6% support of current trend fib exntesions (7184.5)

VUKE Daily - Lightening position here Taking some profits here as we hit resistance. Will looking to start accumulating again if/when we re-test 31. I was overweight the ETF ahead of the divi so happy to go slightly underweight here

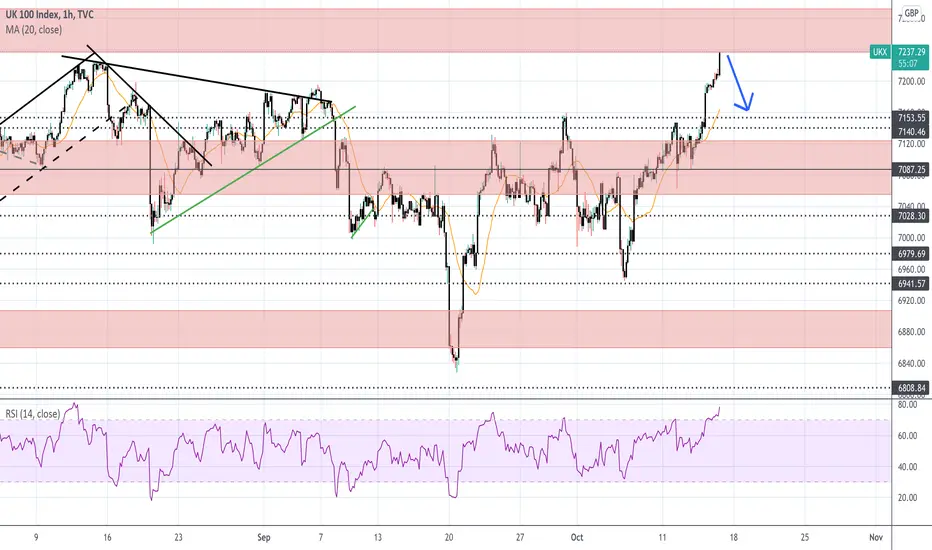
UKX Hourly - Time for a cool off Massive push higher this week on FTSE and RSI looking very overstretched on shorter time framed charts. Good place to take profit on long positions or alternative a small short position with a tight stop. Would like to see the 7060 area re-tested
UK100 - Possible re-test of the channel before break.Hello everyone,
I hope you are all doing amazing!
We are currently sitting at the resistance of the channel we have formed on the Daily.
There are 2 support levels to look for on the chart, where if Short position is taken, may be used for TP.
Wish you all good luck!

Denial of Contagion is futile.The China market is very dependent on several industries: Technology, Real Estate, Manufacturing.
Chip Shortage, Evergrande defaults and Power Outages directly opposes the rise in these industries. Triple Whammy.

BUY AGROBuy area at 2480-2460
Stop lose if break 2300
TP at 2850 for 1 week (swing trade)
On 28 September 2021 at 14.00 WIB, Bank Agro will hold a meeting with shareholders (RUPS).
with agenda, discussion
1. company name change
2. Super apps launch
With this good catalyst, we can assume that market players will increase AGRO's stock price. IDX:AGRO

UK100 - Survived the first testThe rally in UK stock markets has looked vulnerable for some time and with investors seemingly getting nervous in recent weeks, leading to some interesting pullbacks, a larger correction could lie ahead.
A break below 7,000 a couple of weeks ago could have triggered a much steeper decline but the index ran into strong support around 6,800 where the 200/233-day SMA band cushioned the sell-off.
While it has since broken back above that key moving average band, it has failed to reach the last peak and the few times it has tried, it has been firmly pushed back.
While 7,000 has offered some support over the last week, the level still looks vulnerable and a move below could quickly see the 200/233 SMA band come under pressure once more. A break of this and things start to look far more bearish.

UK100 long is valid Trade details for current trade are shown on the chart.
We are working the 15M time frame on this strategy.
We're looking for the green line which is take profit target.
Little blue long arrow is entry point and purple line is stop loss.
Trade history can be seen at the foot of this trade idea too for full transparency.
Previous two trades can also be seen on chart.
------------------------------------------
I try and share as many ideas as I can as and when I have time. My trades are automated so I am not sat in front of a screen daily.
Jumping on random trade ideas 'willy-nilly' on Trading View trying to find that one trade that you can retire from is not a sustainable way to trade. You might get lucky, but it will always end one way.
------------------------------------------
Please hit the 👍 LIKE button if you like my ideas🙏
Also follow my profile, then you will receive a notification whenever I post a trading idea - so you don't miss them. 🙌
No one likes missing out, do they?
Also, see my 'related ideas' below to see more just like this.
The stats for this pair are shown below too.
Thank you.
Darren

UK100 - Bearish Case Building?The UK 100 has struggled to push on over the last month, with nerves in the markets seemingly taking their toll on the rally.
We've seen a couple of pullbacks that appeared to indicate the index was vulnerable to a larger correction but each time it showed strong resilience and headed back towards the highs.
Recently though, the bearish case has been building. The index has broken below the 55/89-day SMA (again) and stayed there for several days. What's more, it's become an interesting area of resistance since the breakout.
Since then it has consolidated around this level rather than reversing quickly higher as it has previously. The consolidation alone is hardly an encouraging sign, rather a continuation signal that suggests further moves lower could be on the cards.
To back this up further, the index has found strong support around 7,000, a major psychological barrier but a recent rally off this made a lower high which could be an early sign of a descending triangle forming, a bearish pattern.
From a fundamental perspective, there's plenty of downside risks appearing that appears to be driving the shift in sentiment. Higher inflation, slower growth, rising Covid cases and tighter monetary policy to name some. But there's plenty more.
Perhaps we'll soon forget about some of these and the fortunes of others will change but right now, a case not to be bullish is certainly building.
Which begs the question, how will we know if the markets have turned more bearish and how far will they fall. Both are difficult to answer but a break of 7,000 would certainly be one signal. A break of the 200/233-day SMA band around 6,800 another.
There is plenty that can happen that can improve the fortunes of stock markets. Central banks are the obvious one, a powerful one at that which for so long has kept investors buying the dips when the fundamentals don't necessarily warrant it.
A delay on tapering beyond the end of the year and investors may be back on board. But the coming months will certainly be an interesting test and there may be a few twists and turns along the way.

FTSE 100 1-day classic patternsWhat has the highest probability of occurring?
Since early May 2021 price has rotated from 7200 resistance to 6800 support and back again on 2 occasions.
There are two classic patterns forming within these rotations.
The broadening top is currently valid with 3 tests of the upper trendline. The recent rejection at 7200 appears to be what Bulkowski describes as a partial decline having tested the 50% fib retracement.
This projects a target of 7700.
There is also a triple top that would need to test 6800 support again to become valid.
Further a breakout from the triple top projects a target of 6350, the low of the year. This would fulfil the tape chatter of "a healthy 10% correction".
N.B. these patterns are forming over a 4-month period. It is probable that the eventual outcome will be a powerful move.
Objectively the triple top is not confirmed until a test of 6800 has occurred. So the bias is long in the framework of the broadening top. Given the partial decline it is probable that market participants are already getting long. The long trade is invalidated once price touches the lower trend, validating the triple top. Using 6800 as a stop loss from current levels yields 2R to 7700. If this is too large a stop classic patterns on a lower timeframe should be employed to fine tune stop placement.
