VUKE Daily - Tomorrow LDT for juicy 46p diviTomorrow is the LDT for a 46p divi = 1.46% simple divi yield off current price. Also appears as though the ETF has formed a triple top - but as the saying goes "no such thing as a triple top". I am hoping we power through to resistance around 33. I had been averaging into my ISAs and SIPPs the for past few days in anticipation of the dividend and next leg higher.
FTSE

Safe trend indicator - By MutebHi
my name is Mutab.
42 years old.
Interested in following the stock market.
Innovative of ( safe trend indicator ).
a great indicator for a long-term investment. Keeping up with the rising waves and avoiding the descending waves, to achieve amazing long-term investment goals.
-------------------------------------------------------------------
What distinguishes the safe trend indicator?
It is one of the safest indicators in dealing with the financial markets.
* Direct indicator, no need to wait for the candle to close to confirm the decision.
* It keeps up with the ascending waves and avoids the descending waves.
* Very effective in investing in the long term.
* Amazing long-term results.
* High stability while reading the candle, as it does not give an opposite reading except in rare cases.
* Few errors compared to successes, which means that the ratio of losses to profits is very small, which enables the investor to achieve high profits in long-term investment.
-------------------------------------------------------------------
I am using it now in my trading in the Saudi stock market and it is yielding amazing results in my long term investment (quarterly and half yearly).
It gives me great pleasure to share with you my success story, as I publish a weekly report and I record and display the week's trades to prove the feasibility and credibility of the indicator.
I wish you success.

UKX Hourly - Testing resistance watching closely for a potential break higher. Currently testing downward sloping resistance. A break and hold above 7185 targets 7235

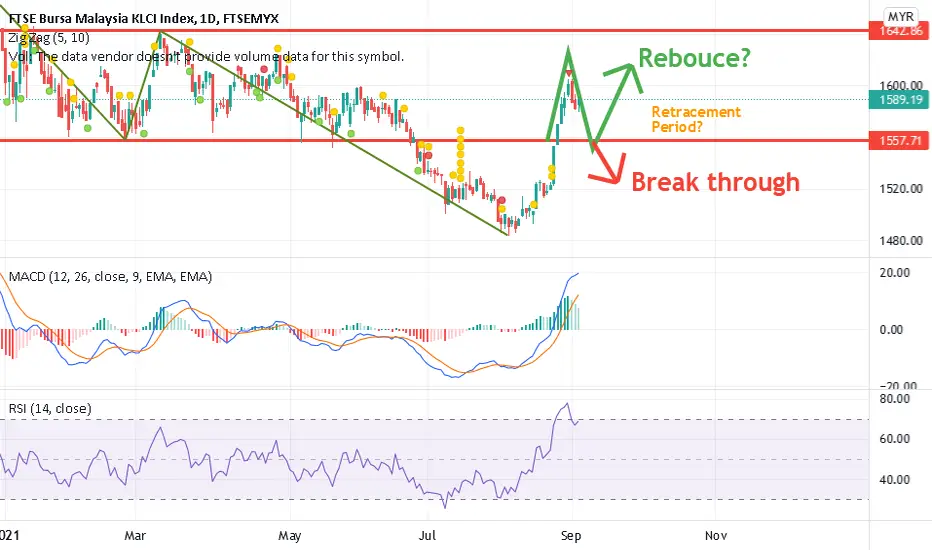
FTSE for next week 06 September to 10 SeptemberThe rising of the ftse has ended this weekend, therefore next week may enter into Retracement period. It may take one week or with two week to complete the retracement, then might rise again.
The reason of the prediction is because if we look into week trend, the new higher point is just about to start. This give us credible basis to believe that the trend will rise further in the future.
If next week break through 1557, the trend may drop further but small probability . If rebounce, may look forward to 1642 as the new high point for next two week.
Therefore the suggestion is, observe the trend until it reach 1557, then wait for the rebouce or break through. But, there is more chance to rise in the future if you refer to the week trend of FTSE.
All the prediction above just assumption, and it is not an advise to purchase or sell the share, please be responsible to your own trade behaviour.
Hope all of you may earn more money and be a rich man/woman.
Idea of the FTSE trend for 30/08 - 03/09We have a nice week at 23/08 to 27/08, however we have to prepare for the retracement in future. It might be a big retracement day before National Day, after that might start to drop. Simple analysis as my main analysis is Hang Seng Index, but the whole week may be a bearish trend

UKX Hourly - Push higher likely to stallI would be surprised if this bounce continues much higher before a pullback/some consolidation. We are hitting double resistance - Lateral and downward sloping. There is also some hidden bearish RSI divergence. Ideally would like to see 7070 tested and then will re-assess

UKX Hourly - Remains bearish below 7190We've had a bounce off oversold levels this morning but my bearish thesis remains whilst we are below 7190. Next downside target is 7060.

FTSE 2017 fractal points to a 7500 topThis is a fractal analysis on FTSE from 2017. Not much description is needed here, the chart is quite straightforward. The 2020-2021 (Fractal B) price action so far is similar to the 2016-2017 (Fractal A) sequence. They both started after the market bottomed out on a 1W Death Cross and have been rising with only medium-term pull-backs when the price hit a Higher Highs (dashed) trend-line. In 2017 the index made the next Higher High within the 1.618 - 1.786 Fibonacci extension and topped on the 2.0 Fib mark. If the pattern continues to repeat itself, then FTSE may make a Higher High within 7330-7430, pullback and go for a market top at 7550.
Do you find this comparison reliable?
Most recent FTSE idea:
** Please support this idea with your likes and comments, it is the best way to keep it relevant and support me. **
--------------------------------------------------------------------------------------------------------
!! Donations via TradingView coins also help me a great deal at posting more free trading content and signals here !!
🎉 👍 Shout-out to TradingShot's 💰 top TradingView Coin donor 💰 this week ==> nevada999
--------------------------------------------------------------------------------------------------------

UKX Hourly - Bearish engulfing The Hourly bearish engulfing candle confirms my short thesis as well as puts a line in the sand as a stop loss (7225). It has been a frustrating ride so far so hoping we can pick up some momentum to the downside

Elliott Wave View: FTSE Nesting Higher As ImpulseShort-term Elliott wave view in FTSE suggests that the pullback to 19 July 2021 low (6812.84) ended wave (4). Up from there, the index is nesting higher as an impulse sequence within wave (5) favoring more upside extension to take place. While the initial bounce to 6929.89 high ended wave ((i)), wave ((ii)) pullback ended at 6827.26 low, wave ((iii)) completed in lesser degree 5 waves at 7018.95 high. Wave ((iv)) ended at 6956.24 low, wave ((v)) ended at 7033.27 high thus completed wave 1.
Down from there, the index made a pullback in wave 2 to correct the cycle from 7/19/2021 low. The internals of that pullback unfolded as Elliott wave flat structure where wave ((a)) ended at 6980.67 low. Wave ((b)) ended at 7038.65 high and wave ((c)) ended at 6929.64 low. Above from there, the index started the next leg higher in wave 3 and ended lesser degree wave ((i)) at 7093.93 high. Then wave ((ii)) pullback ended at 6996.93 low and resume the rally higher again.
Whereas lesser degree wave (i) ended at 7142.54 low, wave (ii) ended at 7089.74 low. Near-term, as far as dips remain above 7089.74 low and more importantly above 6812.84 low then FTSE is expected to extend higher in lesser degree wave (iii) towards 7236.10- 7326.35 area higher before entering into a wave (iv) pullback. We don’t recommend selling and expect dips to find support in 3, 7, or 11 swings for further upside.

UKX Hourly - Approaching double resistance FTSE has a habit of issuing a signal then giving one last final squeeze - is the same happening again post the break down of the rising wedge? I'm still holding onto my prior shorts and using this opportunity to add. Currently at double resistance at 7190. RSI also showing divergence as well as being overbought. Good RR here I reckon for a short.

UK100 - A major breakout imminent?The UK100 is closing in on 7,200 and approaching levels not seen since the start of the pandemic.
This isn't the first time the index has eyed up this level in recent months but in the past it has failed to break through in any significant way - it briefly touched 7,217 a couple of months ago before reversing course - and each time a corrective move has followed.
This has left the FTSE trading between 6,800 and 7,200 since April but that could all be about to change.
While we may see some profit taking on approach, the MACD and stochastic suggest there's plenty of momentum still in the rally that could carry it to levels not seen in 18 months.
If we do see some profit taking, the rising trend line below could be interesting support if the rally is going to continue. A move below this would suggest a larger correction may be on the cards.


UKX Hourly - Hourly close here will confirm the break lower Bearish rising wedge has broken lower but need the hourly close to confirm. Downside targets are 7060, 7025, 6980 and 6940

FTSE- The Big ShortFTSE, Has completed this huge daily harmonic pattern since before the Covid pandemic, We could see a massive sell of in the indice, Money running to the $ could see a massive collapse in global stock markets, because they too me seem very over priced, considering the state of the overall world economy right now, with tensions brewing China, is it possible we see a massive sell off and pressure on the FTSE 100, time will tell.

UKX Hourly - Still favouring a short Top of channel again, coupled with lateral resistance. Bearish RSI divergence, as well as a potential rising wedge forming

UKX Hourly - Testing upper resistance againFTSE has shot higher this morning, but is testing the upper resistance of the megaphone pattern we identified last week. Coupled with bearish RSI divergence there is decent RR to go short here. I have already started scaling in

Stocks - What Next?Idea for indices:
- As expected, Robinhood IPO was the trigger for global sell-off (other factors involved obviously, but I have been posting about everything macro related in other posts).
- China continuing to lead down.
- Look how the deflationary wave hits HSI > Nikkei > EU > US. Dome tops forming everywhere.
- ECB actually has greater QE than US, so EU index performance is a critical tell for deflationary forces vs. QE.
- Watch China Tech ETFs to lead US indices down. Managers will need to also liquidate US positions as their portfolio % exposure becomes overweight.
I've been enjoying watching Nikkei lately - it just broke a critical support and 200 DMA (6m low), officially a bear market if it consolidates losses. However, it is still holding 50 WMA and 200 DMA in real performance... waiting for US markets for confirmation.
Bearish bias here, turning point is due. Aug 2 debt limit will be in focus. Early August is my trigger for reversal confirmation. If it holds, we can back off and try again later, but rugpull is definitely due.
Already short US indices (long vol).
Nikkei real performance (relative to currency):
Here is what I think will happen to Nikkei next:
GLHF
- DPT

UKX Hourly - Nice pullback off resistance Nice pullback this morning off the top of the megaphone formation identified yesterday. There is double support around 7015/25 = lateral and upward sloping. A break below here targets 6980 and 6940. 6900 would see the bottom of the megaphone formation and the next large support region shaded in red. My bias would like to see it lower - but ideally would need to wait for confirmation. Also need to bare in mind that its not unusual to see selling into month end followed by a rally at the beginning of the new month

UKX Hourly - Approaching top of megaphone Looking good for a short as it approaches top of megaphone formation within the red lateral resistance zone. RSI also looking stretched. First targets are 7055 and 7025

UKX Hourly - Lost channel supportLost channel support after testing significant resistance (breakdown level from last week). Targeting the red area = 6860/6900


NZDCAD H4 - Long SetupNZDCAD H4
Long setup indicated here, again another one carried forward from last week, looking to see if we double bottom from our interim support/resistance price. If we do, we have a solid 4.2R trade measured from our buy zone to take profit target.
We pushed just slightly shy of 2R on the latest bounce, but again, fresh week more volume. Lets see what we can capitalise on.
