FTSE - Stalled just in front of our entry level. Good enough?DAY TRADE - EXPIRES AT 9PM
We were looking for a dip to buy today but the market appears to have stalled in front of our entry level. Is this good enough reason to get long?
Overall we remain bullish.
Trade Idea
The overnight rally has been sold into and there is scope for further bearish pressure going into this morning.
Bespoke support is located at 7465.
Negative overnight flows lead to an expectation of a weaker open this morning.
As this corrective sequence continues we look to set longs on a dip at better risk/reward levels.
Further upside is expected although we prefer to set longs at our bespoke support levels at 7465, resulting in improved risk/reward.
We look to Buy at 7465
Stop: 7425
Target 1: 7545
Target 2: 7600
FTSE

FTSE - Buying dips to trend supportTrade Idea
The medium term bias remains bullish.
Bespoke support is located at 7470.
We look for a re-test of the upward trending support.
There is scope for mild selling at the open but losses should be limited.
Preferred trade is to buy on dips.
We look to Buy at 7470
Stop: 7440
Target 1: 7560
Target 2: 7650
Trade ideas & daily market report July 9th 2019
Market highlights
Reduced expectations of aggressive Fed easing continued to support the US currency during Monday, although ranges were narrow.
Equity markets lost ground as expectations of aggressive Fed rate cuts declined further.
Demand for the yen and Swiss franc weakened slightly as US bond yields edged higher with the Euro also unable to make headway.
Gold prices also declined as bond yields increased and the dollar maintained a firm tone.
Oil prices gained some support from Iran tensions, but failed to hold gains.
Commodity currencies were unable to make headway amid a solid US currency tone with Sterling also losing ground.
Bitcoin pushed above $12,000 which helped trigger further buying.

FTSE - Buying a move lower to supportTrade Idea
We have a Gap open at 7567 from 05/07/2019 to 07/07/2019.
Bespoke support is located at 7470.
We look for a re-test of the upward trending support.
There is scope for mild selling at the open but losses should be limited.
Preferred trade is to buy on dips.
We look to Buy at 7470
Stop: 7440
Target 1: 7560
Target 2: 7650
Daily market report July 8th 2019
Market highlights
Headline June US employment data beat consensus forecasts with an increase of 224,000 in non-farm payrolls, although other data was slightly weaker than expected.
Bond yields recovered sharply following the data on a shift in Fed expectations, although there was a partial reversal on Monday amid fragile risk conditions.
Equities declined in Asia on Monday amid reduced expectations of aggressive Fed rate cuts
The dollar advanced strongly following the employment release, although it failed to hold its best levels.
The Canadian dollar also pared initial losses from a headline dip in June employment with commodity currencies also recovering some losses.
Gold declined sharply on dollar gains with a dip below $1,400 per ounce before a tentative recovery amid weaker equity markets.
Oil prices were supported by reduced fears over global demand conditions.

FTSE - Buying dips towards trend supportTrade Idea
Prices are extending higher from the bullish flag/pennant formation.
Positive overnight flows lead to an expectation of a firm open this morning.
Bespoke support is located at 7530.
The continuation higher in prices through resistance has been impressive with strong momentum and shows no signs of slowing.
Preferred trade is to buy on dips.
We look to Buy at 7530
Stop: 7500
Target 1: 7630
Target 2: 7700

FTSE 100 - Awaiting a corrective move to get longTrade Idea
Prices are extending higher from the bullish flag/pennant formation.
Positive overnight flows lead to an expectation of a firm open this morning.
Bespoke support is located at 7530.
The continuation higher in prices through resistance has been impressive with strong momentum and shows no signs of slowing.
Preferred trade is to buy on dips.
We look to Buy at 7530
Stop: 7500
Target 1: 7630
Target 2: 7700
It’s a US holiday today so expect quieter markets today.

FTSE 100 - Extending higher from the bullish flag patternFX:UK100 , OANDA:UK100GBP , TVC:UKX
Trade Idea
Prices are extending higher from the bullish flag/pennant formation.
Positive overnight flows lead to an expectation of a firm open this morning.
Bespoke support is located at 7460.
The continuation higher in prices through resistance has been impressive with strong momentum and shows no signs of slowing.
Preferred trade is to buy on dips.
We look to Buy at 7460
Stop: 7430
Target 1: 7560
Target 2: 7600

FTSE Potential sell on weakening momentumWe have a nice sell setting up on the FTSE.
Price does need to break the ascending trendline for confirmation.

FTSE UK Stock Index ( 7,190 is a very strong support)Updated View On FTSE (16 Apr 2019)
Back Ground: The bullish "immediate" momentum has definitely slowed. There may be pullback along the way. Watch out the region of 7,190 regions as it may act as strong support.
Target(s): Neutral
SHTF: It will use 7170 to 7190 as strong support region.
DYODD, all the best and read the disclaimer too.
Feel Free to "Follow", press "LIKE" "Comment".
Thank You!
Legal Risk Disclosure:
Trading foreign exchange or CFD on margin carries a high level of risk, and may not be suitable for all investors.
The high degree of leverage can work against you as well as for you. Before deciding to trade foreign exchange you should carefully consider your investment objectives, level of experience and risk appetite.
The possibility exists that you could sustain a loss of some or all of your initial investment and therefore you should not invest money that you cannot afford to lose.
You should be aware of all the risks associated with foreign exchange trading, and seek advice from an independent financial advisor.
DISCLAIMER:
Any opinions, news, research, analyses, prices or other information discussed in this presentation or linked to from this presentation are provided as general market commentary and do not constitute investment advice.
Sonicr Mastery Team does not accept liability for any loss or damage, including without limitation to, any loss of profit, which may arise directly or indirectly from use of or reliance on such information.

Buying a retest of the breakout on FTSEFX:UK100 , OANDA:UK100GBP , TVC:UKX
Following on from our video analysis on FTSE yesterday signalcentre.com , we are buying a dip this morning at 7220.
For further information on the call, see the related idea below or click on the link above.
Good luck!

FTSE Outlook is increasingly bullish - Video analysisFTSE 100
TVC:UKX
FX:UK100
OANDA:UK100GBP
Weekly - Expanding wedge, bullish outside week posted.
Daily - Invalidated the head and shoulders setup that threatened to send the market lower.
4H - Bullish flag pattern completed with a measured move target at 7708. Potential inverse head and shoulders forming also.
Outlook is bullish - We will be looking to buy dips with an ultimate target of 7708.
Worth noting potential overhead resistance at the 78.6% Fibonacci level at 7433 and the previous highs at 7529.
Good luck!

"Full View on FTSE 100 (Uk100)" Analysis by ThinkingAntsOk4H Chart Explanation:
- Price bounced on the Resistance Zone.
- Price broke the Ascending Trendline.
- Now, it has potential to move down towards the Support Zone at 7122,8.
However, our long term views are long!
Weekly Vision:
Daily Vision:


FTSE 100 Index Chart (UKX) Bullish & Bearish ScenariosHello my dear readers, here we would like to take a look at two different scenarios FTSE 100 Index Chart (UKX).
Let's start with the bearish scenario because this is the one that is in play right now... Feel free to hit like to show your support.
Looking at the chart above, we can notice a huge descending channel (bold brown dashed line) and we have two rising wedges.
The first rising wedge resulted in very strong drop after the FTSE 100 broke below EMA10, this is marked with a red arrow.
The second rising wedge is in play now and the FTSE 100 already broke and closed below on EMA10 (green), EMA50 (magenta) and EMA100 (blue) lines.
Taking this into consideration and the bearish indicators, MACD and RSI, the FTSE 100 Index has high probabilities to continue falling, this is represented with another red arrow. The dashed green and red lines at the bottom represent the last low and strong support.
Conditions for change: Now we take a look at the bullish scenario. If the FTSE 100 (UKX) can break above EMA10, it has the chance to continue going up. Any trading below this indicator and the bearish potential remains.
We believe based on the chart as it is now, that the FTSE 100 can continue falling.
Thanks a lot for reading.
This is Alan Masters.
Namaste.

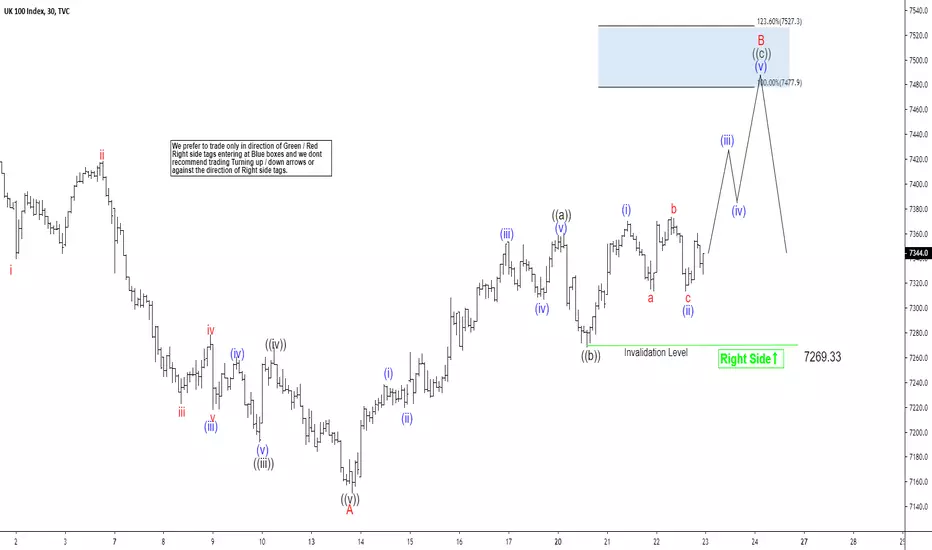
Elliott Wave View: Short Term Support in FTSEShort term Elliott Wave view in FTSE calls the move lower to 7150.9 on May 13 as wave A. This suggests that the move lower from April 23 is unfolding as a zigzag Elliott Wave structure. Wave B bounce is currently in progress to correct cycle from April 23 high before the Index turns lower. Internal of wave B is unfolding as another zigzag Elliott Wave structure in lesser degree.
Up from 7150.9, wave ((a)) ended at 7360.34 and wave ((b)) ended at 7267.84. Wave ((a)) unfolded as 5 waves where wave (i) ended at 7264.18 and wave (ii) ended at 7223.08. Index then resumes higher in wave (iii) which ended at 7353.51, wave (iv) ended at 7307.33. and wave (v) of ((a)) ended at 7360.34. While short term dips stay above 7269.33, expect Index to extend higher. Potential target for wave ((c)) of B comes at 100% – 123.6% extension of ((a)) which is 7477.9-7527.39. Index also should not break above May 13 at 7528.93 or else it will open further upside. If Index instead breaks below 7267.84, then either wave ((b)) is unfolding as an expanded Flat structure or wave ((c)) of B truncates and Index has turned lower.

FTSE UK100 - Short - new position (see related)Hi all
After shorting it on the initial down move, after the retrace, it has hit support and made an engulfing bearish candle on the 4 hour.
I now do expect it to head lower again, in turn gold to go higher and Yen pairs to go lower.
It is cycling lower nicely and an I think indices could be in trouble over the net few week.
Thanks for looking.
Duncanforex.com coming soon

Look for 94p / 95p retrace - slice 131p / 140p - RSI breakoutBullish trend could be forming now in BOKU after RSI breakout & making higher highs & hopefully a retrace to make a higher low.
Best to look for a retrace before a position taken 94-95p
A company that seems to be growing well since last year, please read latest RNS's.
Not holding but looks pretty interesting.
Look for a slice at 131p - 140p (some resistance at 50ma so perhaps a small slice there to be safe?)
quote from RNS:
2018 has been a year of growth and expansion for Boku. Volumes processed through the platform have more than doubled to $3.6 billion, further strengthening our lead as the world's largest independent carrier billing company. New customers like Netflix and Rakuten have started to use our platform and existing customers like Sony, Spotify and Apple have expanded their use. Revenues have increased by 45% and for the first time adjusted EBITDA was positive for the whole year.

FTSE Malaysia moves lower than expected.Although on the prior move, we knew that the KLCI will move lower to the support and trendline area which indicates the final wave (Z) correction and (e) in triangle. We were hoping that the price will bounce on these 2 support lines. It did for at least 2 weeks and moved 32.61 points above.
As of now, I will stay neutral on Malaysia's economic, if price breaks the support level (red colour line) or breaks the trendline level (blue colour line), then I would say Malaysia's economic will not regain its bull momentum anytime soon. However if it happens otherwise and the index rises up to break the upper trendline, then we are expecting the economic to recover to a new level within 1 to 2 years.
Regards,
Ejaz

FTSE 100: Approaching a short term support. Potential bounce.FTSE 100 is close to complete the -5.30% decline after being rejected on the Lower High of the 1W Channel Down (RSI = 49.506, Highs/Lows = 0.0000). The Golden Cross (MA50 over MA200) on 1D was the signal both on the Lower High and the one on the late May 2018 All Time High. 1D is fully bearish (RSI = 33.998, MACD = -8.850, Highs/Lows = -159.7305) even oversold on the stochastic trade action, meaning that a relief rally should follow. With MA200 supporting we are targeting 7,400.
** If you like our free content follow our profile (www.tradingview.com) to get more daily ideas. **
Comments and likes are greatly appreciated.

FTSE - Downtrend Intact, Consider AddingMarkets remain in risk-off mode on the US/China trade debate. Also, BREXIT issues are surfacing again.
This is adding pressure to the FTSE. Momentum is negative as highlighted by the 55 SMA slope.
We favour adding on a continuation break today.

FTSE comparison with 2015The shape of the FTSE100 chart in 2018 bear similarities with that of 2015. The top is more rounded than SPX. The turmoil over the forthcoming Brexit execution on Mar 29, 2019 makes this a less attractive market than other non-US indices. Note that the fractal predicts a low of 3896, almost exactly 50% down from the top. This compares well with the 53% drop in 2001-03 and the 51% drop in 2007-09. This is all dependent on a bear market developing globally. FTSE is behind the curve on this, probably buoyed up by weak GBP. But GBP is also behind the curve on rate hikes.
If a bear market does develop, traders need to know the 'shape' of it, ie where the rallies will reach for short entry.

UK100 FTSE - SHORT - 7:1 Win vs Risk trade ideaHello all
Following last weeks short that played out well, now it has broken through the trend line, i expect it to follow the route i have mapped out for it on the chart.
To head lower to ultimately get to 6750 as it cycles lower.
If it breaches and closes below 6500, we have a bear market (however thats a long way off and we don't know until it prints beloiw and retests it)
I have taken this trade however do expect it to potentially pull back first thing tomorrow before heading south soon after.
I have set a sell limit slightly higher to get me in on a second entry. (around 7410)
Depending on the BOE tomorrow lunch, this could plummet.
Trade safe and thanks for reading
Duncan

Elliott Wave View: Further Strength in FTSEElliott Wave view on FTSE calls the rally from February 28, 2019 low (7041) as an impulse Elliott Wave structure. An impulse is a 5 waves structure with wave 1, 3, and 5 all subdivide in 5 waves of lesser degree. Up from 7041 low, wave 1 ended at 7370.6 and wave 2 ended at 7146.29 and Wave 3 ended at 7477 peak. Up from 7146.29, wave ((i)) ended at 7222.64, wave ((ii)) pullback ended at 7160.14. Index resumes rally in wave ((iii)) at 7461.39, and wave ((iv)) ended at 7420.41 and wave ((v)) of wave 3 ended at 7477.
Index should now pullback in wave 4 before the rally resumes in wave 5. Wave 4 should correct wave 3 rally from 7146.29 low. We don’t like selling the Index and expect buyers to appear to buy dips in 3, 7, or 11 swing as far as pivot at 7146.29 low stays intact.
