FTT.Usdt (Y21.P7.E1).Bullish structureHi All,
Bullish structure and I do anticipate that we will have a volatile ranging recovery and the point is, there is a perspective and this is bullish.
We can also have a bearish perspective but I'm bullish on BTC along with its onchain data not showing anything bearish.
All the best,
S.SAri
FTT

FTTUSDT : expect GREAT gains ahead! There is a great chance for gains trading FTT right now! I strongly belive that this coin is on a verge of doing great things!
I will explain my reasoning in detail:
FTT is testing a major support confluence:
- A strong horizontal support
- High time frame diagonal trendline support
- 200 daily EMA as a support
- Important Fib level s a support
- Daily OBV is showing a strong bullish divergence
- Weekly OBV is showing a strong bullish divergence
- Weekly stochastic RSI is in the making of a bullish cross
- Broke 4h EMA50, and turned it to support
- Bullish 13-21-50 EMA cross on 4h
What we can see is a consolidation on a strong support confluence, backed up by High time frame momentum indicator signals. At the same time, we have lower time frame confirmations.
This chart is a giver!
There are always multiple scenarios to play, but rarely this much.
- If you are a risk-taker, a buy rightnow with a Stop-Loss (SL) beneath the horizontal support at 43$ is a maximum profit strategy. The price needs to break trough 20 and 50 EMA on daily, and later diagonal trendline resistance, and horizontal resistance on its way to ATH. Do not expect such a movement to be momentarily, as there are a lot of resistance to be broken. But, considering the Weekly stochastic RSI, and daily and Weekly OBV, I think that a BIG move is coming! Congrats on your courage, if you took this path! You are a true man of action!
- For a medium risk-takers wait for the price to conquer daily EMA 21 and 50, and 4h EMA 200. They are in a similar zone, confluent with the upper edge of the green rectangle, around 53$. Turning this resistance zone to the support will be a strong bullish sign. Going this route is probably the smartest. Riding on the most of the upwards wawe, but also waiting for a stronger bullsih confirmation.
- For you guys who don't like to risk much, I understand you. Trading is not gambling. You like your trades clean and risk-free. And that is a great principle to follow. Wait for the price to conquer the diagonal trendline, and even the horizontal resistance represented by the blue rectangle. Turning this area to support during a retest will be the most risk-averse strategy.
BONUS:
Short time frame low-risk strategy.
For you guys who are more into the immediate results, going to the 4h chart is the right way . If the price stays above EMA50 on 4h, wait for the confirmation: bullish cross on a stochastic RSI + bullish engulfing candle, or bullish pinbar candle. SL is below the daily EMA 200. TP is the blue rectangle resistance zone. R:R is 2:1.
Dear TA entusiasts, which path did you choose? Is there any way you would improve the setup?
I would really like to hear your thoughts and see your results.
Do comment below, and share if you liked what you read.

sam ponzi to 126sam's original ponzi is going to benefit from solana's bonanza, as solana is just the unofficial ponzi of ftx and alameda research. buy this ponzi, it's well baked to make it yum yum

Is FTT going to $90 ?If BTC stays calm...
If the blue channel breaks out up ($50), its going to $60.
If it comes to $60, that is mean the orange triangle will break out up, the price would be $90 around.

BNB 10x CZ gang or SAM GANG 20xBNB 10x CZ gang or SAM GANG 20x
Sam gang whatup
So will FTT do what BNB did in 17? yeh prob.
Also this is one of those MUCH SAFER 10-20x than your favorite s&*^coin.
seems my last idea with this theory in mind was a bit early. i tend to do that.
LFG

💡FTTUSDT ANALYSIS💡HELLO FRIENDS
Technically, when we look at the chart in 4 hours, the butterfly bull formation ( Bullish Butterfly ) has been formed.
It is very risky to enter the trade before the voluminous momentum comes. Risk money management is very important in such transactions.
There are technical levels on the chart.
TP1: 60.78
TP2: 70.09
Trade entry level:51.20 (at the closing of the 4-hour candle)
Stop loss: 43.18 (based on my own money management)
IT IS NOT INVESTMENT ADVICE. IF YOU
BENEFIT FROM ANALYSIS, DON'T FORGET
TO LIKE AND FOLLOW 👍👍👍👍 IF THERE IS SOMETHING WRONG WITH THE FORMATION, YOU CAN ALSO BE AWARE.
📗📗EDUCATIONAL PURPOSES📗📗
Butterfly BOG Formation ( Bullish Butterfly )
D levels to the level of retraction, the leg should be 127,2's% of X or a rate of 161.8%.
• Point D must be below point X.
• Moving from point A to point D, a valid ABCD pattern should be observed.
• Triangles XAB and BCD must be proportional in time. Ideally, the time spent in the formation of these two triangles should be equal.
This is true if it is not BCD Renders the triangle in terms of time when xab UCG 61.8% with 161.8% can be between

FTTUSDT Technical Analysis💎 FTTUSDT after breaking out of the descending channel has been in a range between a major support and resistance. The After the breakout of the resistance I expect a bullish move
🌐 Tradingview
💵 Invest Only 5% of your Portfolio
🎳 Entry/Pullback now or from 51.61 - 50.07
☕️ TP1 54.95
🍺 TP2 58.61
🍻 TP3 62.75
🍾 TP4 67.03
🍷 TP5 71.03
🍸 TP6 75.00
🚫 SL 50.07 - 48.36
Good Luck 🎲
Check the Links in Description and if you LIKE this analysis, please support our page and Ideas by hitting the LIKE 👍 button. ❤️ Your Support is really appreciated! ❤️
Traders, if you have your own opinion about it, please write your own in the comment box. We will be glad for this.
Feel free to request any pair/instrument analysis or ask any questions in the comment section below.
We will have more FREE forecasts in TradingView soon
Have a profitable day 😊👍🏻


FTTUSDT-LONGThere is a long position in FTTUSDT
Futures-Spot FTTUSDT FTX Token
🔵Long Now or set on Key Level 50.60
🟢Target 1 52.90
🟢Target 2 55.25
❌Stop loss 49.20
#K_Level

FTT LONG 20211020Signal: Red -> Green
Confirmation: Break Through the Resistance Line
DISCLAIMER
This is only a personal opinion and does NOT serve as investing NOR trading advice.
Please make your own decisions and be responsible for your own investing and trading Activities.

My take on FTTBTCThis is how I would like to trade FTT/BTC. It's on a rising trend line after a huge correction. The trade is bit risky but it count yield huge gains. This are just my personal thoughts. No financial advice is intended.
DYOR.

FTT/USDT - AnalysisBelow HMA 209
All volume are low
Direction Bear !!
We still bear !!
Trade safe but never use a stop loss !!
Bots will catch you !!
Use Alert to stop your trades.

$FTT - Breakout TimeAfter a few weeks of consolidation FTT has traded relatively flat between 63.5-57 USD
Price action is tightening
EMA Ribbons are tightly correlated
Bullish pennant is forming quickly
Targeting 90 USD minimum on this move

🔥 FTT Huge Bearish 1-Year Wedge: Break OutOver the past year, FTT has formed a huge bearish wedge pattern. Classically, these are reversal patterns, so a strong bearish move would be expected.
However, I'm still fairly bullish on the crypto market as a whole. My expectation is that FTT will see some bearish moves in the near future. I'll be watching for the support area for a potential reversal.
A break below the support area might indicate a longer-term weakness.
Happy trading!

FTT/USDTDrop will turn bullish from 50-52K
*Please share your opinion on it, write in the comments. Dont forget some cheers bravo. "
Teşekkürler.

FTTUSDTFTTUSDT looks bullish after braking down trend and we are waithing for retest the trend and support .
GOOD LUCK!

FTT is Aiming For Parabolic Move Like BNB & SOL..Dont Miss this!We seen massive rise in BNB once it gave breakout frm 340$. Now its time for next exchange coin FTT. i m expecting FTT is going to achieve all our targets and may fly beyond everyone's expectation. every drop will be for BUY only.

FTT ( FTX token )FTT / USDT
bulls try to reclaim important level around 63$
As long as bulls holding this level + uptrend line priority is bullish
Best of wishes 🙏

FTT, ANOTHER GOOD ONE...This is a midterm position analysis from me and hope you enjoy >_-
Caution: This is not financial advice...
-Thanks-


Ftt will take off soon, and there are many reasons for this. 🚀Ftt is already close to opening new prices, its fair price at the moment is almost 3 times less than the traded one, so Ftt has huge potential in the near future.

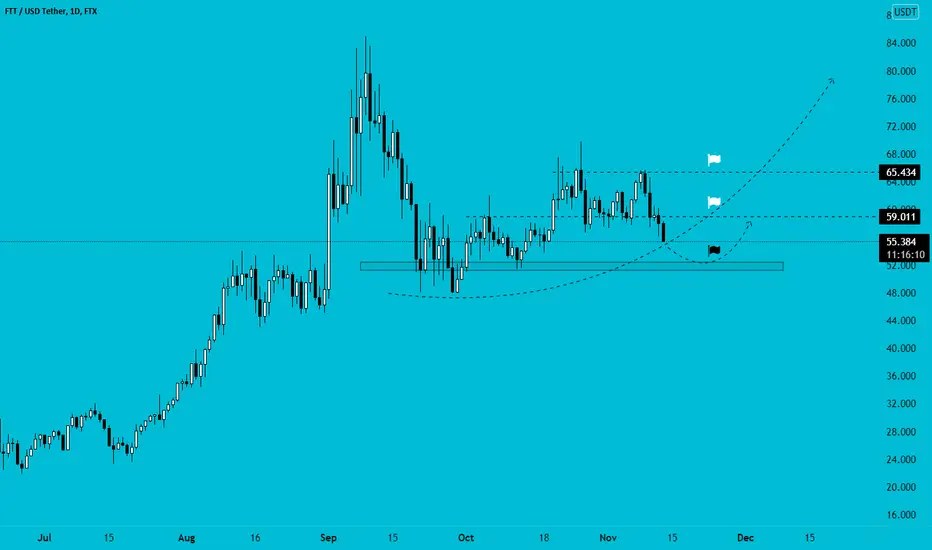
FTT 12H BUYFTT 12H support is at ~$58
Try to set some buy orders near the support zone
If FTT holds above the trendline,
the Take-Profit target would be $63, $68, and $72
