FTT - the token of the fast growing & most innovative exchangeSince my first recommendation on December 16th, when FTT was trading at 4.64 USDT, it gained about 420% and still has potential!
FTX ist the most innovative exchange out there and fast growing, eating market share from other exchanges.
The fibs should give you some idea where it is heading. 40 USDT is a realistic target imo, especially if you compare it to BNB the token of Binance.
I will always keep some FTT as it gives you fee rebates (always useful) and if you stake it increased airdrop rewards and more voting power.
FTT

FTT - FTX Exchange coin Feb/Mar 2021Entered a while ago and put it forward to you that FTT is one to hold (just as long as you have been holding Binance BNB).
With circulating supply of 94,346,958 FTT and a total supply of 345,219,294 FTT (5 million have been burnt to date).
"In addition, we will be repurchasing and burning tokens equal to:
a) 33% of all fees generated on FTX markets
b) 10% of net additions to the insurance fund ('Socialized Gains')
c) 5% of fees earned from other uses of the FTX platform
FTX will buy and burn every Monday starting on July 29th, 2019. The purchasing will happen on the FTX FTT/USD market at a pre-announced time of day; all tokens purchased will be burnt."
BNB went from $4 to $20 to $40 and then shot up to $100 and is resting at $140.
FTT can do it too.
Long HOLD
Leave a comment.

ACXT PlanTechnical:
Downward Trend Broken
Price Targets:
Entry: Below $0.4 - $0.5
Target 1: $ 0.94
Target 2: $ 2
Target 3: $ 4.64
Strong Hands: $ 10
Steel Hands: $ 20
Stop Loss: None
Timeframe: 1 Year Minimum
Potential Token Value:
$20
-At $1B MCAP and considering 50M total supply.
Fundamental
-Derivative Exchange
-World's First Derivative Exchange Providing Structured Products
-Founder is EX-COO of OKEX
-Potential Similar to $FTT
-Exchange expected to do $1B Volume within 2021 End
-ACXT is governance+Utility Token
-Supply is 50 Million

FTT falling wedge breakoutcan see the pattern quite clearly, looks to have broken to the upside, expect some gains from this is btc is good to us . always be cautious with any trade use stop losses in a sensible place but to where u wont get wicked out before the move to upside

💡 Don't miss the great buy opportunity in FTX Token/USDTTrading suggestion:
. There is a possibility of temporary retracement to suggested support line (10.5). if so, traders can set orders based on Price Action and expect to reach short-term targets.
Technical analysis:
. FTX Token/USDT FTTUSDT is in a range bound and the beginning of uptrend is expected.
.The price is above the 21-Day WEMA which acts as a dynamic support.
. The RSI is at 70.
Take Profits:
TP1= @ 12.95
TP2= @ 14.15
TP3= @ 15.75
TP4= @ 17.75
TP5= @ 20.00
SL= Break below S2
❤️ If you find this helpful and want more FREE forecasts in TradingView
. . . . . Please show your support back,
. . . . . . . . Hit the 👍 LIKE button,
. . . . . . . . . . . Drop some feedback below in the comment!
❤️ Your Support is very much 🙏 appreciated! ❤️
💎 Want us to help you become a better Forex trader ?
Now, It's your turn !
Be sure to leave a comment let us know how do you see this opportunity and forecast.
Trade well, ❤️
ForecastCity English Support Team ❤️


FTT bulls activizationVery good technical picture for FTTUSDT. Token perfectly holding all trendlines(blue dotted).
Expect bulls acton in recent days...📈

Accumulate HOLY under $2 for LONG-TERM holdingsRecommended HOLY for long-term holdings
Accumulate HOLY under $2
Our average entry is now $1.85
We will keep accumulating HOLY when it goes down futher


FTT - Parabolic ModeFtt becomes parabolic, volume is still growing steadily (about $400 million atm), and it shows no signs of weakening. I think this trend will continue for some time.
The trend is still clearly bullish, and we shouldn't forget Maps Me IEO is ahead.
12-15 dollars is quite a possible target for me.
Information is just for educational purposes, never financial advice. Always do your own research.
Hit the "LIKE" button and follow to support, thanks!

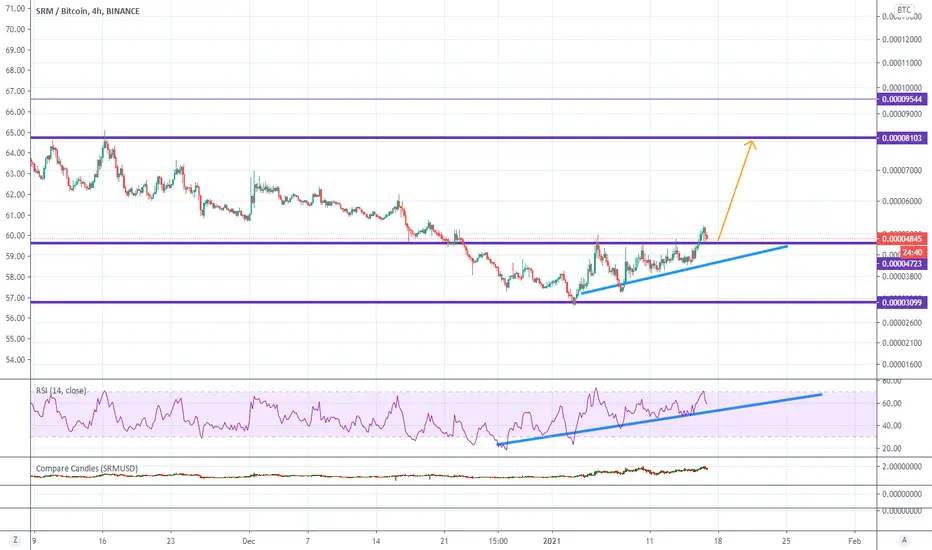
SRMBTC testing resistance turned supportIf it bounces, price will go to the top of the range. SRMBTC looks like it bottomed and will moon.
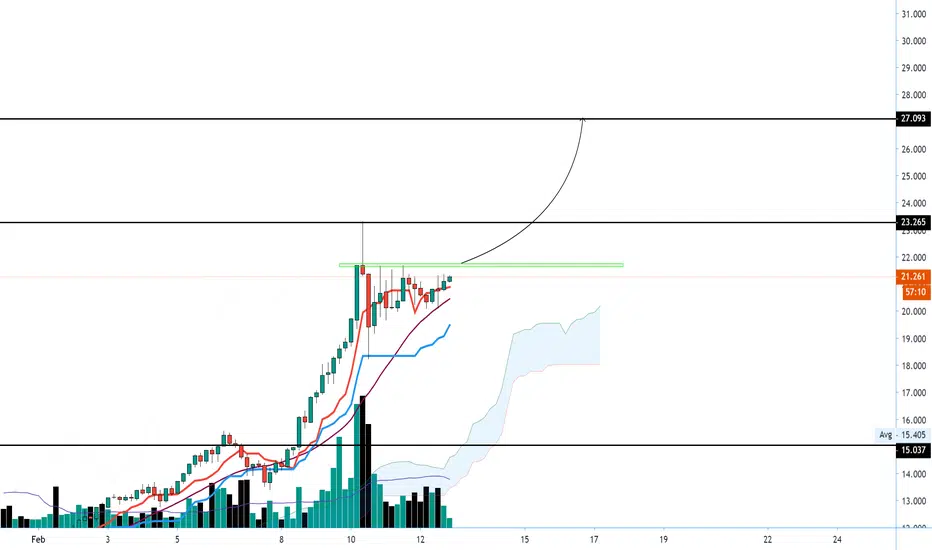
#FTT, Flipping - showing signs of accumulation over ~24k sats#FTT
Flipping - showing signs of accumulation over ~24k sats (now support)
Crossing over Ichi cloud for the 1st time since October as UCTS is signalling a Buy signal on the 1D chart
Looking for stronger volume come & support a movement toward ~27k sats (10%) as first move
#FTT

FTT - FTX Exchange coinWhat an incredible last 5 months!
FTT is the BNB for those that know.
$FTT was trading at $2 in March 2020. Sept 2020 it was $3.40. Jan 2021 it was $7.70.
Looking for a 117% uptrend by the beginning of May following the parallel channel.
LONG

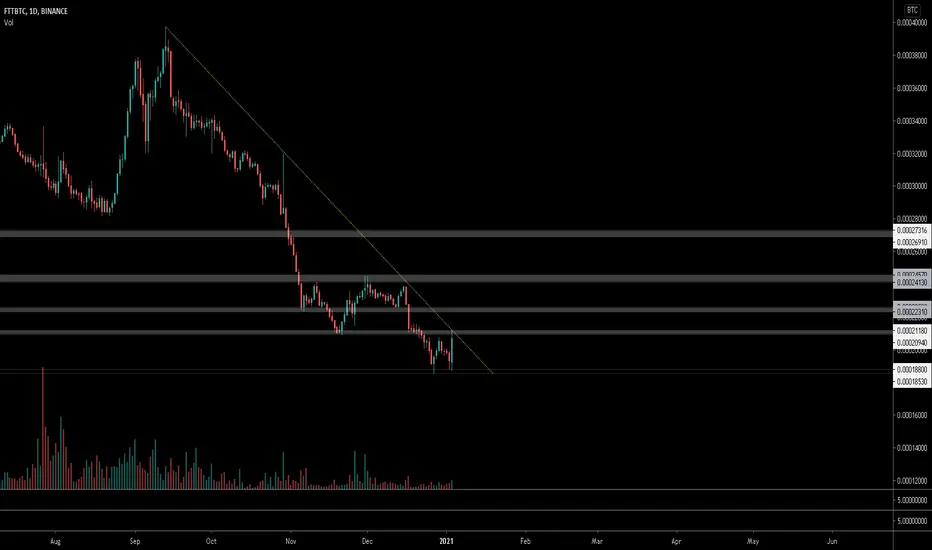
$FTT, Needs to catch up...$FTT
Needs to catch up...
Looking at the descending trendline built since September for a potential breakout/entry..
UCTS remaining bearish for now across all timeframes (1D signal could be a good trigger as well)
#FTT


FTT/USDTWeekly:
MACDH: not showing uptrend, but Stochatis RSI and Ehler Cycle show starting of uptrend. EMA12 still give higher value every week.
Daily:
MACD already cross up Signal line from below Zero. It is going to cross up Zero line.
MACDH is above Zero and flat, it shows the price is going sideway
Stochatis RSI is up
Ehler Cycle up
=> Good entry

FTTUSDT AnalysisAt this moment, there are 1 SELL signal present and the risk-reward ratio is lower than 2, so this is not a good time to buy.
If you want to buy again, we have 3 different options.
1- You can wait for EngineeringRobo's BUY signals to be present,
2- You can wait for candles to open-close above resistance level (4.49) for 1D to buy,
3- You can buy when candles touching the support line (2.94).
After you buy, please watch out for EngineeringRobo's sell signals and consider selling it.


Start Parabolic Phase FTT (FTX Exchange)Been holding FTT since 1.10 USD. Start parabolic phase in 1Y long slow upgrind to 10 USD, then back to mean.
Are we ready or what?

