FTT: If 61 breaks, it’s full send to 70.Sam coins are on the rise again. FTT is probably one of the safest altcoin you can buy for a long term hold regardless of the chart too.
With that being said, $61 is a key resistance level here. If this breaks, $70 should come shortly after.
Good luck!
FTTUSDT


FTTUSDT - Time to take entry?/Trading strategyBYBIT:FTTUSDT
4H trend chart
-
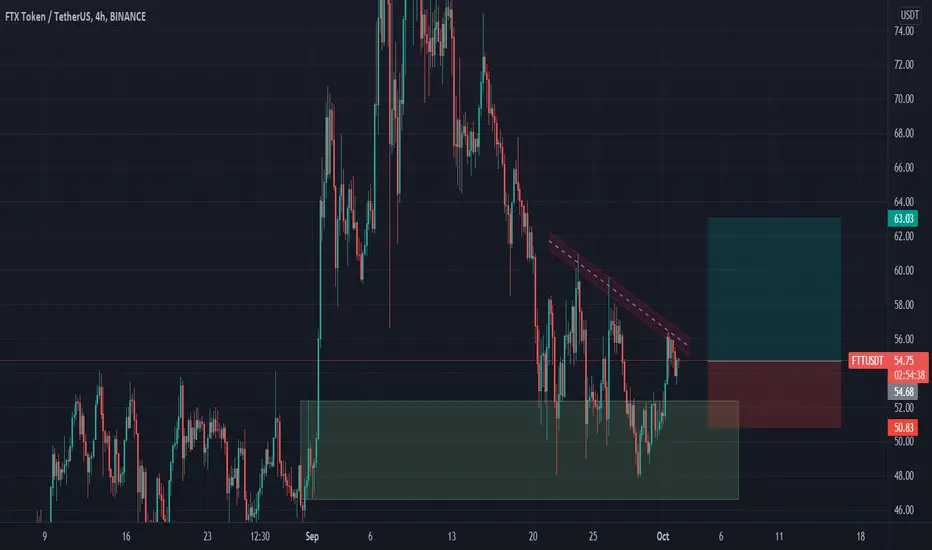
FTT is forming a triangle and approaching to the end of it.
If price can keep breaking out this downtrend line without long upper shadow line in 4H chart
It's a nice timing for entry, and trading strategy as below
-
Profit Targets:
a) 61.9----Fib(1)
b) 65.71~67.25----Fib(1.272~1.382)
c) 75.9----Fib(2)
Stop losses:
a) 53.71-----Red horizontal ray
-
If you like this analysis, smash the "like button" and leave a comment below to share your thoughts
or let me know what crypto you want to see!
Trading is a reflection of yourself. Learn more daily and be ready for every opportunity.
Have a nice trading!

FTT the SOL adopted son.Looking to collect a decent amount of FTT on the box for a long term, also Im looking to speculate every white line, also every intersection of white lines and trend lines (black lines) will really indicate where the market is gonna move.
a great chance to be hopefully?
also when it drops, forget the bears talking about bear market, there is always a bounce and there is always profit taking, meanwhile if the bleeding was slow below the rectangle i would decrease my position and layer some bids from lower white lines
salute mon amies.
BTCUSD SOLUSD SOLANA FTT

FTT to 100 USD [Target 161.8% Elliott Wave ] 100 USDT is too easy for FTT
headed to wave 3 ( atleast 161.8% )

FTT is going to break!Hi everyone,
If ftt break the line you can buy with the target and stoploss which is shown.
Ftt is growing up, don't miss this.
FTT bullish scenariobuying the smol trendline + Support retest.
Bullish sign. DCAing all the way to the stop loss.
Taking profits on the way up

BINANCE COIN - TARGET HIT. Whats Next?In our last analysis, we were short from the 417 level with targets of 328. We bounce off perfectly off the channel and now making our way up.
We are now looking for buying opportunities to take BNB higher. Waiting for a deeper pullback, ideally a retest of the channel support before moving higher.
Watch for lower timeframe reversal patterns once we approach the channel support in the next week or so.

FTX TOKEN - Will Sam get Fried?FTX Token is at a pivotal point where a small move either way could determine the next moves.
Bullish - As Binance is blocking more and more regions every week, customers affected must find another exchange which is where the FTX exchange comes in. If enough customers come on to FTX exchange, it could surge the price for the FTX Token.
A break above the 61 level would confirm that the bullish outlook.
Bearish - From a technical standpoint, we can see that there's a head and shoulders formation at play. For it to be a confirmed head and shoulders pattern, price needs to break the neckline.
Will be watching this one closely!

Time to go, TP 70.6Following 4h graph.
Broke and got confirmation for the descending line, now it's time to go.
We also got an RSI confirmation.
TP1 59.5
TP2 64
TP3 70.5
SL 48.7


FTTUSDT Next target $100?FTTUSDT (Day Chart) Technical analysis
FTT/USDT Currently trading at $60.00
Long Entry: above $50.00 -$60.00
Target 1 : $70.00
Target 2 : $85.00
Target 3 : $100.00
Taeget 4: $125.00
Max leverage: 2x or buy it on the spot market
Always keep stop loss

FTT/USD - Long opportunity for 10%, resistance broken! 🚀FTT has broken the resistance that has acted in this role since early September. After several re-tests we finally broke it once we bounced on a good support level
Now we're making this resistance level support, should that succeed, I see up quickly moving up with a nice target at $67. Once there best to secure profits and re-assess.
We also have a resistance at $62, however that will likely not hold us much.
The indicators like MACD and RSI are also curving up nicely, hence we're building a nice rally here. Risk reward favors a long.
Good luck!
Like and follow if you liked this idea!

#FTT overview 1DAfter hitting exactly 1.272 extension on the first bullish move, currently bouncing from the 0.382 fib retracement level and heading towards the critical level of 62$.
In the worst scenario we an continue correcting towards 0.5 or 0.618 fib levels ,respectively 43-36$ levels, which would give chances to load our bags for the next big swing long waiting us. I believe 1.618 levels or 120$ will be reached soon.


FTTUSDTHello Crypto Lovers,
Mars Signals team wishes you high profits.
We are in a daily time frame.
As you see, the price is moving upwards, after the fall, by hitting the support line, and if it breaks the resistance line and stabilizes above that, it can reach our target.
But in case of dropping below the support line, we consider a fall.
Warning: This is just a suggestion and we do not guarantee profits. We advise you analyze the chart before opening any position.
Wish you luck

FTTUSD going down to next supportFTT token is my fav of the utility tokens. Over the past few days, it held support levels around $60.
With that broken, I see the next support level to $52 almost matches the fib level here.
The market is very choppy and indecisive for me, so I am just placing my limit orders at $52 and patiently waiting.
(Disclaimer - not financial advice)

$FTT - 4hWe are in a crucial moment, Everyone is eying the Fed, waiting for a tapering signal...this caused raising USDT.D and falling the crpto market king "Bitcoin"
Some push up to downtrend dynamic resistance and fibo 0.618 of impulsive wave expected,but we must see what market decides for ongoing way and patience was always the key of succes !


FTT potential bull flagJust classic TA. Bull flag is a falling wedge which should breakout with a minimum of $72 then $84 . I am expecting one more dip to for a bullish divergence.

FTT LONG BREAKOUT COMING SOONREASONS TO ENTER :-
1. Support Zone
2. 0.6 Fib Level
3. Double Bottom Pattern
Wait for Break Out of trendline before entering long
Target are previous resistance levels
Note:- Bitcoin should remain stable for the setup to playout successfully
PRICE ACTION TRADING
