FTT at a critical level! Watch for a breakout!Here's a quick look at FTT 2 hr chart. As we can see, the price has been going sideways and has printed a symmetrical triangle. There's also a possible head & shoulder pattern which is bearish. Definitely one to keep an eye on.
The best entry would be, when the price breaks above the symmetrical triangle with good amount of volume.
If we break below the symmetrical triangle, then im looking for 60$ FTT.
-------------------------------------------
The idea is: Buy the breakout from the symmetrical triangle and take profits at the levels shown in the chart.
Targets:
- Profits can be taken in the resistance zone .
1. 74$
2. 84$
3. 99$
-------------------------------------------
If you like the content, then make sure to comment and like the post :D
Follow me for daily profitable trading setups
BTC dictates the market. If BTC falls, then Alts will fall as well. Trade safe!
FTTUSDT

FTT, NICE FOR HOLDERS...!FTT is a good project and has exclusive growth potential. The best entry point is in the chart below:
Thank you so much for supporting me and your kindness >_-

$FTT Local Bottom?I am quiet confident that $FTT is had a local bottom here. $ftt still the most bullish alt for the time being since it made new HH on daily, weekly and monthly. next stop could be 0.002 SAT.

$FTT to $50 to grab liquidity$FTT may need to come down to $50 to grab some liquidity since 3 drive wedge is completed. Once we clear small range just above midrange we may test prior ATH and then very fast to OB. Those trending gap candles in context must be filled before continuation.
Invalidation: ATH

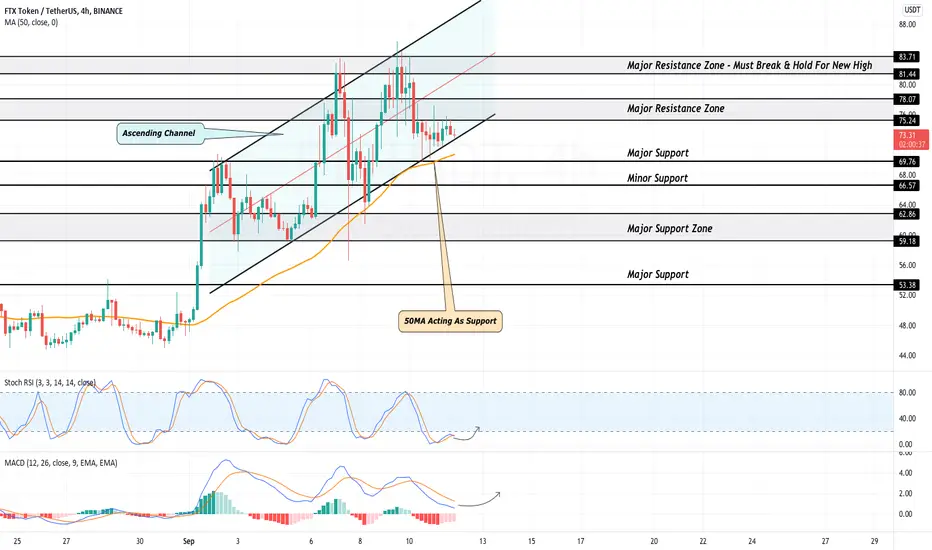
FTX Token Struggles Near ATH As Bears Attempt To Pull It Down-FTT has risen over 20% the last week
-Price has formed an ascending channel over the last week
-FTT is being held up by the 50MA
FTX Token (FTT) is the backbone of the FTX ecosystem. FTX exchange has been rapidly growing over the last year along with its native token, FTT. FTT has experienced an immense amount of gains throughout the year as prices continue to rise along with the usage of the FTX platform. FTT gives fee rebates to holders of the token along with the opportunity to stake FTT which comes along with many benefits. FTX token can be compared to BNB in the sense that it is woven within each exchange platform which both offer incentives for the users.
Ever since the start of September, FTT has had an explosive run up to ATH. Since the 1st of the month FTT is currently up over 55% while it reached a peak gain of 80% just over 2 days ago. At the time of writing, price is attempting to regain its major resistance zone of $75-$78. If this is deemed successful, FTX token will likely spike back above the $80 value. Over the last 10 days price has began to form an ascending channel (light blue). Until a breakout of either trend occurs, FTT will stay put within the channel.
Since the beginning of the month, price has been holding above the 50MA very well. This MA can be used as a good gauge as to whether or not FTT is in an uptrend or not. At the time of writing, FTT is tangling on to the bottom trend of its channel formation. Right below this trend lies the 50MA. If bears pull price below its channel trend, the last chance for FTT to keep its uptrend in tact is this MA. In the case price breaks below this MA, FTT will likely be in a short term downtrend which will land prices back in the low $60s.
While looking at the Stochastic RSI, we can see strength has been stuck within the oversold region for nearly 2 days. Strength must bounce out of this zone quickly & break the 20 value to save itself from further downside. The MAs of the MACD have been floating above the 0 value ever since the start of the month. This is not the most bullish sign as these MAs always find their way back to the 0 value at minimum. A bounce off the 0 value will likely setup FTT for a push back into its major resistance zone.
FTT Intraday Analysis
Spot rate: $73.37
Trend: Bullish
Volatility: Medium
Support: $69.76
Resistance: $75.24
FTTUSDT 1H is a potential cup and handle pattern !!In FTTUSDT 1h
There is a potential cup and handle pattern .
The downtrend be broken out and close with short upper shadow .
Let's setup the plan
TP1: Fib 1 (83.86)
If it break out Fib 1 (83.86) and the close with short shadow too.
TP2: Fib 1.272 (94..40)
TP3: Fib 1.382 (98.66)
TP4: Fib 2 (122.611)
SL : 69.82

$FTT - should go searching for ATH end of this weekYesterdays dump took us into a D OB
Today we came and sweeped the wick low yesterday
Now we have got above the H1 up candle - the BKR - the breaker - that caused the sweep, and retesting it as support!
Missed limit entry at top of breaker - wasn't at PC
Market longed - aiming for -0.236 fib of H12 range confluent with around $90 - psychological level
Don't let me down SAM

Do not buy FTT token now!We know FTT is a wonderful token, many proofs and a lot of funds are behind it, BUT;
.
It is in overextended area and Due to FTT historical movements(as you see in the previous one) we had an extreme 60%ish correction from May 12th till June 26th!
.
So, I do not expect such an aggressive correction, however, my best entry point is around 50 and 60% of fib retracement!
.
Let's see


fttusd daily scaleAt present, according to the areas of support and resistance, as well as previous behavioral patterns, there is a possibility of moving up and reaching the next resistance range.
Future movements of this currency are predicted only as a moving probability.
However, in the event of a return and a drop in the price of the support areas, it is also clear that the numbers are very accurate.

FTX token will go up if it has breakoutthere is a bullish symmetrical triangle on chart if you like it ,you like it thanks:)

FTT USD lowtimeframe pennantmight bounce strongly here
macd and rsi breaking out
price still in pennant structure and was above 70 a few days ago

Crypto market 05 09 FTT FTT completes target 1 :62 will hit 82Someone asked me about the chart and I thought it was time to buy it. I expect to continue the price zone of 82 for this floor coin; FTX exchange is growing very fast to compete with Binance

FTT forming a triangleFTT is forming a triangle pattern in 1h time frame. The more likely bullish target is about 76$ and the bearish price target would be about 72$.
Trade at your own risk.
Not Financial Advice

FTTPERP Outlook !!!FTT is breaking up from the Bullish Pennant Pattern. Potential to hit the 161.80% Fibonacci External Retracement.
Disclaimer on !!!

FTT USDTIf the candlesticks move upwards and break the diagonal resistance as well as the horizontal resistance in the range of $ 70
We can hope to achieve the goals set out in the chart

$ftt Reversal?As shared yesterday, $ftt came back to my buy zone and obviously everyone buy zone. Breakout ATH in monthly and daily and retest last ATH daily close. Now Go to 0.0015 please

FTT Bullish cup & head in Play !FTT is very bullish not only technically but fundamentally too !
FTX is growing too fast too quick !
FTT worth upto $100+

Sam Bankman : Hold my FTT !Salve , long time no see
today I'm gonna talk about FTT token. FTT is FTX's exchange token
Holders get a fraction of exchange fees, a fraction of the liquidation insurance fund, and can use the token as collateral and to get tighter OTC spreads on FTX.
If you missed BNB at 60 you better don't miss FTT and you better HODL it too.
Targets 65 - 70 - 75 - 80 - 90 - 99
Stop-loss 55 - 50
what do you think about the future of FTX exchange?
what chart you like to see for our next idea?

FTTUSDTsee and watch :)
The resistance is broken and it seems that it can move to the specified goal ...

$FTT Local Top?Here I took profits in $FTT could be topped here, bids at previous daily ATH if closed above today,
If not I will bidding lower.
Could be wrong but honestly I don't see R:R here specially as BTC rips here , claiming fib 1.1618 will change my plan obviously.

#ftt FTX token, new leg up!It's a gem for next bull ran. We have Massive ressistance at 54$, after breaking ftt will have moon bang.
Also bullish triangle.
Globally waiting for 200$ and 600$ per #FTT. SL only after closing 4h candle under 44$.
Risk under your control.
Sorry my old idea was inactivated, because i published for russian language(((((

