FTT ShortFTT printing multiple bearish divs on small timeframe after breakout. natural on these 'momentum' pushes to reach natural levels.
still bullish overall, just looking for scalps / re entry
FTTUSDT


FTT 1H BUYAlso set some Buy orders near the Trendline
Remember no more than 5% of the deposit in one trade
SL: next sell signal


🆓FTX Token/USDT Analysis (23/2) #FTT $FTTThe strong buying force continues to pour into FTT in this February, showing the possibility of FTT's price increase, but because the market health is quite weak, FTT is currently still dominated by selling, but not because of the strong selling force, but because the buying force is temporarily paused.
As long as FTT surpasses $32 zone, strong buying force will push in to help FTT rise to $46 and even $64 zones.
📅NEWS
No News
📈BUY
-Buy: 26.5-28.5$. SL if B
-Buy: 31.5-33.5$ if A. SL if B
📉SELL
-Sell: 45-47$. SL if A
-Sell: 64-66$. SL if A
♻️BACK-UP
-Sell: 26.5-28.5$ if B. SL if A
-Buy: 20-22$.SL if B
❓Details
Condition A : "If 8H candle closes ABOVE this zone"
Condition B : "If 8H candle closes BELOW this zone"

FTT - Growth opportunities as good as BNB Quick FTT analysis. I will try to play a little in this tight range. We still on the bull market, i.e I assume ranging and expansion after that.
Moreover, FTT has some really good fundamentally growth opportunities. FTX supported projects (SOL, SRM, REY) continue to grow rapidly and attract more user funds.
Information is just for educational purposes, never financial advice. Always do your own research.
Hit the "LIKE" button and follow to support, thanks!

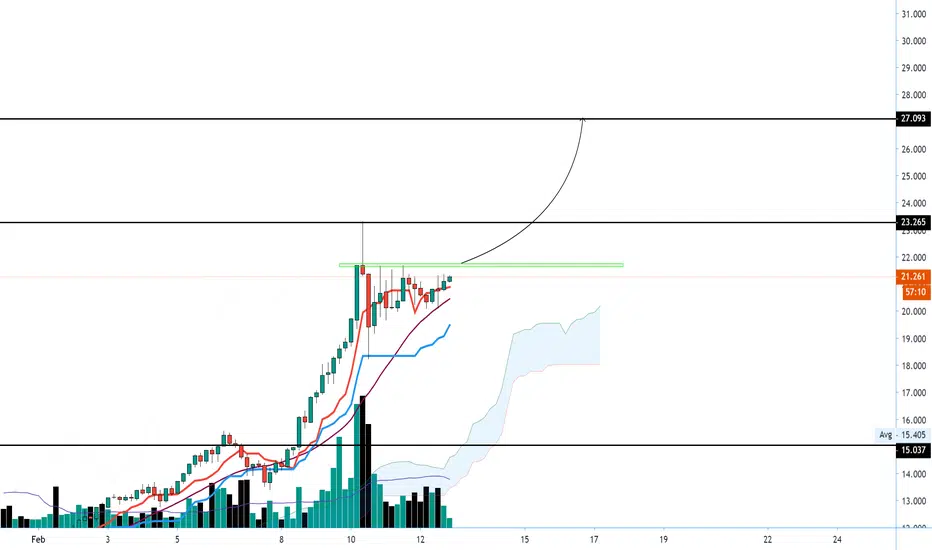
FTTUSDT Continuation? A breakout has formed from a bullish continuation pattern. If support holds I will, I'll consider a trade. Good luck!

💡 Don't miss the great buy opportunity in FTX Token/USDTTrading suggestion:
. There is a possibility of temporary retracement to suggested support line (10.5). if so, traders can set orders based on Price Action and expect to reach short-term targets.
Technical analysis:
. FTX Token/USDT FTTUSDT is in a range bound and the beginning of uptrend is expected.
.The price is above the 21-Day WEMA which acts as a dynamic support.
. The RSI is at 70.
Take Profits:
TP1= @ 12.95
TP2= @ 14.15
TP3= @ 15.75
TP4= @ 17.75
TP5= @ 20.00
SL= Break below S2
❤️ If you find this helpful and want more FREE forecasts in TradingView
. . . . . Please show your support back,
. . . . . . . . Hit the 👍 LIKE button,
. . . . . . . . . . . Drop some feedback below in the comment!
❤️ Your Support is very much 🙏 appreciated! ❤️
💎 Want us to help you become a better Forex trader ?
Now, It's your turn !
Be sure to leave a comment let us know how do you see this opportunity and forecast.
Trade well, ❤️
ForecastCity English Support Team ❤️


FTT bulls activizationVery good technical picture for FTTUSDT. Token perfectly holding all trendlines(blue dotted).
Expect bulls acton in recent days...📈


FTT - Parabolic ModeFtt becomes parabolic, volume is still growing steadily (about $400 million atm), and it shows no signs of weakening. I think this trend will continue for some time.
The trend is still clearly bullish, and we shouldn't forget Maps Me IEO is ahead.
12-15 dollars is quite a possible target for me.
Information is just for educational purposes, never financial advice. Always do your own research.
Hit the "LIKE" button and follow to support, thanks!


FTT/USDTWeekly:
MACDH: not showing uptrend, but Stochatis RSI and Ehler Cycle show starting of uptrend. EMA12 still give higher value every week.
Daily:
MACD already cross up Signal line from below Zero. It is going to cross up Zero line.
MACDH is above Zero and flat, it shows the price is going sideway
Stochatis RSI is up
Ehler Cycle up
=> Good entry

FTTUSDT AnalysisAt this moment, there are 1 SELL signal present and the risk-reward ratio is lower than 2, so this is not a good time to buy.
If you want to buy again, we have 3 different options.
1- You can wait for EngineeringRobo's BUY signals to be present,
2- You can wait for candles to open-close above resistance level (4.49) for 1D to buy,
3- You can buy when candles touching the support line (2.94).
After you buy, please watch out for EngineeringRobo's sell signals and consider selling it.


FTT/USDTFollowing the acquisition of Blockfolio by FTX exchange and the announcement by both companies on the roll-out of trading capabilities on Blockfolio, the number of active users on FTX exchange is expected to increase from 200K-2M active users potential.
Blockfolio has +1M downloads on Android, assuming there are other 1M users with iPhones.
Conversion rate of 10% would put us on 200K users being added to FTX exchange, I expect a much higher conversion rate since Blockfolio users really love the app and are willing to try new things that blockfolio offers, I'm saying this as a marketing expert that has the ability to identify such user behaviors towards such applications, I've been Blockfolio users since early 2017 on daily basis.
The average buyback and burn rate on FTT in the last 10 buy backs has been doubled, from an average of 45K FTT to an average of 110K FTT - this is very logical since the industry has been growing fast with new users joining the crypto space.
Keeping in mind that the FTT price from 23.06-22.07 was in the range of: $3-$3.16 (looking at highs ONLY)
And since 22.07-25.08 the FTT price was in the range of: $3.16-$3.6
Conclusion: the number of active traders on FTX grew. (Without the upcoming push and release of the trading capabilities on BlockFolio).
To back up the above - looking at similarweb, FTX exchange has monthly visitors grew from 810K in February to 1.35M monthly visits in July (1.66X).
While 72% of the traffic is direct to FTX exchange - Strong brand and high daily active users.
I believe the trading volume as well doubled, but I'm having a hard time to pull the historical trading volume on CMC.
The above analysis leads me to the decision that FTT token could possibly push the price up further by the end of the year.
Currently the support lines are on 3.6USDT and 3.2USDT (going below 3.2USDT, means we might turn bearish)


FTTUSDT ANALYSISI have 4 positive signals It is above the horizontal line
You can still buy this coin but watch carefully EngineeringRobo' s sell signal
If you hold this coin sell with EngineerinRobo' s sell signal
Have a good trade If you want to use EngineeringRobo please dm me.
