Go Woke Stay Brokeabsolute classic, weve seen this play out 1000x at this point. allof these companies pushing socialism are going broke... shocker to nobody lol. biggest donors of bidens campaign contributing to ruining the american economy. hope sbf kep a few of his btc off ftx so he can run away and hangout w his fraud buddy
FTX

SBF vs CZGuy has no clue what hes doing, i wonder what hell say when FTT drops sub $5 maybe insolvent? Guess well see, shoutout to CZ for being a don. hope he sells for him at $22 and takes him for what hes worth. Long way down for one of the richest socialists in the world! ggs sam, catch ya at mcdonalds

Is FTT going to crash like LUNA? NEWS&Trading Volatility = $$ ?!FTX:FTTUSD FTX:FTTPERP
FTX:FTTUSDT
Short Technical analysis of where the current price of FTT is hovering around. Levels that need to hold
Is FTT Token going to crash like Luna did?
Is it safe to keep your funds on FTX
What does CZ from Binance say?
What is Sam Bankman-Fried from FTX saying about it?
What are other market players saying about it?
Not Financial Advice. DYOR. Papertrade before trading with real money.
Hope you have a profitable trading day!
Shawn

FTT/USDT 1DFTX token is on the 1D time frame on the critical support. If the price breaks below this support level and retests as new resistance, we can have a good entry for a short position.

FTX Token (FTT) formed bullish BAT for upto 16.50% pumpHi dear friends, hope you are well and welcome to the new trade setup of FTX Token ( FTT )
Previously we had a nice trade of FTT:
Now on a 4-hr time frame, FTT has formed a bullish BAT pattern.
Note: Above idea is for educational purpose only. It is advised to diversify and strictly follow the stop loss, and don't get stuck with trade

FTTUSDT just long itHi,
FTT / FTX token is following my model.
looks good.
I'm taking long here
targeting weekly highs.
iNSHALLAH
all the best!

breakout on BCHLooks like a breakout from falling wedge on BCH chart. November will most likely be a bullish month. can't say the same about christmas time. but we'll see.

BTCUSDT - There is room to growDespite high level of liquidations (around $1.28 billion in the last 24h) I think there's room to grow still for btc & eth. Don't have high targets, but this small pump looks unfinished yet.
Information is just for educational purposes, never financial advice. Always do your own research.
Hit the "LIKE" button and follow to support, thanks!

FTX Token Analyze (Road Map)!!!🗺️FTX Token runs in the last wave of a Double Zigzag Correction (Wave Y). I expect it to complete microwave B of main wave Y near the Resistance Zone.
FTX Token Analyze ( FTTUSDT ) Timeframe Daily⏰ (Log Scale)
Where can the end of a Double Zigzag Correction ❗️❓
🎯Target🎯: 23.3$ until 18.2$
Do not forget to put Stop loss for your positions (For every position you want to open).
Please follow your strategy, this is just my idea, and I will be glad to see your ideas in this post.
Please do not forget the ✅' like '✅ button 🙏😊 & Share it with your friends; thanks, and Trade safe.

SOLUSDT - 'SMS' Stragegy opened longChecked my trend-catching strategy and it's surprisingly doing really well. Good profit factor, EV+ and number of trades (for a trend strategy). Ofc it can be improved, drawdown doesn't look exciting and some trades can be closed better it seems (on the other hand it can broke the algo). BUT if to check trades, there're enough decent catches (for example, highlighted short on the chart). And for a long period of time (2020 - 2022, for example, it's still good)
Will see if it be able to catch the next big move. In the long position atm.
Information is just for educational purposes, never financial advice. Always do your own research.
Hit the "LIKE" button and follow to support, thanks!

Solana: Great Time to Start a Long Term PositionA quick look on $SOL because I've seen a few people saying it "completed the bubble chart pattern and now it's safe to expect another bullrun!".
It DOES look like a nice bubble and crash but in my opinion it's gonna take a while before we will see a proper bullish move. Solana is in a great position to start building a long term 💰 but don't have unrealistic expectations. White area is the range now, grey area is great for buying but breaking out of the purple zone is gonna be hard work💪🚀

Bitcoin NOW and in a WEEK!This situation on Bitcoin is not surprising at all. The market is still inactive, although volumes are growing - that's good to know.
We are expecting another decline with more probability than growth from this point.
Local growth up to $21000+ is possible and logical. Mid-term I don't see any signs of high prices recovery.
I'm developer, so I trade only with modern software. And I can tell you a lot about this.

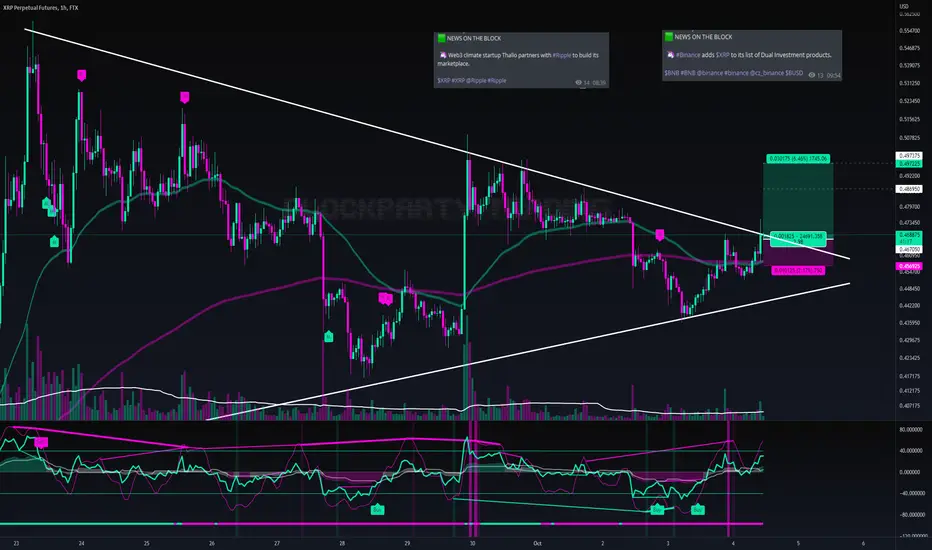
🎲 #XRPPERP #LONG #SCALP 🎲🎲 #XRPPERP #LONG #SCALP 🎲
"Roll The Dice"
Risk
- Med-High
Entry Conditions:
🦄 Web3 climate startup Thallo partners with #Ripple to build its marketplace.
🦄 #Binance adds $XRP to its list of Dual Investment products.
ENTRY: 0.467050
TP1: 4.26%
0.486925
TP2: 6.46%
0.497225
SL: 2.17%
0.456925
FTT Must Hold Above $22; or Be DestroyedFTT has traded within this Giant Falling Wedge Pattern and is at a Weekly Support Level like the SPX and Nasdaq as well as the Pattern Completion Zone of a Bullish Gartley so Long as it holds above support we should see a Decent Breakout Very soon from here Potentially to $60-$71.

FTX token FTT is an FTX exchange token and has many usecases on the exchange, just like any other such token: burning tokens for a 1/3 of exchange revenue, discounts on fees for holders, use in various exchange activities, also institutions and investors pay expenses in FTT tokens by purchasing a "white" version of the FTX OTC portal and futures market. In a sense, betting on FTT on par with Solana is betting on Sam's success in the crypto industry. And so far SBF is succeeding in it - FTX is now one of the top 3 exchanges in terms of volume. In terms of tech - there is a lot of liquidity support behind the token, and I don't think it will be allowed to drop much, it is holding up well on this fire, just like all crypto exchanges tokens. As previously reported, Sam Bankman-Fried is willing to give $1 billion to support crypto projects = buy them at low prices = possible further development of the exchange and with it FTT price growth. We are now approaching $21-24 support, it would make sense to break that support and gather liquidity, so it would be prudent to wait for a drop to $16-18 for long-term buying, but to reassure, I would wait for a breakdown of the downtrend line and return above $22, because there is a possibility that after support we may see a sharp squeeze down, as we have seen before (-50% for 1 week as in May 2021).

Potential possible targets of SOLWe have seen that in its history it has gained from its ATL (all time low) to its ATH (all time high)
a + 20,000%, exactly twenty thousand percent in a year.
As you know, we live in a bear market moment that could have come to an end, so we asked ourselves how much could be earned by investing in SOL?
What technique did we use?
In a monthly chart with minimum and maximum points, we used the `` Fibonacci Extension '' a solid indicator that allows us to see the strength of the trend in this case of the macro trend.
The Fibonacci extension is set from the minimum point to the maximum point, retracing up to the trend change point or (if the bear market is finished) the local minimum of $ 25.
We can then automatically see the strength of the trend with the price and in green the percentage gain from the current price of $ 37.
What do you think?
If you liked the chart, please like and comment.
Thanks for reading.
LPI

STG ideaLarge volumes entered the asset, listing on finance, the asset found the bottom of the listing field. I expect a return to the minimum cost of 2.4-5. This is my main zone for fixing purchases at 0.6.
You can throw stones, of course, but not effectively, so I'm waiting for comments.

Icarus gearing up its wings! Opinion:
Short term trade. TP at 39.72! :)
Each level L1-L3 (S1-S3) and TP1-TP3 has a deployment percentage. The idea is to flag these levels so I can buy 11% at L1 , 28% at L2 and if L3 deploy 61% of assigned dry powder. The same in reverse goes for TP. TP1: 61%, TP2:28% and TP3:11%. If chart pivots between TP's and L's these percentages are still respected. I like to use the trading range to accumulate by using this tactic.
Just my personal way of using this. This is not intended or made to constitute any financial advice.
This is not intended or made to constitute any financial advice.
FED Macro Situation Consideration:
All TP's are drawn within the context of a return to FED neutral policy. I do not expect these levels to be reached before tightening is over.
NOT INVESTMENT ADVICE
I am not a financial advisor.
The Content in this TradingView Idea is for informational purposes only, you should not construe any such information or other material as legal, tax, investment, financial, or other advice. Nothing contained within this idea constitutes a solicitation, recommendation, endorsement, or offer to buy or sell any securities or other financial instruments in this or in in any other jurisdiction in which such solicitation or offer would be unlawful under the securities laws of such jurisdiction.
All Content on this idea post is information of a general nature and does not address the circumstances of any particular individual or entity. Nothing in the idea/post constitutes professional and/or financial advice, nor does any information on the idea/post constitute a comprehensive or complete statement of the matters discussed or the law relating thereto. You alone assume the sole responsibility of evaluating the merits and risks associated with the use of any information or other Content on the idea/post before making any decisions based on such information.

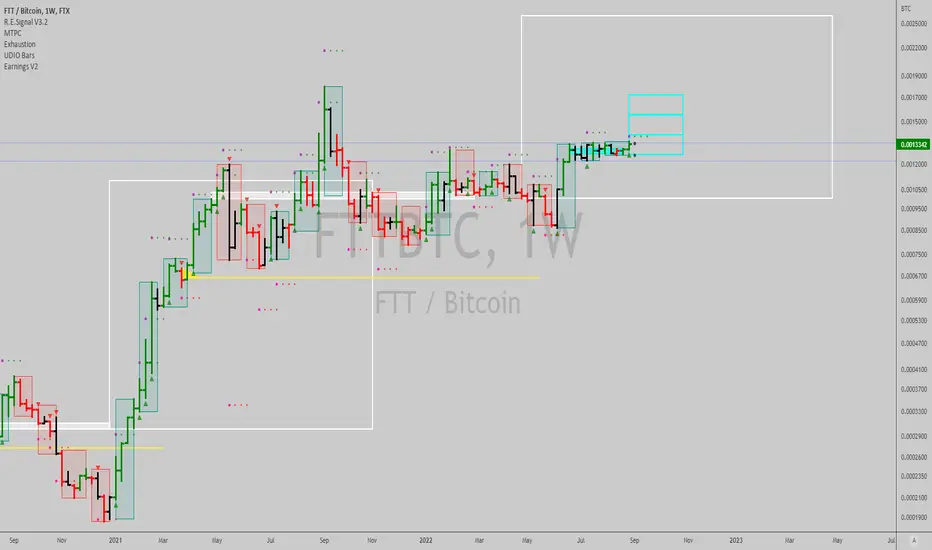
$FTTBTC: Pair trade setup...I think we can go long $FTTUSD against a same size short in $BTCUSD, the ratio chart shows there's 95% upside with 5% risk give or take, historically, in bear markets, exchange tokens have done well vs Bitcoin (like $BNBBTC did in the prior bear market back in 2018-2020). It might be worth a punt here...Betting on Sam might be a decent gamble, relatively vs Bitcoin at least. You can stake your $FTT as well, while you hold the $BTCUSD short, but need enough collateral to not be at risk. The bearish case in $BTCUSD might still be valid, judging by the action today, which erased yesterday's up bar. It's worth a shot.
Best of luck,
Ivan Labrie.
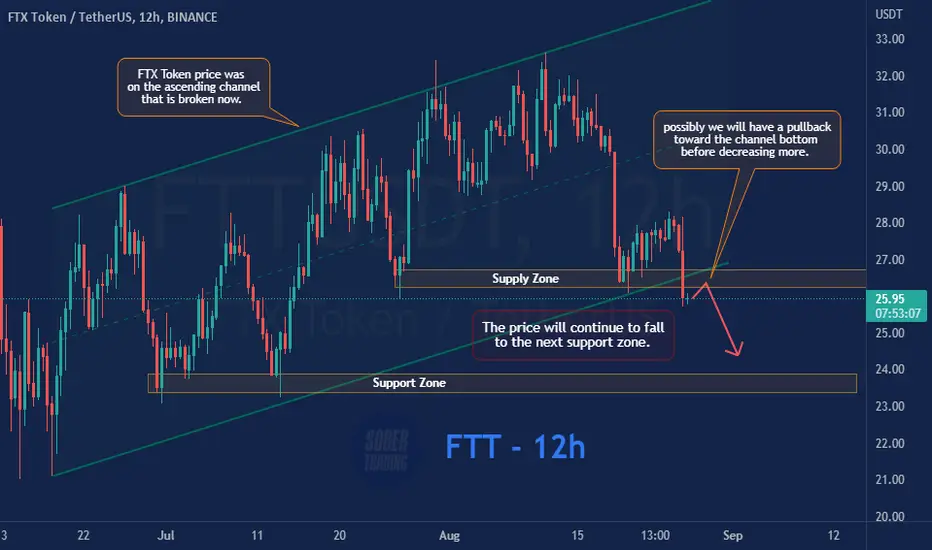
FTT - FTX Token 12h bearishFTX Token price was on the ascending channel that is broken now. So the price will continue to fall to the next support zone, and possibly we will have a pullback toward the channel bottom before decreasing more.
FTX Mid-term technical analysisA lot of good R:R short setups across the crypto market.
For the FTX, there is a clear invalidation level (tight SL), and the risk to reward of at least 4 for this short setup.
Let's see how it will play.
Cheers!
Mr. Cfyptotracker

What a base on FTX! 2 targets inside🚀Hi friends! Another crypto giant creates a huge base (or accumulation range) to skyrocket soon!
More about the base were in this idea! Check it to get more experience in trading.
Now FTX inside in the triangle and queeze to the top boundary. It`s a bullish signal but almost all altcoin depends on BTC. If BTC will break the 25k and move to 27-28k FTX is easilly reach this targets:
1. $38.5-40 - the closest value area and resitance for the price
2. $48.5 - the key level and reversal point
🚩 The big players (whales) accumulate FTX at the bottom as we can see at the chart.
📊 Here are the preconditions to open a long:
🔥 suqeeze to the trendline
🔥 whales orders to buy which DOM and Footprint indicators show
🔥 possible trap (shake out) to collect long traders sl
🔥 bullish BTC help FTX to reach all the targets
💻Friends, press the "boost"🚀 button, write comments and share with your friends - it will be the best THANK YOU.
P.S. Personally, I open an entry if the price shows it according to my strategy.
Always do your analysis before making a trade.

Target 16.12Following weekly chart.
Found a good long opportunity ( around 25%) RSI support a long signal also.
TP 16.12
SL 10.63 - Plase wait for candle close to stop position.
