FTT | Ready to Bounce Back..!!
#FTT/USDT (Update)
Descending channel Formation in Daily timeframe..!!
Looks Like Bottomed out, Ready to Bounce Back..📈
Please like the idea for Support & Subscribe for More ideas like this and share your ideas and charts in Comments Section..!!
Thanks for Your Love & Support..!!
FTX

Runeusdt (THORChain)If you look at my previous analysis, I analyze very simply and I do not use any special complexity
I think the path is drawn and The M pattern is evident in RSI and its Chart.
Given that it was delist from the FTX exchange today.
If you buy from the specified point, the first step can be good...
It is not financial advice to be on your strategy

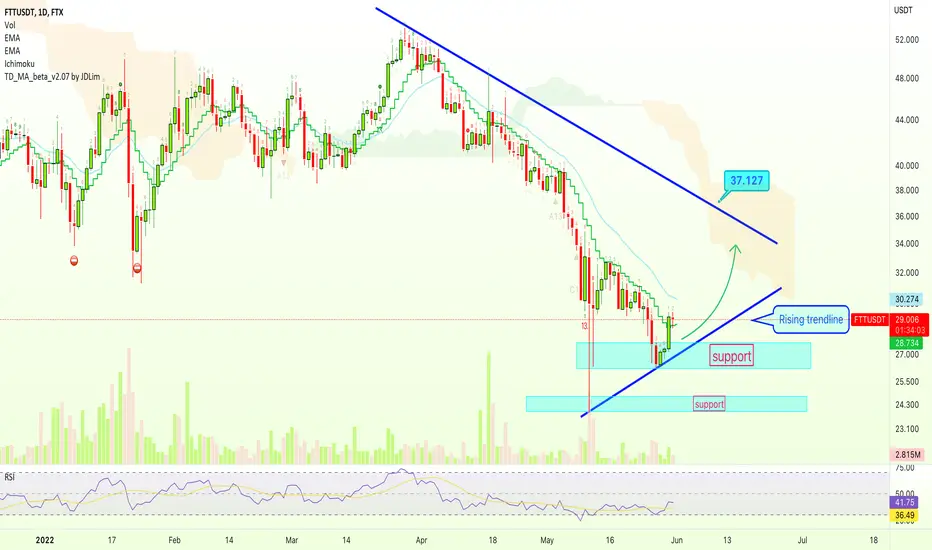
FTX Token (FTT) Chart Analysis + Target & Support LevelsWe can see that FTTUSDT (FTX Token) managed to break above EMA10 on negligible volume... Which isn't really good but, once we have a bounce start to develop, we can see the counter-trendline being challenge, this is mapped on the chart.
We stay bullish above the "rising trendline".
We turn/switch/adapt to bearish below "support".
We aim at $35-$37 as bullish target on the next jump.
Namaste.
No Bitcoin Short-Term Recovery? Yes Recovery! Patience is keyWhile now it is easy to see Bitcoin going lower, at the moment that isn't the case.
We are still trading above our local support, around $27,777 on this setup.
This is marked with light blue and red dashed lines on the chart.
As long as Bitcoin stays above these levels, we expect a short-term bounce to around $34,000 to $38,000...
If Bitcoin moves and closes below our support, then look at the red arrow... That's how it goes.
We are patience.
We are grateful.
We are light!
We are love!
Thanks a lot for your continued support.
Namaste.

FTT great future ahead :) Fundamentals:
+ FTT native token with endless possibilities
+/- Relatively Risk-Off token within the crypto industry. This does not mean it should survive crypto winter better than others, but it is more of a relatively "Safe" opportunity.
Opinion:
FTX native token. The possibilities are endless.
This is not intended or made to constitute any financial advice.
Notes on how I personally use my charts/NFA:
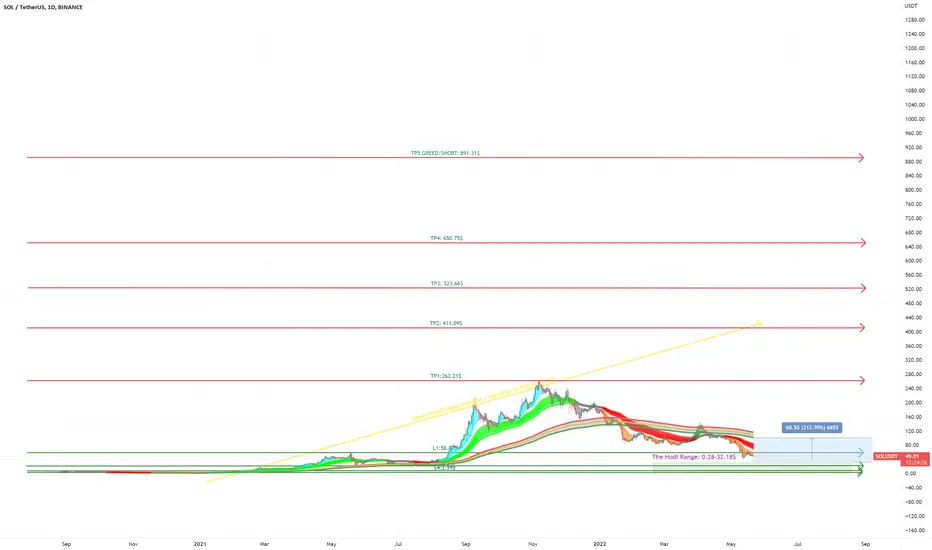
Each level L1-L3 and TP1-TP3 has a deployment percentage. The idea is to flag these levels so I can buy 11% at L1 , 28% at L2 and if L3 deploy 61% of assigned dry powder. The same in reverse goes for TP. TP1: 61%, TP2:28% and TP3:11%. If chart pivots between TP's, in-between or in Between Sell levels these percentages are still respected. I like to use the trading range to accumulate by using this tactic.
Just my personal way of using this. This is not intended or made to constitute any financial advice.
This is not intended or made to constitute any financial advice.
FED Macro Situation Consideration:
All TP's are drawn within the context of a return to FED neutral policy. I do not expect these levels to be reached before tightening is over.
NOT INVESTMENT ADVICE
I am not a financial advisor.
The Content in this TradingView Idea is for informational purposes only, you should not construe any such information or other material as legal, tax, investment, financial, or other advice. Nothing contained within this idea constitutes a solicitation, recommendation, endorsement, or offer to buy or sell any securities or other financial instruments in this or in in any other jurisdiction in which such solicitation or offer would be unlawful under the securities laws of such jurisdiction.
All Content on this idea post is information of a general nature and does not address the circumstances of any particular individual or entity. Nothing in the idea/post constitutes professional and/or financial advice, nor does any information on the idea/post constitute a comprehensive or complete statement of the matters discussed or the law relating thereto. You alone assume the sole responsibility of evaluating the merits and risks associated with the use of any information or other Content on the idea/post before making any decisions based on such information.

FTTUSDT - SETUPFTTUSDT price hit the last hope where strong support lies. If bulls gain some volume and momentum we could see a strong pull back and after crossing the previous high and trendline we may see an upward surge.

Are You Prepared For The Long-Term? The Whales Are...So, this is back in late 2018, looking at the previous Bitcoin capitulation.
I remember it clearly because I was out of town and saw my capital being slashed in more than half in a matter of hours...
I share these as a warning for you to prepare and protect your capital as much as you can and want.
Here is the chart:
Notice that the initial low after the All-Time High was set at $6000 in February 2018.
It took until November (over 8 months) before the support broke.
Capitulation followed and the whole process took 6 months.
Bitcoin closed RED for 6 straight months.
Present time: BITCOIN
From $13,000 to $30,000 there isn't much support.
The "orthodox" top for Bitcoin happened April 2021.
The initial low was set in June 2021 at $28,805.
This time around it took longer (11 months) but the initial low has been broken.
This is what signaled the 2018 capitulation.
CONCLUSION
With a volume breakout happening in favor of the bears...
11 months of "shaky/volatile distribution"...
Bitcoin can still close red for another 3-5 months.
This is just one of the many possible scenarios.
Be prepared.
I hope you find this information useful.
Thanks a lot for your continued support.
Namaste.

Bitcoin & The FED Increasing Interest RatesWe saw how the news people got many of our readers and supporters confused by making them believe that rising interest rates was good/positive for the financial markets.
We all know/knew that the Fed raising interest rates is always a bearish scenario.
Instead, this situation was hyped up as something bullish and the market pumped in response... The rookies were hooked in and a crash followed; money lost.
Now what we know from past history, books and all data available has been confirmed; Everything drops when the Fed raises interest rates...
I am writing this in support of my previous article about Bitcoin (see below):
Are You Prepared For The Long-Term? The Whales Are...
Here we talk about being prepared for the long-term, as prices go down just as they go up.
So, the Fed will raise rates again next month... And then again and then again.
This fact supports my article above.
Let's enjoy the Altcoins while we can.
Think back March this same year...
Yes, it grows, it is great but do not get lost in the hype and euphoria that quickly builds up.
Stay sharp and secure profits.
Avoid margin/futures and all gambling until the bear market is 100% over.
Focus now on buying and accumulating.
Buy, buy, buy for the next 3-8 months.
Hold anything and everything you bought for a few years; Peak 2025 or 2024.
In a nutshell, we are still in bearish territory but the market will absolutely grow after.
We expect some relief this or next week...
The relief can last 2-4 weeks, more or less...
Then the resumption of the trend (down we go).
The bottom can happen this very same year...
After the bottom is in, the only place left to go is UP!
This is not financial advice.
Do your own research.
Thank you for reading.
Thanks a lot for your continued support.
Namaste.

Sol the Icarus of the cryptoverse.Long term chart for SOL. Levels of interest for buys and take profit. (Take profits are not expected to be reached until after the FED is done with tightening, and possibly a couple of months after a return to neutral policy.)
Fundamentals:
Sol is not a blockchain like others. The term blockchain is almost incorrect. However, it does have big capital behind it and exchanges such a FTX behind it. It has a central office. It is U.S based. It is also prime to lead the way in regulation compliance. In terms of price I have no doubt it will enter a parabolic rise once the FED returns to neutral policy/accommodative policy.
FTT/CRO FUTURESThink of FTX token as Apple & Crypto.Com as Gamrstop... Now you know where retail will pile into and where the deep liquidity is.
FTT = stability
CRO = affordablity

Capitulation To Happen Now? Comments... $50K, $20K, $15K ???We have 6 weeks closing bearish for BTCUSD, the worst ever...
Do you think that capitulation will take place now?
A huge fast 30-50% drop to set the bottom before a change of trend take place?
(Something like this ...)
Tell us in the comments...
Thanks for reading.
Namaste.

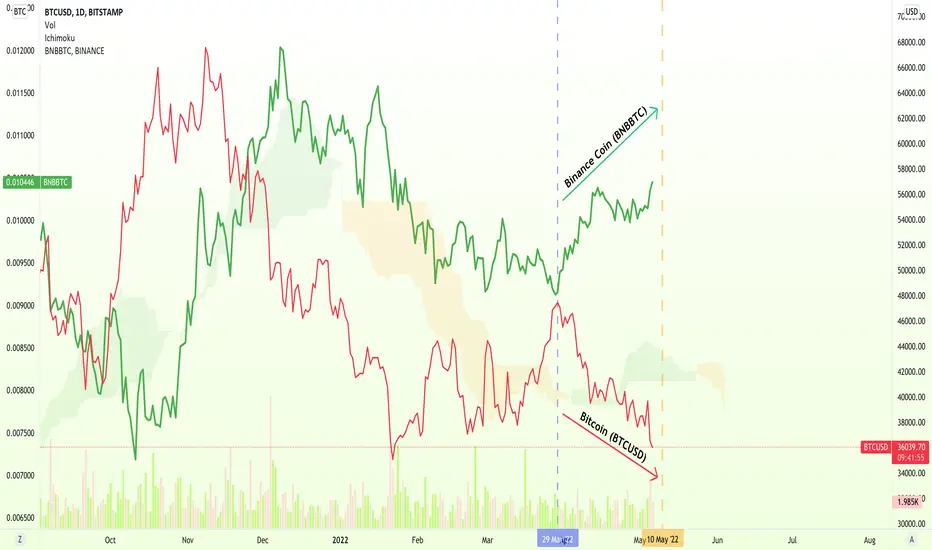
Binance Coin vs Bitcoin Negative Correlation! (How To Protect...We see a clear negative/inverse correlation between Bitcoin (BTCUSD) and Binance Coin (BNBBTC)... We can turn this into something good.
We can use Binance Coin, the BNBBTC pair, to protect our Bitcoins while the correction intensifies.
We are fully ready and prepare for the worst possible outcome/scenario.
We are prepared for $22,222 or $11,300 bottom at the final bear-run; But this can take a while...
Meanwhile, we can protect our Bitcoins by moving to the Altcoins that stay strong.
This is not financial advice.
We do not trade futures/margin nor any type of gambling.
We do spot trading only.
We use patience and we have a strategy...
We buy and we hold... Long-term.
Patience is key and the true way to win.
Namaste.
SOLANA LONG : accumulate hold & buy Solana (SOL)
Buy as low as possible and sell as high as possible.
2 Supports
2 entry points.
S1: $ 75
S2: $ 50
What if it goes down even more? It accumulates! the project is not under discussion.
Lpi.sa

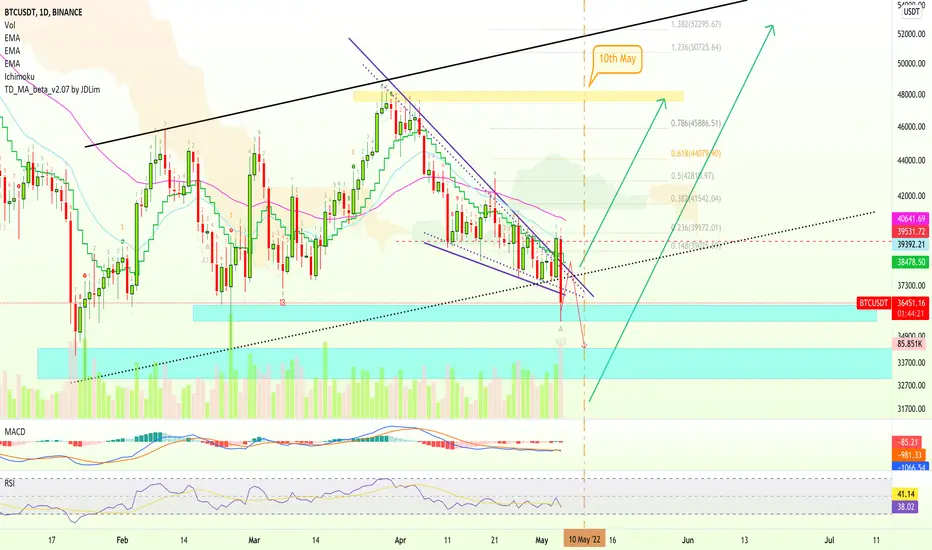
Do Not Despair, Bitcoin Will Go Up (1 Week)Easy my friends, do not despair and take it easy, Bitcoin will soon go up... We say within 5-7 days.
The 10th of May can be a very auspicious day, so today it is a good time to patiently wait.
Rest easy...
The bulls are on the way.
Namaste.
FTT bull caseFTX Token is trying to break out of this falling wedge (yellow) and may be forming Inverted Head and Shoulders🤷 on the Daily timeframe. If price breaks the falling wedge upper edge and then the Neckline I think there is chance for run to 68 and even higher. Actually in anticipation of this happening I'm already looking for buy signals on lower timeframe (2h) and I see another potential Inverted Head and Shoulders in the making:
Once the Neckline of this smaller iH&S (2h)☝️ is broken I will set the BUY LIMIT order to catch the pullback to Neckline (testing it from above) as shown on the 2h TF picture.
ENTRY : Backtest of the broken Neckline (2h) @ 43.5
STOPLOSS (SL) : Right Shoulder (iH&S Daily) = Head (iH&S 2h) @ 37.3
TARGETS (TP) : Inverted H&S target projections @ 49.5 & 68
REWARD RISK RATIO (RRR) : 1 & 4
INVALIDATION : when SL level hit
Check my other stuff in related ideas.
Please like👍, comment🗣️, follow me✒️, enjoy📺!
⚠️Disclaimer: I'm not financial advisor. This is not a financial advice. Do your own due dilingence.

$COIN/USD 1D (#FTX) Falling broadening wedge breakout and retest⚡️⚡️ #COIN/USD ⚡️⚡️
Exchanges: FTX
Signal Type: Regular
Current Price:
170.00
Entry Zone:
169.85 - 156.51
Take-Profit Targets:
1) 213.23
2) 261.47
3) 309.71
Stop Targets:
1) 122.98
Published By: @Zblaba
Coinbase is pulling back to previous support, acting as strong demand zone.
Risk/Reward= 1:1.25 | 1:2.45 | 1:3.65
Expected Profit= +30.68% | +60.24% | +89.80%
Possible Loss= -24.64%
Fib. Retracement= 0.382 | 0.618 | 0.786
Margin Leverage= 1x
Estimated Gain-time= 3.5 months
Tags: #COINUSD #Crypto #Tokenized #Stock #Nasdaq
Website: www.coinbase.com

Bitcoin Bullish Jump Can Lead To $54,000 Next!Bitcoin is trading within an ascending channel, we have a falling wedge and also higher lows.
Now that prices are trading near support, April is over and the summer yet to come, the possibility for a bullish wave becomes strong.
Here I am mapping some support and resistance levels.
Bitcoin staying above the blue marked space signals bullish...
Any trading below this level and we test the Jan./Feb. low.
This is an early signal...
But early is good.
Additional details on the chart.
Feel free to hit LIKE!
Trade Safe!
Be Patient!
Thanks for your support.
Namaste.

FTT/USDTPossible breakout is near! Pros: $FTT is forming a diamond bottom reversal pattern. Should spike to $60 Cons: Lack of volume

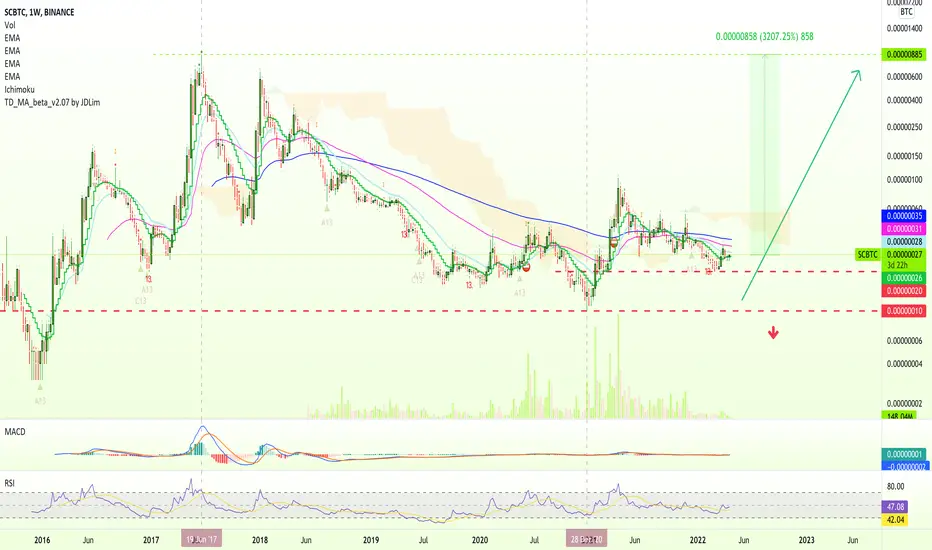
Siacoin Long-Term Chart (3200% To All-Time High)Siacoin hit its All-Time High vs Bitcoin back in June 2017.
Taken from the current price we have a 3200% potential if the same price is hit... But since we are within a higher low long-term, there can also be higher highs...
Patience is key.
We buy and hold long-term.
We trade with patience and love.
No margin, no gambling, no jumping around...
Patience...
Thanks a lot for the continued support.
Namaste.
0x Moving Above EMA200 (Strongly Bullish)We can see ZRXBTC (0x) moving above the MA200 black line...
This is a really good and strong bullish signal, high trading volume is still yet to come which tells us that there can be additional growth.
As I mentioned in the UNIBTC chart analysis, we look like to near support.
Even though we have a strongly bullish chart here, we normally skip this one for the ones that are yet to start moving.
We like to buy BEFORE the bullish action starts.
This is still good though if you know what you are doing.
Light blue = support
Light yellow = resistance (targets)
This is not financial advice.
Namaste.

Bitcoin Aims at $48,000+ On Next Bullish Jump!I will start with the same warning as with Litecoin (LTCUSDT), it is still daily and we need confirmation for this analysis/move...
Bitcoin is likely to move above $44,444 followed by $48,111 after a candle close above $41,000 today.
This is not financial advice.
Do your own research before trading.
Namaste.

Litecoin Aiming To Hit $150 (35% Jump!)This is looking likely right now after a dull weekend and good volume coming in today.
GREEN DAILY CANDLE CLOSURE NEEDED FOR CONFIRMATION.
If we close green today and above $111.1 we are very likely to see Litecoin (LTCUSDT) hit $125 followed by $150...
It is still early though so confirmation is needed.
Namaste.

FTT 4h resistance breakout + RSI DIVERGENCEa good 1D closure above the 4h resistance level , with this RSI bullish divergence would be a signal good enough for me to enter this with a good long which would see 48 (and 51) as targets
stop loss around 41
let me know what you think about this
+ follow and like for more please!!
