Aave bounces at EMA50/EMA100 (Next Target Mapped)We are seeing many altcoins recover after a just a few short days (2 weeks max) of correction... We have good potential for a new high since we are getting higher lows.
You can find more details on the chart.
Previous trade idea 27-February
Thank you for reading.
Thanks for the support.
Namaste.
FTX

Bitcoin Cash Bullish Breakout vs Tether...The altcoins do move together...
Here we have the same chart as the COMPUSDT pair we looked at recently.
We have higher low after late February and today a strong breakout support by volume.
There can be additional growth.
Namaste.

Bitcoin Cash Strong Breakout Confirmed by VolumeWe can see a strong bullish breakout happening today for Bitcoin Cash, BCHBTC, as prices move above EMA10/50/100...
This breakout is confirmed by good volume, which will continue to increase before the day closes.
The targets are mapped on the chart.
Namaste.

Bitcoin | Support Levels + AltcoinsRejection took place right at MA200, very bad signal.
Today EMA50 is being lost as support.
Bitcoin is aiming lower...
Here are the more important support levels to look for on this drop:
$40,590 (Not likely to hold).
$38,788 (Strong support).
$36,220 (Likely to be tested on a wick).
This is short-term...
Altcoins
All is good with the Altcoins vs Bitcoin pairs (minus top ones which follow Bitcoin).
They can correct for weeks and then resume growing.
Check my previous articles for more information on how things will go:
Bitcoin Daily FULL Analysis | Back To Basics (+Altcoins)
(Relevant now... read "My view" part.)
-----
Bitcoin Monthly | RSI and MACD (Enjoy The Altcoins While We Can)
Enjoy your weekend.
Namaste.

KNC/PERP Trendswitch Shorthello everyone,
as it currently looks the Coin KNC switch from a Rally to a Sell Off.
When the Price cross the Support i go short to the next Fibonacci Level below.
have a nice day to all of you!

Are Bulls Losing Track On 47k?Weekly Time-frame
We are about to cross the 0.618 $46,669 and encounter the next resistance $46,866. Potential rejection or it can be a next rally to the upside.
1D Time-frame
We are ready for a massive drop but if the supply zone breaks this can be the next rally to the upside. Demand zone is holding up 0.236 $45,137
4H Time-frame
Triple top will be super bearish if we get a rejection in the supply zone we can expect more to the downside. If we break the supply zone We can create a new high.
1H Time-frame
How to trade
BTC short position
entry $46669
entry $47342
SL 1-5% $48318
leverage 20x
TP 1 $46195
TP 2 $45722
TP 3 $45137
TAYOR
DYOR
NFA
We will discuss more on the possibility on our Live. Stay tune and check with us!
Want more insights before US market open? Hit Like, Share, and Subscribe for more daily trading tutorial & cryptocurrency news
Trade Scholar, the best cryptocurrency educational community online!
Find the content above difficult to understand?
Feeling lost about how to trade?
Want to learn how to do your Own Price Prediction?
We endeavour to share you our investment knowledge & experience in order to help you starting your path to financial freedom. Follow, Subscribe & Join our Community to trade together!
Disclaimer: Above Technical Analysis is pure educational information, not Investment Advice. The information provided on this post does not constitute investment advice, financial advice, trading advice, or any other sort of advice and you should not treat any of the website's content as such. Do conduct your own due diligence and consult your financial advisor before making any investment decisions.

Ethereum Daily Now Above MA200, Most Important LevelThis is the most important level now for Ethereum to hold... The black line on the chart stands for MA200.
Above this level, we can see a very nice and strong price jump.
If it goes below, consolidation will continue before the bulls can have more fun.
The way things are looking, we might see higher for a while before any price drop... This is just a guess... Focus on the smaller altcoins, that's where the money grows.
Namaste.

WazirX vs Bitcoin Mirror Image...Look at the strong/steep decline from January to February on this chart... WRXBTC.
Strong declines can lead to strong growth.
We have a strong reversal signal 31-March (marked purple).
We have rising volume today as WRXBTC breaks above EMA50...
We have a strong RSI & more...
The signals are strong and clear.
This Altcoin pair will also grow.
This is not financial advice.
Thanks a lot for your continued support.
Namaste.

Cardano vs Bitcoin | Tricky Yet BullishCardano is going bullish vs Bitcoin (ADABTC).
Why tricky?
We have a challenge of EMA100 today after a bullish flag, pretty clear.
We have strong consolidation above EMA10, clear and strong.
This is tricky because if we see a red candle close today, it would negate these signals and instead of up down we go.
That's the tricky part.
Cardano vs Bitcoin can rise but only after we get a bullish candle close.
Namaste.

COTI vs Tether Same as COTI vs Bitcoin (Multiple Targets Mapped)The USDT (Tether) for COTI is the exact same as the BTC (Bitcoin) pair...
We have COTIUSDT moving above EMA100 today on high volume... Bullish.
Very strong RSI at almost 73.
The MACD is also really strong.
All we need is patience and we can see this pair print additional growth.
Namaste.

COTI Goes Above EMA100 (Another Win!)Here we have another win...
COTIBTC has moving above EMA100 today on high volume... Meaning super-bullish.
Very strong RSI at ~73.
The MACD is also really strong.
We can easily see on this pair additional growth.
Namaste.

Terra Virtua Cup & Handle (Next Target Mapped)Patience is not only key, it is mandatory.
We have the Cup & Handle pattern on the Terra Virtua (TVKBTC) chart, already broke bullish.
The indicators have also gone bullish.
And we have a break and close above EMA50 a few days back.
This all signals higher prices.
We also have a strong buy signal on the daily Renko chart.
Namaste.

Dogecoin Bullish After Initial BreakoutWhat we saw on mid-March for Dogecoin (DOGEUSDT) is just the initial breakout...
It means that it is only started...
Doesn't look like it is the end of it.
DOGEUSDT just came out of a major downtrend/falling wedge; now it stands above EMA50...
It looks bullish...
Whatever happens next is for the market to decide.
Wishing you highly profitable week ahead.
Wishing you health, wealth & success.
Sending you LOVE NOW!
Thank you for reading.
Namaste.

Avalanche Mixed SignalsWe have the classic signals as bullish but the candles are giving out bearish signals.
Yesterday's candle is a shooting star (bearish).
The Doji before yesterday's candle doesn't help either.
With that said, we have prices trading above EMA10 and EMA50, the MACD above zero and a strong RSI.
The November downtrend has been broken though.
Bullish above EMA50.
Correction below.
Namaste.

Bitcoin Mixed Feelings...The chart technicals are bullish.
We have choppy price action.
We have mixed feelings...
It feels like we don't know what is going to happen.
I also smell uncertainty, like something bad can happen at any time...
We are going to go with UP!
Bullish above $42,700 or EMA50 short-term.
Any trading above this level and stay bullish.
If it goes below we reassess.
That's all.
Thank you for reading.
Namaste.

Cardano Bullish FlagCardano (ADAUSD) is now undergoing bullish consolidation.
We see prices consolidating above EMA10 with strong indicators.
Additional growth is possible.
On a price drop the main support is found on the blue square on the chart which matches EMA50 and EMA21 ($1.03 - $1.07)
Thank you for reading.
Namaste.

Ethereum Ascending ChannelEthereum (ETHUSD) is trading within an ascending channel as well as above all MA's.
Bullish indicators here as well.
Main support can be found in the $3000 / $3160 price range or EMA21/EMA50/EMA100.
Namaste.

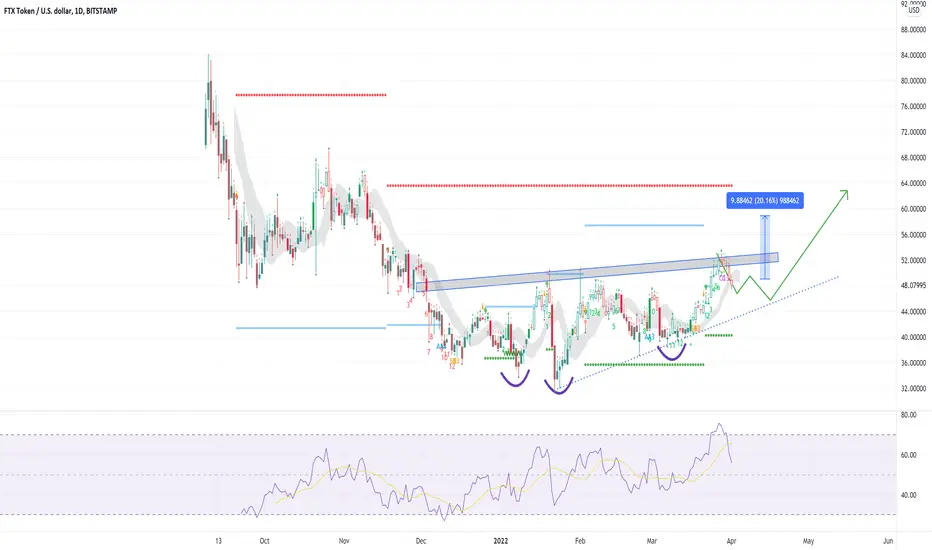
FTX Token FTTUSDT - Ascending triangle breaking out! New leg up- FTT token is very bullish on the higher time frames.
- Currently the price is breaking out of an ascending triangle - one of the most bullish patterns.
- Also we have a descending channel breakout, which indicates us bullish trend reversal.
- Next profit target is the all time high level, but in my opinion it will go much higher.
- The price is now finally above 200 daily moving average.

Buy Long TRX📍SIGNAL ID: #017📍
COIN: TRX/USDT ( 10x )
Positions : BUY / LONG 💹
➖➖➖➖➖➖➖
Entry < $0.0755
SL $0.066 - $0.068
TP $0.077 - $0.085
✅ Big News Rumor
#longtrx #buytrx #trx #scal

LONG FTT📍SIGNAL ID: #015📍
COIN: FTT/USDT ( 10x )
Positions : BUY / LONG 💹
➖➖➖➖➖➖➖
Entry < $48.9
SL $37 - $40
TP $49.5 - $58.8
Salah satu coin pilihan terbaik di spot dan cocok buat di Long
Karena lebih stabil dan tidak pump and dump
Saat koreksi btc adalah salah satu cara yang tepat untuk Buy FTT
#longftt #buyftt #ftt #scal #ftx
Stratis Strong Bullish Bias + Next TargetStratis (STRAXUSDT) is now building a strong bullish bias.
We have many consecutive green candles with low volume...
When we have strong bullish action but no volume, it only means that the real "action" is yet to start.
There is room for a strong jump since the bullishness has been confirmed but the volume hasn't shown up.
The same signal as we saw before...
MA200 goes down while pulling prices up.
Namaste.

Verge Has More To Give vs Bitcoin (270% Mapped)I shared this chart on the daily timeframe a little over a week ago...
Here you have it on the weekly timeframe, the bullish breakout is already on.
Previous chart:
Verge | Let Me Show You Another Signal... (375% Potential)
XVGBTC is moving above EMA10 and EMA21 weekly... This is only getting started.
Patience is key.
We buy and we hold.
Namaste.

Verge After 60% Growth (We Are Getting Closer To...)We are getting closer to our target... This is how the XVGUSDT (Verge) pair is looking after 60%+ growth...
We can clearly see prices now trading above EMA100.
The next target is marked yellow on this chart.
Here is the previous analysis before the initial price jump:
Even though it is already moving, there can be much more
Namaste.
