Reversal H&S target 3.665Following 4h chart.
In short term, there is a good opportunity for a reversal H & S.
TP 3.665
SL 3.263 ( Plase wait for candle close to stop)
FTX

Target 1.895Following 4h chart.
There is a powerful support around 1.42
RSI has also support around 40, this is a long signal for me.
TP 1.895
SL 1.39
Please wait for candle close to close the position.

$ATLAS/USD 8h (FTX) Ascending trendline on supportStar Atlas is up-trending and is very likely to bounce on 100EMA to continue bullish after.
Risk/Reward= 1:1.6 | 1:3.44 | 1:5.54
Expected Profit= +24.26% | +52.15% | +83.89%
Possible Loss= -15.15%
Fib. Retracement= 0.786 | 1.414 | 2
Margin Leverage= 1x
Estimated Gain-time= 1 month
Website: staratlas.com
Contract:
#SPL ATLASXmbPQxBUYbxPsV97usA3fPQYEqzQBUHgiFCUsXx
⚡️⚡️ #ATLAS/USD ⚡️⚡️
Exchanges: FTX
Signal Type: Regular
Current Price:
0.1701
Entry Zone:
0.1701 - 0.1583
Take-Profit Targets:
1) 0.2040
2) 0.2498
3) 0.3019
Stop Targets:
1) 0.1393

sam ponzi to 126sam's original ponzi is going to benefit from solana's bonanza, as solana is just the unofficial ponzi of ftx and alameda research. buy this ponzi, it's well baked to make it yum yum

BNB 10x CZ gang or SAM GANG 20xBNB 10x CZ gang or SAM GANG 20x
Sam gang whatup
So will FTT do what BNB did in 17? yeh prob.
Also this is one of those MUCH SAFER 10-20x than your favorite s&*^coin.
seems my last idea with this theory in mind was a bit early. i tend to do that.
LFG

FTX 170% profit incomingHello all. Here is a simple FTX Token analysis. (Can't buy on coinbase yet!)
Looking at the price on daily chart, we see that FTX is trading in the fib golden pocket at $44-$46. This is indicated on the left side Fibonacci retracement.
We can also see that FTX found support on the ascending line of support which is the bottom yellow line.
The 170% trade is possible if we buy FTX at this current price and sell it at $128 which is the 161% Fibonacci retracement level (indicated on the right side).
It is possible that we see little more pull back around $40 which will correspond with our descending line of support.
Thanks for reading, and stay tuned. Happy Thanksgiving.
What is FTX ? Here is an educational youtube video for you.
www.youtube.com

VRA looking good for a new wave up.Nice daily close back above this area of support.
First target shown but I'm hoping for higher targets for this next leg, 0.2 to 0.35 I don't think they are unrealistic with FTX and Axie Infinity Esports event coming up.
LFG!

BTC USDT LONG SWING TRADE | BTCUSDT | LONG @ 42500 - 43000 | TP @ 43500, 44000, 44500, 45000, 45500 | SL @ 40500 | PATTERN = N/A |
PNF chart on the hourly shows a trend reversal.
The strategies I use involve a mix of PNF and Renko. My type of trading is strictly swing trading.

FTT/USDT - AnalysisBelow HMA 209
All volume are low
Direction Bear !!
We still bear !!
Trade safe but never use a stop loss !!
Bots will catch you !!
Use Alert to stop your trades.

COPE/USD 1DHello Friends..........
SUPPORT AND DEMAND ZONES:
1: WE ARE ON FIRST DEMAND ZONE(1.95-1.80$) . IF BTC WILL STABLE THEN COPE WILL FLY FROM THIS ZONE. (0.61 Fib, Golden Ratio)
2: IF BTC BREAK 58K SUPPORT THEN SECOND DEMEAND ZONE IS MOST IMPORTANT (1.70-150$). (0.78 Fib)
3: IF COPE DIDN'T HOLD SECOND ZONE AFTER BTC 58K SUPPORT BREAK, THEN WE MAY SEE COPE (1.20-1$). 1.0 Fib As We know, Cope is high Volatile Coin
Right Now, the RSI of 4H chart is 25 (Below 30) and it's in buyer zone and on 1D chart the RSI is around 37 so still have a chance that if BTC didn't stable then 70% chances that we will see second demand zone.
If you will get benefit from my TA then please
Hit a like button and follow me on trading View.
Thanks
Disclaimer:
This is just for Education purpose. All profits and losses belongs to you.

FTX / FTTAt the end of its bearish cycle in the future upward crossing of the 50% RSI on the Ashi candles and with a solid confirmation of a new weekly low in one of the next two supports to find the ENTRY POINT best (s).
We observe the continuity of the uptrend and the immense upside potential of this FTX Exchange Crypto.

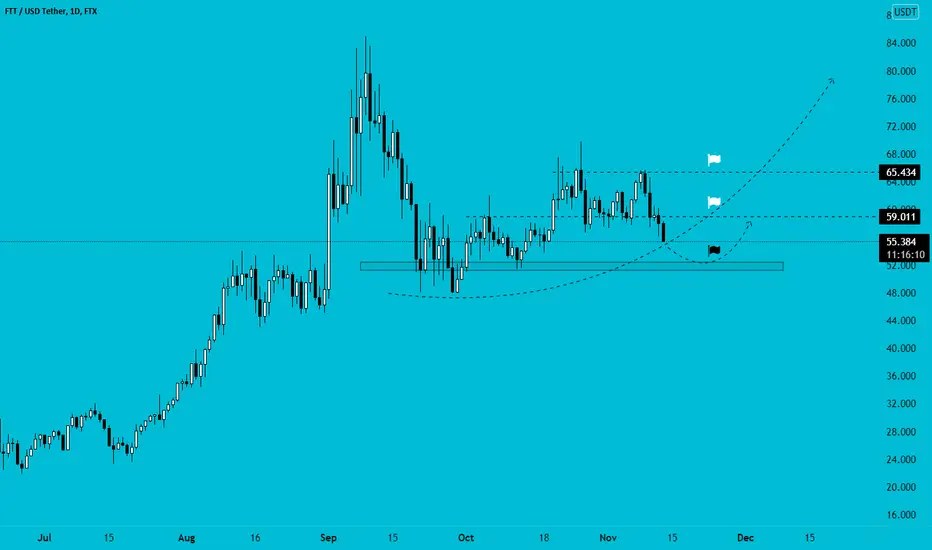
$FTT - Breakout TimeAfter a few weeks of consolidation FTT has traded relatively flat between 63.5-57 USD
Price action is tightening
EMA Ribbons are tightly correlated
Bullish pennant is forming quickly
Targeting 90 USD minimum on this move

💡COPEUSD ANALYSIS💡HELLO FRIENDS
TECHNICALLY WHEN WE LOOK AT THE GRAPH IN 4 HOURS, THE Gartley Bull Formation ( Gartley Bullish ) HAS OCCURRED.
THESE TRANSACTIONS ARE VERY RISKY. IT MUST NOT BE
ENTERED WITHOUT MONEY RISK MANAGEMENT. FUNCTIONAL TARGETS ARE AVAILABLE ON THE CHART
TP1:2.78
TP2:3.21
PROCESSING ENTRY LEVEL:2.44 (4-HOUR CANDLE CLOSURE) IS NOT
INVESTMENT ADVICE. IF YOU
BENEFIT FROM ANALYSIS, DON'T FORGET
TO LIKE AND FOLLOW 👍👍👍👍👍
Gartley Bog Formation ( Gartley Bullish ) Retracement from
A to D should ideally be 61.8% or 78.6% of the XA leg.
• A valid ABCD pattern should be observed in themove from A to D.
XA and AD must be synchronized in time.
• AD time should be between 61.8% and 161.8% of XA time .
Sometimes the ABCD formation retracts 100% of the XAB leg. ( Double Bottom )
• In this case, for a true double bottom, the timeXA and AD must be equal.

🔥 FTT Huge Bearish 1-Year Wedge: Break OutOver the past year, FTT has formed a huge bearish wedge pattern. Classically, these are reversal patterns, so a strong bearish move would be expected.
However, I'm still fairly bullish on the crypto market as a whole. My expectation is that FTT will see some bearish moves in the near future. I'll be watching for the support area for a potential reversal.
A break below the support area might indicate a longer-term weakness.
Happy trading!

FTT/USDTDrop will turn bullish from 50-52K
*Please share your opinion on it, write in the comments. Dont forget some cheers bravo. "
Teşekkürler.
FTX Token - ATH? 🤔FTX token recently made all time highs but the quickly dropped back down.
It broke the major trendline, which tells us that the uptrend is growing weaker. We are now struggling to move up back to ATH's.
Will be keeping a close eye on this and if we correct all the way to ATH, could be the making of a great short!
However, if we see any bullish corrections now, we can get in with stops below the red trendline.

FTT flipped SR and heading to new HighsFTT nice break out and flip of S/R
Price retesting currently the old resistance as support now.
Want to see price go back above PWH / WO / DO and hold for a push up towards PMH to $70
MS is bullish on the H4
Lowest price can go to remain bullish is the MO at $59.5
I do not want to see a close of H4 bellow it.


#FTXTOKEN #FTX DAILY CHART TECHNICAL ANALYSIS
Considering the orange and purple uptrend channel and the fact that the price has supported its uptrend line, as well as the formation of a triangular pattern, we can expect the price to grow to one of the following targets.
TARGET1: 100$
TARGET2: 140$
TARGET3: 170$
Due to the strong resistance on the first target, if the price reaches this target, save profit and free risk must be done.
STOP LOSS: 47$
ENTRY: 66-58
TIME 2-8W

SOL/PERP pullback to the .382Im all for the BULLS but logic trumps hopeium.
this has a 55% chance of playing out if it flips lets goto 1k SOL :D

SPELL looks like having a comeback!After a massive dump on listing, SPELL has been rising steadily.
It's very probably mostly bots as the price ranges fir Fib levels, too well to say the least.
However as reaching ATH, moving above the top resistance will enable a parabolic rise.
Stop below the trend at a point comfortable with your risk apatite.


$FTT FTX 4H chart + ema cross been watching too many Sam podcasts
ema cross could bring good 4h candles as long as we stay in the channel
decent upside and a safe hold
