FUN

🔥 FUN Channel ReversalAfter seeing a strong pump in early April, FUN seems to be falling towards the channel support again. The channel has held strong for over 7 weeks now, so I'd assume that it will hold again.
Wait for the price to touch the channel support before entering the trade.
Happy trading!

“Facts are meaningless" - Homer Simpson I've had quite some fun waiting for the Bitcoin move recently. After a great response from the "Buffoonery" post I was asked about some of the tech depth. So I posted The "Rocket" idea - see all of these below in related ideas.
Waiting for things to setup I thought I would play with some art and the chart looked like Bart Simpsons Hairline. So I posted a joke idea which actually got picked as an editor's pick. As our trades are longer type setups it's been great to create some educational posts, I am keen to assist new traders coming to the market. However, along the way you need a little fun. Hence the Simsons post.
I am still a firm believer that BTC needs a retracement for it to go higher - just as suggested in the "route to professional attainment" post.
The facts are COT data shows more shorts than longs. Even more added in yesterday's report.
Grayscale (another post below) have had 30 days of discount offering in the fund.
We have "whales" taking coins from exchanges - this is not what you would assume...
And about an hour ago, I had a friend here send an interesting article bitcoinist.com Thanks @MiketheN00B
Monthly stochastic
Respect of an ugly 4 move down
Previous COT post
So to clarify - I am bearish BTC for this move from 3 to 4 (Bullish as a whole) and have held BTC since 2011. So although we are currently not shorting, we are not avid buyers at this overvalued level.
With the previous posts - there's a lot of reason to hold, But there are plenty of reasons to protect the positions and buy value dips.
Although I do enjoy playing with chart art and see the funny side of mixing business & pleasure.
Have a smile, have a laugh and trade safe!
Disclaimer
This idea does not constitute as financial advice. It is for educational purposes only, our principle trader has over 20 years’ experience in stocks, ETF’s, and Forex. Hence each trade setup might have different hold times, entry or exit conditions, and will vary from the post/idea shared here. You can use the information from this post to make your own trading plan for the instrument discussed. Trading carries a risk; a high percentage of retail traders lose money. Please keep this in mind when entering any trade. Stay safe.


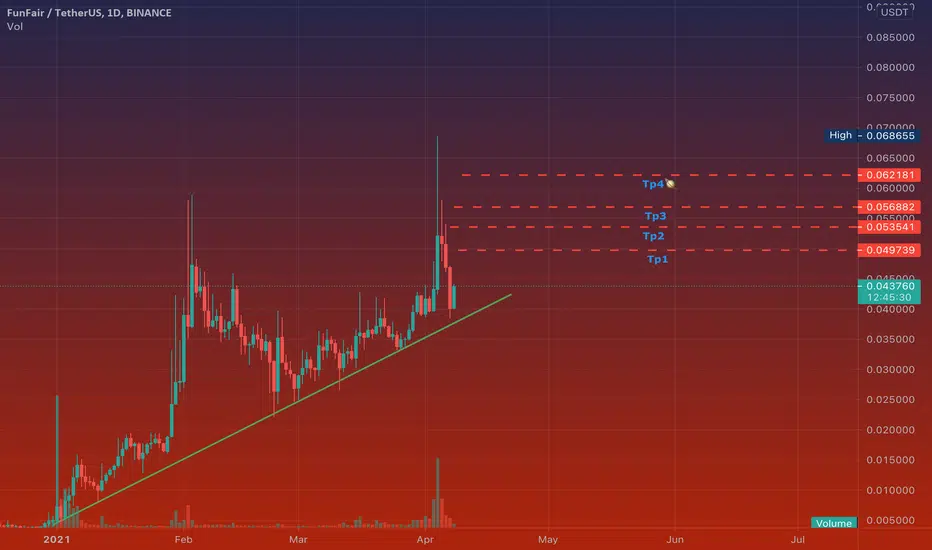
FUNUSDTHello to you all. Mars Signals team wishes you high profits at all times.
We are in daily time frame, the price has hit its support line and has been able to be supported and start moving upwards. We intend to be able to touch our targets in the next few days.
Warning: This is just a suggestion to you and we do not guarantee profits.
Wish you luck!


BITCOIN CRAB: BIG MOVE COMING 🧙♂️I noticed something that will be funny for most of you. Every time a certain cryptocurrency forms this "Crab Claw" (in reality just a type of ascending triangle), something major happens (e.g. Tesla invests in BTC) and we have another breakout both backed by fundamentals and technicals. So I'm thinking bitcoin that is stuck in this 50-60k range will see some major moves in a bit. Buckle up fellas!


$FUN, 60% daily candle..$FUN
60% daily candle..
Not trading this one but its an overall signal of how bullish the Alts market is right now. 😌

LIVE Technical Analysis for FUNEnjoy and leave comments.
Happy trading guys, it is going to get choppy next month.


ETHEREUM: TURTLE PATTERN? 🐢Hope everybody is having an amazing week. Here we noticed that something is going on with the ETH. Call it whatever you want: reversed cup and handle, but we think it's a TURTLE. Obviously, don't take this idea seriously, however, we wish you all a good Friday tomorrow and the rest of your week. See you on Monday with more ideas! Stay tuned!


🆓FunFair/USDT Analysis (30/3) #FUN $FUNFUN mostly conquered the 0.04$ zone and is heading to 0.06$ zone.
📈BUY
-Buy: 0.039-0.041$. SL B
📉SELL
-Sell: 0.057-0.06$. SL A
♻️BACK-UP
-Sell: 0.039-0.041$ if B. SL A
-Buy: 0.029-0.031$. SL A
❓Details
Condition A : "If 1D candle closes ABOVE this zone"
Condition B : "If 1D candle closes BELOW this zone"


FunFair (FUN) Green (100% to 150% Target Mapped)FUNBTC (FunFair) is now bullish with its price trading above all the EMAs we track.
The trading volume has been low recently with multiple days where the volume goes up favoring the bulls.
This is a solid bullish setup and remains active above 40 satoshis long-term.
Below 40 satoshis we can see lower prices.
There can be additional consolidation before prices move up.
More information on the chart.
Namaste.


The biggest threat waits us aheadYear over year the dips are deeper and deeper 🌊
You can see how it was increasing linearly from 2018.
OTOH the overmaximum was increasing exponentially❗
📊In general the price moves in the divergent triangle, which symbolizes the increasing volatility.
And this volatility grows dramatically🔻🔻🔻
This time the correction was small, and we've reupdated maximum very quickly.
Despite, the growth is overflooded 📉
Yet the bigger (and probably the biggest) ambush still waits for us ahead...
🎃
