GOLD → The market is waiting for NFP. What could happen?FX:XAUUSD is bouncing off resistance at 3310, confirming the upper limit of the new trading range. The dollar continues to rally, but the market as a whole is stagnating ahead of upcoming news—NFP is coming up!
Gold is consolidating at monthly lows around $3268, awaiting key US labor market data (NFP). Trump's new tariffs (10% globally, 35% for Canada, 39% for Switzerland) have boosted demand for the dollar, putting pressure on gold. Markets are waiting for NFP: forecast +110K jobs, unemployment 4.2%. Weak data (<100K) → gold may rise to $3400. Strong (>150K) → the dollar will strengthen, gold will continue to fall. The probability of a Fed rate cut in September is <50%.
Based on yesterday's data, I would cautiously suggest that NFP will be in the range of 125K–145K, slightly above the consensus (110K). This will play into Trump's hands (I think you understand what I mean...).
Resistance levels: 3300, 3310, 3320
Support levels: 3287, 3268, 3255
The news has a negative nuance — unpredictability. Be careful.
Technically, based on the data we have at the moment, I would assume that the market may test resistance at 3300-3310 before a possible pullback to the specified support. BUT! Unpredictable data could turn the game around, and in that case, if the dollar falls, gold could start to rise.
Best regards, R. Linda!
Fundamental Analysis

XAU/USD (Gold) - Triangle Breakout (1.08.2025)The XAU/USD Pair on the M30 timeframe presents a Potential Selling Opportunity due to a recent Formation of a Triangle Breakout Pattern. This suggests a shift in momentum towards the downside in the coming hours.
Possible Short Trade:
Entry: Consider Entering A Short Position around Trendline Of The Pattern.
Target Levels:
1st Support – 3249
2nd Support – 3225
🎁 Please hit the like button and
🎁 Leave a comment to support for My Post !
Your likes and comments are incredibly motivating and will encourage me to share more analysis with you.
Best Regards, KABHI_TA_TRADING
Thank you.
Disclosure: I am part of Trade Nation's Influencer program and receive a monthly fee for using their TradingView charts in my analysis.

Gold (XAU/USD) 1H Chart – Trendline Support and Upside TargetGold price is trading above the support trendline around 3,287. A bounce from this level could drive price toward the 3,313 resistance and potentially the 3,333 target. Maintaining support above 3,287 is key for the bullish outlook.

NFP quick buy moveGold (XAUUSD) forms support near 3,262 with a potential bullish move expected on NFP news. Targeting 3,443 resistance zone for a quick buy opportunity.

Apple (AAPL) Shares Jump Following Earnings ReportApple (AAPL) Shares Jump Following Earnings Report
Yesterday, after the close of the regular trading session, Apple released its earnings report, which surpassed analysts’ expectations:
→ Earnings per share: actual = $1.57, forecast = $1.43;
→ Revenue: actual = $94.04 billion, forecast = $89.35 billion.
As a result, AAPL shares surged in the post-market, rising from $207.57 to $212.51.
Media Commentary:
→ The company reported a 13% year-on-year increase in iPhone sales.
→ However, according to Tim Cook, tariffs have already cost the company $800 million and this figure could exceed $1 billion in the next quarter.
Technical Analysis of the Apple (AAPL) Stock Chart
Following the volatility in April 2025, price action has justified the construction of an ascending channel (marked in blue). The $216 level, which has acted as a key reference point since March, remains a significant resistance area, because:
→ It has consistently prevented AAPL from reaching the upper boundary of the channel;
→ Even in the wake of a strong earnings report, the price failed to break through this level in post-market trading.
If the $216 level continues to cap gains in the coming days – despite the positive report – the stock might pull back towards the median line of the blue channel (following the post-market rally). This zone often reflects a balance between supply and demand. While such a retracement would appear technically justified, it may raise concerns among shareholders, particularly when compared to the more aggressive price rallies seen in the shares of other tech giants, such as Microsoft (MSFT), as we discussed yesterday.
From a more pessimistic perspective, peak A may turn out to be yet another lower high within a broader bearish structure that has been forming on the AAPL chart since December 2024, when the stock reached its all-time high around the $260 level.
This article represents the opinion of the Companies operating under the FXOpen brand only. It is not to be construed as an offer, solicitation, or recommendation with respect to products and services provided by the Companies operating under the FXOpen brand, nor is it to be considered financial advice.

DXY Just Broke Through the Lock… Where’s the Market Headed Now?🌅 Good Morning, Friends!
A few days ago, I marked 98.950 as a key threshold for the DXY index. As of today, that level has officially been broken—and the bullish momentum we anticipated is now kicking in. 📈
The next target? 101.000.
That said, it’s crucial to remember: DXY is heavily influenced by fundamental data. Stay alert and keep a close eye on key economic developments—they’re essential for navigating this move.
This breakout validates the analysis I shared with you all. And it wasn’t just about charts—it was about discipline, precision, and timing.
Every single like from you is a huge boost to my motivation. Thanks from the heart—your support drives me to keep sharing these insights! 💙

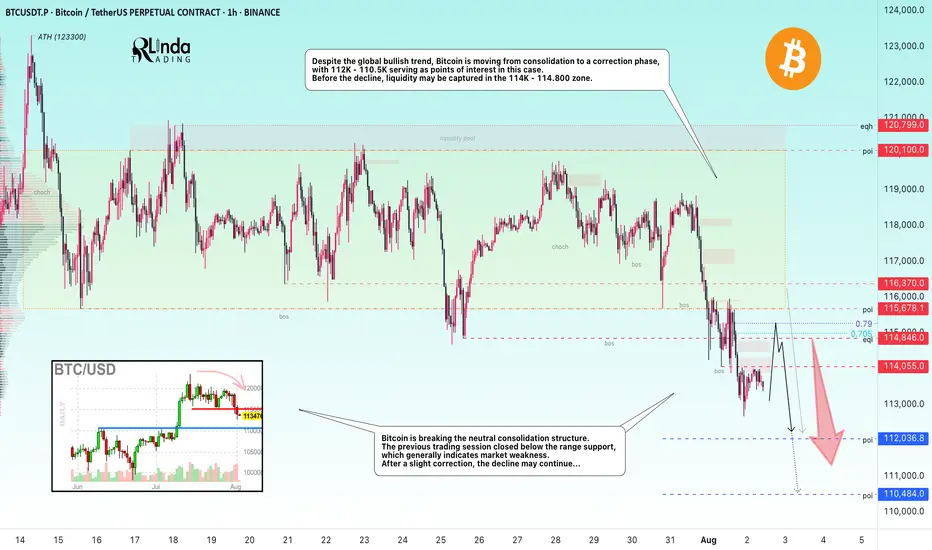
BITCOIN → From consolidation to distribution. Market weaknessBINANCE:BTCUSDT.P is moving from consolidation to a correction phase. The price broke through the support zone of 114.5–115.5, closing within the Friday trading session in the sell zone...
Previous idea from July 22: BITCOIN → Consolidation and compression to 116K. Correction?
The fundamental background is shifting to neutral, the hype has temporarily ended, and there are no bullish drivers yet. And for the health of the market, a correction is needed. Bitcoin is breaking the neutral consolidation structure. The previous trading session closed below the support range, which generally indicates market weakness. Despite the global bullish trend, Bitcoin is moving from consolidation to a correction phase, with 112K - 110.5K serving as points of interest in this case. Before the fall, liquidity may be captured in the 114K - 114.800 zone.
Resistance levels: 114.05, 114.85, 115.67
Support levels: 112.03, 110.48
After a strong movement, the market may enter a correction or local consolidation, during which it may test the specified resistance zones before continuing its downward movement to the zone of interest and liquidity at 112 - 110.5.
Best regards, R. Linda!
Why Pay $250K for a $115K Bitcoin? Welcome to Strategy (MSTR)This is already the third article I’ve written about Strategy (formerly MicroStrategy), and for good reason.
You don’t need to be a financial expert to ask: why buy a stock that simply mirrors Bitcoin’s price — but at a massive premium?
No matter how sophisticated the explanations may sound, or how many times you’re told that “if you don’t understand it, it must be brilliant,” the reality is much simpler — and much more absurd.
Buying Strategy today is like paying $250,000 for Bitcoin while the actual market price is $115,000.
It’s not about complexity. It’s about common sense.
I won’t dive too deep into it — no need to fight “financial sophistication” with even more sophisticated words.
The point is simple: buying Strategy is like paying me $10,000 just so I can hold your $10,000 and call it an “innovative capital deployment strategy.”
Sounds smart, right? Until you think about it for more than five seconds.
Now let’s look at the posted charts — simple and visual.
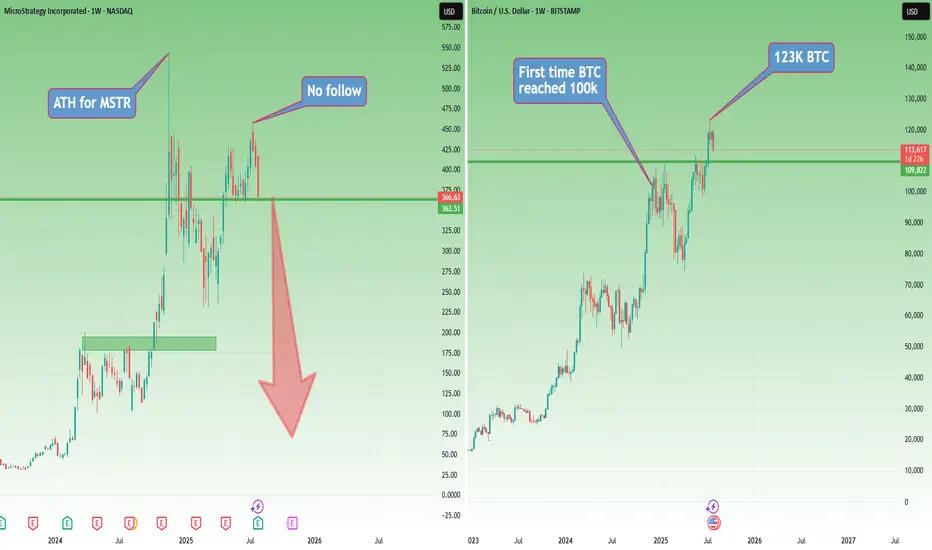
Strategy (MSTR) hit its all-time high in November 2024, right when Bitcoin first reached $100,000.
Then came a sharp correction of more than 50% for the stock.
Fast forward: even though Bitcoin went on to make new all-time highs, Strategy didn’t follow, it seems like people were finally starting to wake up.
When BTC peaked again in mid-July 2025, Strategy only managed to reach $455 — well below its November ATH.
Since then, BTC has pulled back about 10%, while Strategy dropped around 20%.
So much for the “outperformance” argument.
And here’s where things get even harder to justify:
In the past, some institutions bought MicroStrategy because they couldn’t hold Bitcoin directly. Fair enough.
But now? Spot Bitcoin ETFs are live, regulated, widely available, and charge tiny fees — without the leverage, dilution risk, or premium baked into Strategy.
So what’s the excuse now?
Where are we now?
At this moment, even though I’m not too happy about this week’s Bitcoin weakness, I remain cautiously bullish — emphasis on cautiously.
But let’s entertain a scenario.
If Bitcoin continues to correct, Strategy is sitting right on support. And if BTC breaks lower, Strategy will almost certainly follow — breaking support and heading toward the next level.
That next support? Somewhere around $240–250, depending on how deep the Bitcoin pullback goes.
But here’s the real question:
What happens if Bitcoin enters a true bear market?
Will Strategy — which just recently rebranded from MicroStrategy — be forced to rebrand again as…
NanoStrategy?
Just a Saturday thought.
XRP Path to 200XRP is so bullish.
Based on FIBS and Camarillas, this is a realistic path for the next 6 months to a year.
Gl hf.

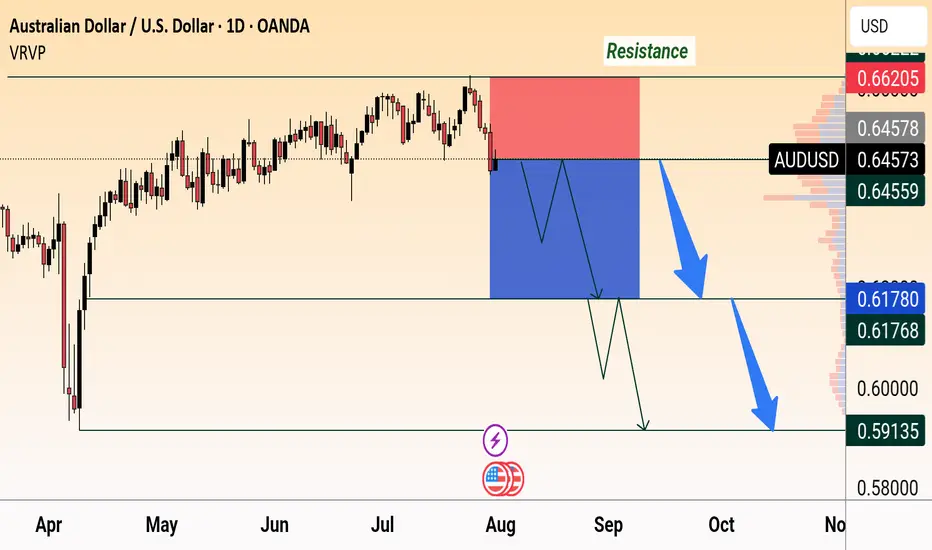
AUD/USD Bearish OutlookAUD/USD faces strong resistance at 0.6620 and is showing bearish momentum. Price is expected to drop below 0.6450 with targets near 0.6178 and 0.5913, following a possible consolidation.
USD/CAD Rises to 2-Month HighUSD/CAD Rises to 2-Month High
Today, the USD/CAD exchange rate briefly exceeded the 1.3870 mark – the highest level seen this summer. In less than ten days, the US dollar has strengthened by over 2% against the Canadian dollar.
Why Is USD/CAD Rising?
Given that both the Federal Reserve and the Bank of Canada left interest rates unchanged on Wednesday (as expected), the primary driver behind the pair’s recent rally appears to be US President Donald Trump's decision to impose tariffs on several countries – including Canada:
→ Despite efforts by Prime Minister of Canada Mark Carney to reach an agreement with Trump, no deal was achieved;
→ Canadian goods exported to the US will now be subject to a 35% tariff;
→ The tariffs take effect from 1 August;
→ Goods compliant with the United States-Mexico-Canada Agreement (USMCA) are exempt.
Media analysts note that the tariffs are likely to increase pressure on the Canadian economy, as approximately 75% of the country's exports are destined for the United States.
USD/CAD Technical Analysis
At the end of July, the price formed a steep ascending channel (A-B), with bullish momentum confirmed by a decisive breakout above the 1.3790 resistance level, as illustrated by the arrow:
→ the pullback before the breakout was relatively shallow;
→ the bullish breakout was marked by a long bullish candlestick with a close near the session high;
→ following the breakout, the price confidently consolidated above 1.3790.
Provided that the fundamental backdrop does not undergo a major shift, bulls might attempt to maintain control in the market. However, the likelihood of a correction is also increasing, as the RSI indicator has entered extreme overbought territory.
Should USD/CAD show signs of a correction after its steep ascent, support might be found at:
→ line C, drawn parallel to the A-B channel at a distance of its width;
→ the previously mentioned 1.3790 level, which now acts as a support following the breakout.
This article represents the opinion of the Companies operating under the FXOpen brand only. It is not to be construed as an offer, solicitation, or recommendation with respect to products and services provided by the Companies operating under the FXOpen brand, nor is it to be considered financial advice.

EURJPY Poised to test the top after the BOJ Rate DecisionEURJPY Poised to test the top after the BOJ Rate Decision
EURJPY broke out of a descending type of channel pattern or something similar.
The last two candles confirmed the bullish movement in a clear way and the odds are that EURJPY may rise further during the coming hours.
However this movement is also supported by BOJ Interst Rate decision.
BOJ kept rates unchanged at 0.5% as expected and they didn't change anything at all in their comments.
News - reported by forexlive
The Japanese Yen weakened across the board throughout BoJ Governor Ueda press conference. He sounded like someone who's not in a rush to hike rates at all. The two key lines were "monetary tightening effectively works on demand-driven inflation, but current inflation is largely supply-driven" and "current FX rate not diverging far from our assumptions".
He's basically saying that the current inflation is likely to be a one-off event and we all know how much weight they place on sustained inflation to durably hit their 2% target. And the comment about FX suggests that the depreciation in the JPY does not concern them at all, which gives the market the green light for further depreciation (all else being equal).
You may find more details in the chart!
Thank you and Good Luck!
PS: Please support with a like or comment if you find this analysis useful for your trading day
Disclosure: I am part of Trade Nation's Influencer program and receive a monthly fee for using their TradingView charts in my analysis.

EURO long: The "What If?" tradeHello traders
The Euro is showing signs of bottoming out at the weekly support levels against
USD, JPY, CAD and AUD.
MOST IMPORTANT:
USD:
While King Dollar is clearly reigning after the FOMC indication not to expect rate cuts any time soon and solid economic data, the "What If" factor is NFP tomorrow and to a minor extent month end settling. If the NFP print comes in significantly lower than expectations, the Euro may pop higher. If the print is above expectations, still take a moment to check where the most jobs are. if it is in hospitality and leisure, it is probably summer hiring.
JPY: The BoJ kept rates unchanged.
CAD: The loonie is under siege with Trump's renewed 35% tariffs announced today. However, IF Russian sanctions against oil sales come to fruition, the CAD may strengthen. Watch Oil prices.
AUD: CPI came in below expectations. PPI has just printed lower too.
The Euro Zone's unemployment rate ticked down and German CPI ticked higher. The impact of tariffs seems to be priced in for the moment.
The biggest "What If" ?
The decision of the Federal Appeals Court if the International Trade Court verdict is upheld. In that case, it is all but guaranteed that it will reach the Supreme Court. IF the Supreme Court declares it unlawful, the USD MAY drop like a lead balloon.
The risk assets in these charts are all at right around the weekly 20 SMA.
www.tradingview.com
Just some food for thought. Let me know what your thoughts are.

CRCL WEEKLY TRADE SIGNAL (JULY 31)
### 🚨 CRCL WEEKLY TRADE SIGNAL (JULY 31) 🚨
**Call Option Setup – Based on Multi-Model Consensus**
📈 **Momentum**:
🟡 RSI Daily: 46.7 (Neutral)
🟥 Volume: 0.4x last week = 🚨 Weak participation
🟢 Options Flow: Bullish (C/P Ratio = 1.42)
🌤️ VIX: Low (15.4) → Low volatility = 💰 opportunity
🔍 **Model Summary**:
✅ **Grok**: Bullish setup → RECOMMENDED TRADE
❌ Claude, DeepSeek, Gemini, Llama: No trade (weak volume + gamma risk)
🤝 ALL agree: Weak volume & mixed trend = caution
---
### 💥 Trade Setup 💥
🎯 **Direction**: CALL (Bullish bias)
💸 **Strike**: \$200
💰 **Entry**: \$0.85
📆 **Expiry**: Aug 1 (1DTE – high gamma 🔥)
🎯 **Profit Target**: \$1.11
🛑 **Stop Loss**: \$0.51
📊 **Confidence Level**: 65%
📍 **Entry Timing**: Market Open
---
### 🧠 Key Insight
📉 Weak volume = 🚫 no institutional conviction
📈 Bullish options flow = 🔥 potential short squeeze
🕓 Time-sensitive 1DTE = Fast hands needed!
---
👉 If you trade momentum, watch CRCL at open.
🧠 **Strategy**: scalp the move or exit near \$1.11
💥 High risk, high gamma, tight leash.
\#OptionsFlow #CRCL #CallOption #TradingSignal #UnusualOptionsActivity #0DTE #GammaScalp #TradingView #SwingTrade #TFlow

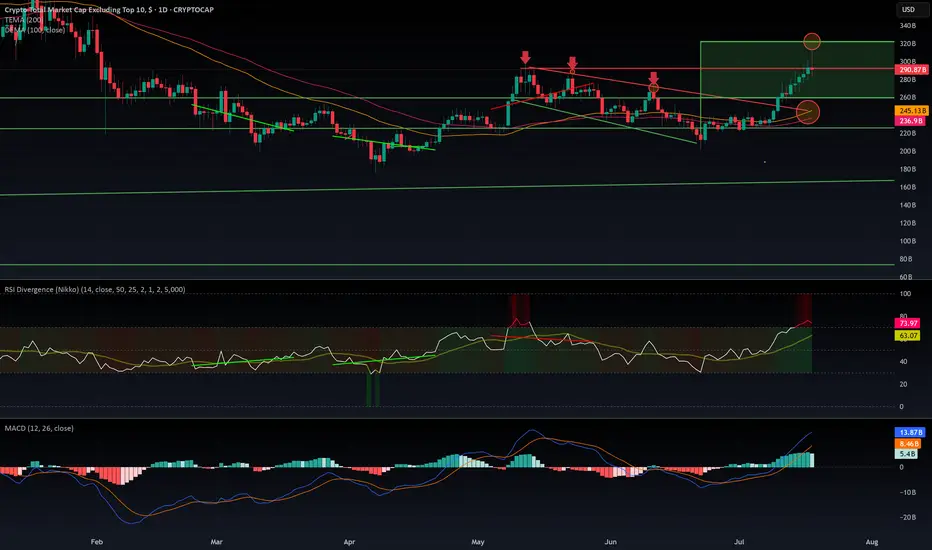
$OTHERS rejected from $320 B resistance. What is next?CRYPTOCAP:OTHERS Rejected at $320B: Is the Altseason on Pause?
CRYPTOCAP:OTHERS just got rejected at the $320B resistance after a decent pump — the kind that usually signals the start of an altseason. But if we dig into the indicators, warning signs are flashing:
- MACD is sitting in overbought territory.
- RSI is heavily extended, signaling potential exhaustion.
- EMA 100 & 200 are colliding with the top of a previous downtrend channel — a zone that historically acted as strong resistance.
The rejection was sharp. So what's next? Are we entering a range between $320B and $260B? It's quite possible. The aIf you wantltcoin market now sits at a decision point: either it keeps pushing higher or takes a breather — potentially pausing the rally until September.
Historically, August is a slow month in the West. People go on vacation, volumes drop, and markets tend to cool off. This seasonal pattern supports the idea of a consolidation phase before a stronger second leg of altseason kicks off in mid-September and carries into Q4.
I’m not posting too many ideas lately because the market landscape has changed. The new players aren’t just trading — they’re manipulating flows with massive capital to hunt retail liquidity.
They’re also using far more sophisticated tools than our classic MACD and RSI — including AI-powered indicators and multi-layered analytics that are beyond retail reach.
In this new environment, predictions are harder and risk is higher.
🧠 Do Your Own Research (DYOR), stay sharp, and don’t blindly trust social influencers.
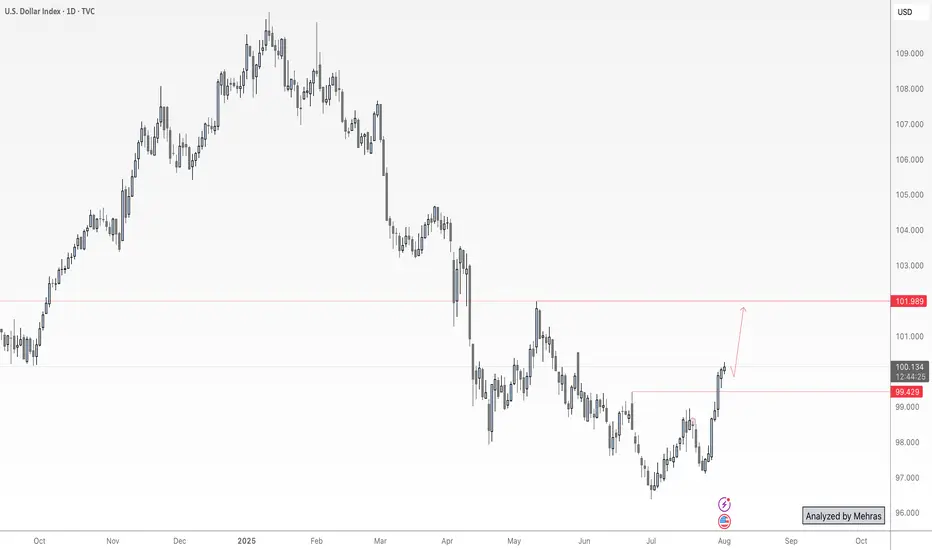
NFP Volatility Ahead – Is the Dollar Ready to Break Higher?🟢 DXY Outlook – A Key Day for the Dollar Index
Yesterday’s monthly candle closed with strong bullish momentum, marking a powerful start to August. Today, on the first trading day of the month, we’re expecting three major U.S. economic releases:
NFP, Average Hourly Earnings (m/m), and the Unemployment Rate.
As discussed in last week’s outlook, DXY has successfully broken above the key 100 level and confirmed a monthly close above it — a significant technical development. With no major order blocks or visible resistance in the way, the path toward the 102 target appears technically clear.
That said, I anticipate mixed data from today’s releases — which means we could see both sides of liquidity being taken during the initial reaction. Price might dip toward lower zones temporarily to collect liquidity before resuming its bullish move toward 102.
📌 In summary:
From a swing perspective, I believe the direction remains bullish for the Dollar Index as long as we hold above the 100 level.
When I say the data might be “mixed,” I mean the market could show an initial drop toward lower zones at the time of release — not because of a reversal, but to grab liquidity before continuing higher toward the 102 target.
Unless we see something unexpectedly extreme in the numbers, I expect the DXY to remain on track to reach the 102 level in the coming days or next week.
🔁 This analysis will be updated whenever necessary.
Disclaimer: This is not financial advice. Just my personal opinion.
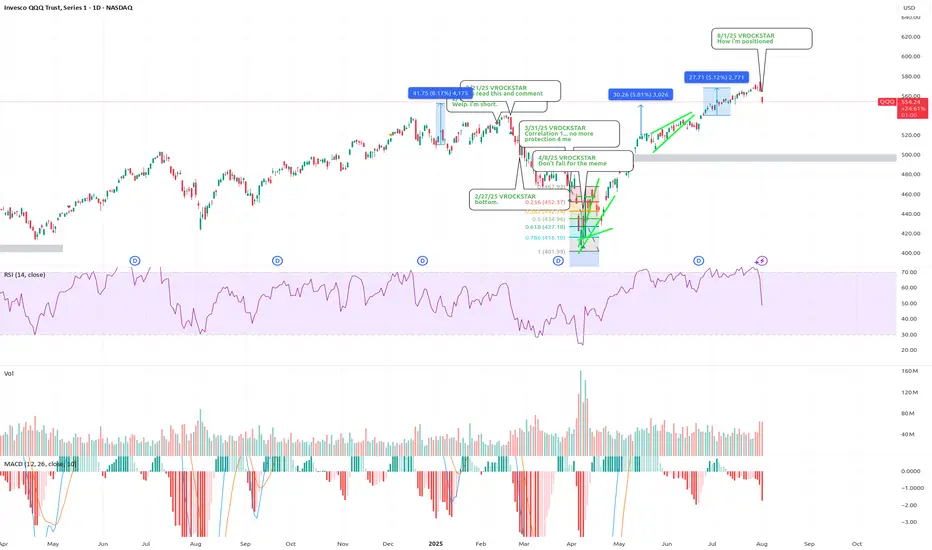
8/1/25 - $qqq - How i'm positioned 8/1/25 :: VROCKSTAR :: NASDAQ:QQQ
How i'm positioned
- 2x leverage on the whole book. 75% at risk so 150% gross
- so 25% powder
47% obtc
30% nxt (12.5% leaps)
36% deck (ST and leaps for 6.5%)
27% lulu (ST gas for 1% lol!)
8% mstr (ST gas for 80 bps lol!)
5% gme (ST gas for 40 bps!)
5% ses (covered with calls at 1 strike already)
be well. let's attack monday.
if we dip monday i think >50% chance that's the low
if we don't, i think >30% chance we go higher
so i'm bidding this selectively w balance of ST gas and high conviction plays.
V
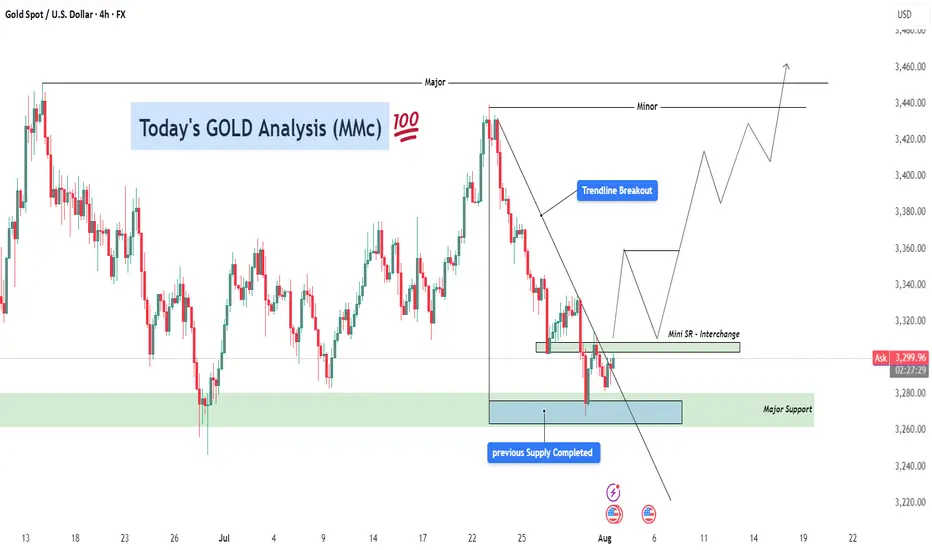
GOLD Analysis – Bullish Recovery Setup After Trendline Breakout ⚙️ Technical Structure Overview
This 4-hour chart of Gold (XAUUSD) illustrates a classic reversal setup developing after a significant correction. Price previously faced strong selling pressure from the 3,470+ zone and declined sharply. However, the recent price action suggests a shift in control from sellers to buyers, signaling a likely medium-term trend reversal or a bullish wave formation.
The key to this setup lies in three confluences:
Completion of a previous supply zone, which no longer holds influence.
Aggressive buyer activity from a major support zone.
A clean break above the descending trendline, which is a common signal that bearish momentum is losing strength.
🔑 Key Levels & Concepts Explained
🟢 1. Major Support Zone (3,260–3,280)
This zone has been tested multiple times and each time, buyers stepped in and prevented further downside. The most recent rejection from this area shows long wicks and bullish engulfing candles, indicating accumulation by institutional players. This is the foundational support that has held the entire corrective structure.
📉 2. Trendline Breakout
The descending trendline connecting swing highs has now been broken to the upside. This is a critical technical signal, especially on the 4H timeframe, as it suggests a potential trend reversal or at least a deep retracement in the opposite direction.
Trendline breakouts typically result in a retest of the trendline or a nearby support-turned-resistance zone (as is the case here with the Mini SR level).
It also implies that supply is weakening, and buyers are ready to push.
🧱 3. Mini Support/Resistance Interchange (~3,300–3,320)
This zone now plays the role of an interchange level—a previous minor resistance that could act as a support after the breakout. This level is crucial for intraday and swing traders because it can offer a low-risk long entry if price retests and confirms it with bullish momentum.
The chart projection suggests a bounce off this mini S/R, followed by successive higher highs and higher lows, forming a new bullish structure.
📈 Forecast Path & Trade Scenario
✅ Bullish Path (Preferred MMC Scenario)
Stage 1: Price retests the 3,300–3,320 zone (Mini S/R).
Stage 2: Buyers step in, leading to a bullish continuation.
Stage 3: Price targets the Minor Resistance (~3,440).
Stage 4: If momentum is sustained, it aims for Major Resistance (~3,470–3,480), completing a clean reversal formation.
This path reflects perfect bullish market structure—a breakout, followed by a retest and rally.
❌ Bearish Invalidation
If the price closes strongly below 3,260, the structure would be invalidated.
This would suggest that the support zone failed, possibly triggering deeper downside toward 3,220–3,200.
🧠 MMC Trader Mindset & Risk Considerations
Don’t Chase: Wait for a confirmed retest of the Mini S/R zone. Let the market come to your entry.
Entry Confirmation: Use candlestick signals like bullish engulfing, pin bars, or inside bars near the Mini S/R.
Volume Consideration: Volume should ideally rise on breakout legs and decline on pullbacks—this confirms healthy bullish structure.
Risk-Reward: With a stop below 3,260 and targets toward 3,470, the RR ratio favors long entries, especially after confirmation.
🔁 Summary Plan for Execution
Entry Zone: 3,300–3,320 (after bullish confirmation)
Stop Loss: Below 3,260 (structure break)
Take Profit 1: 3,440
Take Profit 2: 3,470–3,480
Risk-to-Reward: 1:2+ if planned carefully
8/1/25 - $mstr - Selling spot and buying MSTR8/1/25 :: VROCKSTAR :: NASDAQ:MSTR
Selling spot and buying MSTR
- keeping it (purposefully) short today for everyone's benefit
- sold a bit of OTC:OBTC (which is nearly 15% off spot, e.g. $100k/BTC) to buy NASDAQ:MSTR MSD exposure here
- why?
- 1.6x mNAV is lowest it's been (nearly ever in current BTC move)
- Saylor not going to hit the ATM sub 2.5x, will run it hot
- Latest product further augments this runway to value accretion
- BTC still remains REALLY well bid in this current tape
- So math is like this
- ROE of BTC in "conservative" sense is 25%
- Kc (cost of capital) for Strategy is 10% again (conservative, it's really sub 10%)
- so ROE/Kc (without growth) = 2.5x book.
- A real ROE for BTC (remember this is permanent capital he's tapping, so no asset-liability mis-match) is 35%
- True Kc for this is sub 10%, but let's still say 10%. that's 3.5x book.
Therefore let's even say 2x book (below both of the above) is 2/1.6 = 25% upside. If/do you think that BTC can go back to low 90s, ofc this might contract further (the 1.6x) but at the same time, you have EVEN higher implied ROE and R/R only improves.
So at a minimum, i'd guess your R/R is "balanced" here in the most conservative scenarios. And if we do get BTC bid, this will rocket at this stage thru YE and far exceed px appreciation of it's BTC pair.
Ok that was longer than I intended. Felt important to convey math and up/downside parameters.
Be well. Everyone loses money in correlation 1. Just make sure you find the betas that have the first bids. Right now that's BTC and some quality names doing 6-7% fcf yields and growing.
I like
OTC:OBTC (adding fuel w/ my NASDAQ:MSTR calls)
NASDAQ:NXT
NYSE:DECK
NASDAQ:LULU
NYSE:FI
<3
V

XAUUSD H4 Update – The Battle Has Moved to 3350
“From deep demand to key supply. The next move is decisive.”
🔸 Sunday Plan Recap
Price was falling aggressively into the HTF demand zone (3265–3240).
The plan anticipated a bounce only if that deep zone held.
Above price, major zones included:
3314 – mid-structure
3330–3345 – supply zone
3368–3380 – final retracement targets
🔸 What Changed?
✅ The deep demand zone worked — H4 CHoCH bullish was confirmed.
✅ Price climbed through 3285 and 3314, confirming a retracement leg.
🔥 Now, price sits at 3349.57, testing the same supply zone marked in Sunday’s plan (3330–3345).
🔸 Current H4 Structure
🔼 Short-term bias = bullish retracement
📍 Price = inside HTF premium zone
📈 EMAs aligned bullish (5/21/50), confirming short-term momentum
💡 RSI = approaching overbought
⚔️ Liquidity above 3355, trapped shorts below 3314
🧠 Today’s Battle Plan (August 1)
🔴 Sell Zone (live) – 3345 to 3355
Price just entered the key H4 supply zone. Watch for rejection signs:
Bearish confirmation needed (e.g. M15/M30 CHoCH or engulfing)
If confirmed → downside targets: 3314 → 3285 → 3265
High RR short only if structure confirms
🔵 Breakout Bullish Case
If 3355 breaks with a clean body + HL at 3340 → bullish continuation active
Next upside target: 3368 → 3380
🧭 Final Thoughts
We’ve reached the exact decision zone from Sunday’s plan.
The market will now reveal: retracement over... or breakout coming?
Patience is key — this is a high RR zone, but only if structure reacts.
💬 Did you catch the move from deep demand? Or waiting for confirmation here at supply?
📈 Share your thoughts in the comments and let’s break it down together.
🔔 Follow for real-time market insights, sniper plans, and structured trading logic you can trust.
❤️ Like if you enjoy clean, actionable updates🚀🚀🚀
🔁 Share with traders who love structure over noise
📉 Price data from Trade Nation feed

EURUSD Down Trend As dxy is bullish Eurusd will be bearish. I need price to go to my eyeing level in the next couple weeks. we wait and see what price we want to do next week, Wednesday.

SOLANA BULLISH MEGAPHONE PATTERN LOADING! solana continues to move step by step towards higher levels within the bullish megaphone pattern, which will make movements towards ATH and more inevitable in the coming period

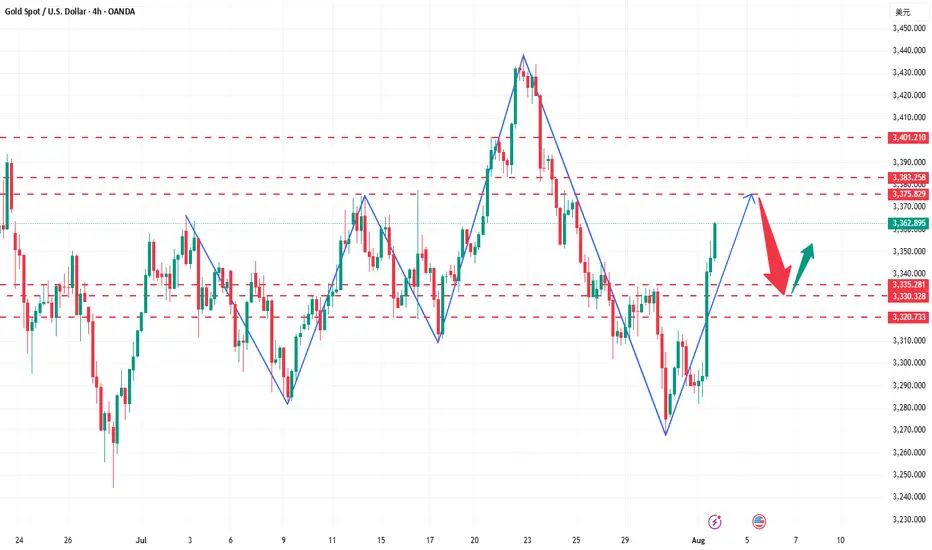
The trend is clear, why do I choose to be firmly bullish on goldGold Trend Analysis: Yesterday, the gold market demonstrated strong upward momentum, opening near 3290 before falling slightly to a low of 3281 before fluctuating upward. Boosted by the non-farm payroll data, the gold market surged during the US trading session, reaching a single-day gain of 2.02%, reaching a high of 3363 and closing there. The daily chart formed a long bullish candlestick with a long lower shadow, forming a Morning Star pattern, reinforcing the bullish trend. From the perspective of the cycle structure, the daily level is clearly in the 5-wave upward stage, and the upward trend of the large cycle has not changed. At the indicator level, the daily MACD momentum column (the column below the zero axis) represents the short-selling momentum. Its "gradual shortening" means that the short-selling force is weakening and the downward momentum is gradually fading. It is a potential signal of stopping the decline or rebounding. KDJ is about to form a golden cross between 20-50, which is a signal that short-term bullish power is beginning to increase, and the overall trend is bullish.
The 4-hour level shows typical bullish characteristics: the moving average system is arranged in a bullish pattern, but there is a certain deviation between the short-term price and the moving average. The technical side needs to correct the deviation rate through a callback before continuing to rise. The short-term support below is focused on the line near 3330-3335. This position is both the relay support level in the previous rise and the intersection of the 4-hour moving averages MA10 and MA20, which has strong support strength; the short-term resistance above is focused on the line near 3370-3383. This area is a pressure-intensive area near the previous high point. If it can be effectively broken through, it will further open up upward space. A successful breakout would open up further upside potential. A breakout would further open up the 3400 mark.
For gold trading, the short-term strategy is to buy on dips. If the price pulls back to the 3330-3335 support level, consider entering a long position with a target of 3355-3365. If it reaches 3370-3380, consider a short-term short position with a target of 3350-3340.