TradeCityPro | EURCHF Analysis Rejection or Breakout?👋 Welcome to the TradeCityPro channel!
Let’s analyze this forex pair in a simple way and set triggers and alerts to prepare for potential trades.
🌍 Fundamental Overview
Euro (EUR):
Backed by the ECB's cautious stance on inflation, though mixed economic data, like declining industrial output, limits its strength.
Swiss Franc (CHF):
Strong as a safe-haven currency, bolstered by geopolitical risks. The SNB maintains a hawkish monetary policy to ensure inflation stability.
The monetary policy divergence between the ECB's mild tightening and the SNB's hawkish approach adds bearish pressure on EURCHF, favoring CHF during risk-off sentiment.
⏱ 4-Hour Timeframe
The chart remains strongly bearish, with prices near historic lows, lacking significant support ahead. Fibonacci levels can help identify potential 4H supports.
📉 Short Position Trigger:
After a rejection from the trendline, watch for a move towards the 0.92790 support.
If 0.92790 breaks with momentum, short positions can target: 0.92440 - 0.92187 - 0.91866
📈 Long Position Trigger:
While the chart shows bearish dominance, signs of trend weakness are emerging. However, long trades remain high risk in the current environment.
potential long setup could occur after breaking the trendline and the 0.9335 resistance.
For safer entries, wait for higher highs and higher lows to form, confirming a bullish shift before taking action.
📝 Final Thoughts
Stay calm, trade wisely, and let's capture the market's best opportunities!
This analysis reflects our opinions and is not financial advice.
Share your thoughts in the comments, and don’t forget to share this analysis with your friends! ❤️
Fundamental-analysis

Easyjet ready to fly?Easyjet records better financial statements, looking at the report is possible to read that LSE:EZJ flew about 5% increase in seats when compared with last year.
The revenue increased by 14% this mainly because of the increase of 8% in capacity. Looking over the financial indicator it's noticeable an increase in revenue and the difference compared to 13 week moving average.
The price breakout for the second time above the top of ascending triangle following for a cross over the 200ema. The yellow resistance is the strongest one that still needs to be broken.
ADX is already above DMI- and being at 19,49 can show some strength confirming the DMI+.
EFI barely dropped below zero when the price failed to cross the EMA changing direction above zero rapidly.

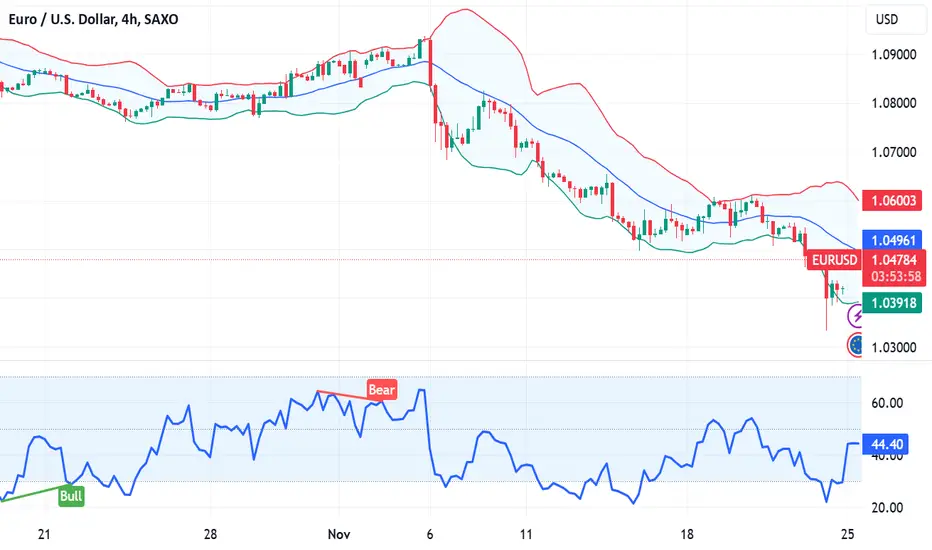
Fundamental Market Analysis for November 28, 2024 EURUSDEUR/USD was supported in the market on Wednesday, taking the pair on a new course towards 1.0600 in the middle of the weekly trading session. The bullish bounce in the market was mainly due to investors taking a step away from recent dollar buying pressure, rather than any intrinsic strength in the euro itself.
Wednesday's data list included a wide range of U.S. economic indicators before stock exchanges close for the Thanksgiving holiday on Thursday, followed by shortened trading hours on Friday. U.S. gross domestic product (GDP) rose by an expected 2.8% on an annualized basis in the third quarter, coming as a surprise to no one and having little impact on investor momentum. The core Personal Consumption Expenditures Price Index (PCEPI) accelerated to 2.8% for the year ended October, also meeting expectations. While rising inflation readings are usually bad for market expectations for future rate cuts, the upward movement was widely expected, and the monthly reading's persistence at 0.3% m/m helped to portray that the surge in prices was a thing of the past.
On Friday, traders will be eyeing preliminary European Union inflation data, the harmonized consumer price index (HICP). EU inflation is forecast to rise in the near term, further aggravating the European Central Bank (ECB) as ECB policymakers struggle to find the words to maintain investor confidence in the lopsided European economy.
Trade recommendation: Watching the level of 1.0600, trading mainly with Sell orders

Bullish Long for DJTDJT's tremendous buying volume today pushed the stock price to $32.17 (+18.43%). A golden cross formed on the hourly chart on October 8th, and if DJT keeps its bullish momentum, a golden cross will likely form on the 4-hour chart in the next few days. The weekly chart shows that October holds the strongest buying volume for the year. This should help DJT play at a higher value.
Fundamental Analysis—The surge is likely due to interest and support for Trump's upcoming presidency. This is what happened in March 2024. DJT's value rose due to the loyal base of Trump supporters. Analysts labeled DJT as a meme stock, trading more on social media buzz than traditional financial metrics. Knowing these fundamental analytics, I believe DJT will find great value and performance depending on a Trump victory.

CADCHF_LONG OPPORTUNITYCADCHF can give a Long Opportunity by looking into the factors mentioned in the chart on Fundamental & Technical basis.

Sell AUD/CAD Triangle BreakoutThe AUD/CAD pair on the M30 timeframe presents a Potential Selling Opportunity due to a recent breakout from a Triangle Pattern. This suggests a shift in momentum towards the downside in the coming hours.
Possible Short Trade:
Entry: Consider Entering A Short Position Below the Broken Trendline Of The Triangle After Confirmation. Ideally, This Would Be Around 0.9104
Target Levels:
1st Support – 0.9060
2nd Support – 0.9032
Your likes and comments are incredibly motivating and will encourage me to share more analysis with you.
Best Regards, KABHI FOREX TRADING
Thank you.

GBPNZD_SHORT OPPORTUNITYGBPNZD will show a Bearish Trend based upon the factors mentioned in the chart on Technical and Fundamental basis.

TradeCityPro | AUDUSD Analysis Preparing for Movement👋 Welcome to the TradeCityPro channel!
Let’s examine the key triggers for AUDUSD, which appears poised for an interesting move.
🌍 Fundamental Overview:
Supported by stable commodity prices, especially iron ore, a key driver of Australia's economy.
Recent Reserve Bank of Australia (RBA) comments suggest a balanced stance with no immediate rate hikes.
Bolstered by strong economic data and expectations of prolonged higher interest rates by the Federal Reserve.
Mixed global risk sentiment keeps the USD favored as a safe-haven currency.
⏱ 4-Hour Timeframe
AUDUSD has been in a long-term downtrend, losing multiple supports and forming successive lower highs and lows. However, the price has recently stabilized, ranging between 0.64501 and 0.65412.
📉 Short Position Trigger:
After breaking the 0.64501 support, initiate a short trade targeting 0.62910.
📈 Long Position Trigger:
In case of a false breakdown of the support or prolonged consolidation within the range, open a riskier long trade above 0.65412 , Safer long entries can be considered once higher highs and lows are confirmed.
📝 Final Thoughts
This analysis reflects our opinions and is not financial advice.
Share your thoughts in the comments, and don’t forget to share this analysis with your friends! ❤️

NZDJPY_LONG OPPORTUNITYNZDJPY is showing Bullish Bias based upon the factors mentioned in the chart Fundamentally & Technically.

USD/JPY - H4 - Channel Breakout The USD/JPY pair on the H4 timeframe presents a potential selling opportunity due to a recent downward breakout from a well-defined Channel Breakout pattern. This suggests a shift in momentum towards the downside in the coming Days.
USDJPY
Key Points:
Sell Entry: Consider entering a short position around the current price of 154.00, positioned close to the breakout level. This offers an entry point near the perceived shift in momentum.
Target Levels:
1st Support – 151.30
2nd Support – 149.82
Your likes and comments are incredibly motivating and will encourage me to share more analysis with you.
Best Regards, KABHI FOREX TRADING
Thank you.

Fundamental Market Analysis for November 27, 2024 USDJPYThe Japanese Yen (JPY) continues to attract some safe haven flows amid tariff threats from US President-elect Donald Trump. In addition, the recent pullback in US Treasury yields following the appointment of Scott Bessent as US Treasury Secretary and expectations that he will rein in the budget deficit provides further support for the low-yielding JPY. This, along with weak US Dollar (USD) price action, led the USD/JPY pair to fall to a near three-week low around 152.700-152.650 during Wednesday's Asian session.
Nevertheless, uncertainty surrounding the Bank of Japan's (BoJ) next interest rate hike in December may deter traders from aggressively bullish bets on JPY. Meanwhile, easing geopolitical tensions amid a ceasefire agreement between Israel and Hezbollah may help limit the safe-haven JPY's gains. On the other hand, the US Dollar is likely to receive support from bets on slower interest rate cuts by the Federal Reserve (Fed), which could provide some support to the USD/JPY pair ahead of key US macroeconomic data released later today.
Trading recommendation: Trade predominantly with Sell orders from the current price level.

Sell EUR/JPY Bearish ChannelThe EUR/JPY pair on the M30 timeframe presents a Potential Selling Opportunity due to a recent breakout from a Triangle Pattern. This suggests a shift in momentum towards the downside in the coming hours.
Possible Short Trade:
Entry: Consider Entering A Short Position Below the Broken Trendline Of The Triangle After Confirmation. Ideally, This Would Be Around 161.15
Target Levels:
1st Support – 159.88
2nd Support – 158.91
Your likes and comments are incredibly motivating and will encourage me to share more analysis with you.
Best Regards, KABHI FOREX TRADING
Thank you.

GBP/USD - H1 - Broadening Wedge The GBP/USD pair on the H1 timeframe presents a potential selling opportunity due to a recent formation of well-defined Broadening Wedge pattern. This suggests a shift in momentum towards the downside in the coming Hours.
Key Points:
Sell Entry: Consider entering a short position around the current price of 1.2532, positioned close to the breakout level. This offers an entry point near the perceived shift in momentum.
Target Levels:
1st Support – 1.2442
2nd Support – 1.2375
Your likes and comments are incredibly motivating and will encourage me to share more analysis with you.
Best Regards, KABHI FOREX TRADING
Thank you.

BTC/USDT - Rising Wedge Breakout - H4 ChartThe BTC/USDT pair on the H4 timeframe presents a Potential Selling Opportunity due to a recent breakout from a Rising Wedge Pattern. This suggests a shift in momentum towards the downside in the coming Days. BINANCE:BTCUSD
Possible Short Trade:
Entry: Consider Entering A Short Position Below the Broken Trendline Of The Triangle After Confirmation. Ideally, This Would Be Around 93,400
Target Levels:
1st Support – 84,600
2nd Support - 78,210
Your likes and comments are incredibly motivating and will encourage me to share more analysis with you.
Best Regards, KABHI FOREX TRADING
Thank you.

DOGE/USDT - Rising Wedge Breakout - H4 ChartThe DOGE/USDT pair on the H4 timeframe presents a Potential Selling Opportunity due to a recent breakout from a Rising Wedge Pattern. This suggests a shift in momentum towards the downside in the coming Days.
Possible Short Trade:
Entry: Consider Entering A Short Position Below the Broken Trendline Of The Triangle After Confirmation. Ideally, This Would Be Around 0.3910
Target Levels:
1st Support – 0.3188
Your likes and comments are incredibly motivating and will encourage me to share more analysis with you.
Best Regards, KABHI FOREX TRADING
Thank you.

TradeCityPro | GBPNZD Analysis Ready to Move👋 Welcome to the TradeCityPro channel!
Let's start this week's market by analyzing the GBPNZD pair for potential triggers in futures. We'll keep it concise!
🌍 Fundamental Overview
GBP: The British pound remains under pressure due to persistent economic slowdown and uncertainty around the Bank of England's policy, with inflation softening but still above target.
NZD: The New Zealand dollar is supported by stronger commodity demand and recent hawkish signals from the Reserve Bank of New Zealand (RBNZ), which is holding interest rates steady but remains cautious of global economic conditions.
Result: Diverging monetary outlooks and commodity trends make GBPNZD sensitive to risk sentiment and trade flow shifts.
📊 Weekly Timeframe
In the weekly timeframe, like most currency pairs, we are in a range but have broken the lower box and are now ranging in a higher box.
Additionally, the chart shows a curve-like upward movement, forming higher lows, indicating an uptrend, but recently, the trend has significantly weakened, and the candlesticks are getting smaller.
If the curve line breaks, the price can move to 2.10640.
If the curve supports, the price may head towards 2.16990 and possibly break this significant resistance.
⏱ 4-Hour Timeframe
In the 4-hour timeframe, there is a descending trendline, forming lower highs and creating compression.
📉 Short Position Trigger:
Triggered by rejection from the trendline or a break of the 2.14309 support level, targeting 2.12359.
📈 Long Position Trigger:
Triggered by a breakout above the trendline and 2.15606, targeting 2.18194.
📝 Final Thoughts
This analysis reflects our opinions and is not financial advice.
Share your thoughts in the comments, and don’t forget to share this analysis with your friends! ❤️

Fundamental Market Analysis for November 25, 2024 EURUSDThe US Dollar may strengthen as the latest US PMI data reinforces the likelihood that the Fed will slow the pace of rate cuts.
The Euro faced challenges as the latest HCOB PMI data pointed to continued weakness in Eurozone business activity.
EUR/USD recovered from the two-year low of 1.0332 recorded on Friday and traded near 1.0480 during Monday's Asian session. The rebound could be attributed to a correction in the US Dollar (USD) despite strong preliminary S&P Global US Purchasing Managers' Index (PMI) data released in the previous session.
Meanwhile, the US Dollar Index (DXY), which tracks the performance of the USD against six major currencies, slipped to 107.00 after hitting a two-year high of 108.07 on Friday. However, downside risks to the U.S. dollar remain limited as recent economic data has reinforced expectations that the Federal Reserve (Fed) may slow the pace of rate cuts.
The S&P Global US PMI composite index rose to 55.3 in November, indicating the strongest growth in private sector activity since April 2022. The US Services PMI rose to 57.0 from 55.0 in October and well above market expectations of 55.2, marking the sharpest growth in the services sector since March 2022. Meanwhile, the US manufacturing PMI rose to 48.8 from 48.5 in October, matching market forecasts.
Trade recommendation: Watch the level of 1.0480, when fixing below consider Sell positions, when rebounding consider Buy positions.
Sell TURBO/USDT Triangle Breakout in H4The TURBO/USDT pair on the H4 timeframe presents a Potential Selling Opportunity due to a recent breakout from a Triangle Pattern. This suggests a shift in momentum towards the downside in the coming Days. BINANCE:TURBOUSDT
Possible Short Trade:
Entry: Consider Entering A Short Position Below the Broken Trendline Of The Triangle After Confirmation. Ideally, This Would Be Around 0.0081
Target Levels:
1st Support – 0.0047
2nd Support – 0.0023
Your likes and comments are incredibly motivating and will encourage me to share more analysis with you.
Best Regards, KABHI FOREX TRADING
Thank you.

EURUSD SHORT: USA SERVICE PMI CAME IN HIGHER THAN EXPECTEDS&P global Services PMI 57.0 versus 55.2 estimates. Looking to short this pair.

GBPUSD SHORT: USA SERVICES PMI HIGHER THAN EXPECTEDS&P global Services PMI 57.0 versus 55.2 estimates. Looking to short this pair.

SHOCKING! 40% tariffs on Chinese imports!According to a survey of economists by Reuters, the U.S. is considering imposing nearly 40% tariffs on Chinese imports early next year. Such measures could slow the growth of the world’s second-largest economy by 1%. Economists polled by the publication, both Democrats and Republicans, believe these changes will trigger massive disruptions in the U.S. and global economies, surpassing the impact of the trade wars during Trump’s first term. They warn this could ignite a “global trade war.”
During his presidential campaign, Donald Trump promised significant tariffs on Chinese goods as part of his “America First” trade policy. These potential tariffs, much higher than the 7.5%-25% rates of his first term, come at a vulnerable time for China’s economy, which is grappling with a prolonged real estate slump, debt risks, and weak domestic demand. Most economists predict Trump will impose the tariffs in early 2025, with an average estimate of 38% and projections ranging from 15% to 60%. These tariffs are expected to reduce China’s economic growth in 2025 by about 0.5-1.0 percentage points.
What could Trump’s policy lead to?
Chinese indexes: Chinese stock indexes like #ChinaA50 and the Hang Seng Index (#HSI) are expected to face downward pressure.
Chinese corporations: Key sectors such as electronics, automotive, and textiles—heavily reliant on exports to the U.S.—are likely to suffer the most. Major Chinese corporations, including #Alibaba and other leading players, could see their stock values decline. U.S. Indexes: American indexes like #SP500 and Dow Jones (#DJI30) might experience short-term volatility. Tariffs will raise costs for U.S. companies dependent on Chinese supplies, such as those in tech, automotive, and consumer goods sectors—companies like #Apple, #Tesla, and #Nike may face increased production costs. This could reduce profitability and potentially lead to stock corrections.
In the long term, however, the U.S. might benefit from the trade war, as it could boost domestic production, positively impacting American manufacturing stocks. FreshForex analysts predict a growth phase to begin in late Q1 2025 . At the same time, on November 14, investors sharply increased short positions in Asian currencies following Trump’s tariff announcements.

Sell GBP/CHF Bearish ChannelThe GBP/CHF pair on the H1 timeframe presents a potential selling opportunity due to a recent downward breakout from a well-defined Bearish Flag pattern. This suggests a shift in momentum towards the downside in the coming Hours.
Key Points:
Sell Entry: Consider entering a short position around the current price of 1.1186, positioned close to the breakout level. This offers an entry point near the perceived shift in momentum.
Target Levels:
1st Support – 1.1110
2nd Support – 1.1072
Your likes and comments are incredibly motivating and will encourage me to share more analysis with you.
Best Regards, KABHI FOREX TRADING
Thank you.

