xauusddaily support break with strong bounce from 2350, price respected beautifully as accepted. as we look at the chart we still have the short position 2400, with fvg around 2404 to 2408.
coming next week will be the what market will de. if break solid above 2400 on daily candlle then price may continue rising till 2500 or above then fall.
tet me know what is your opinion. comment below.
Fundamental-analysis
USDCADhere it is price has squeezed to the upside
let's wait for confirmation and we will place the trede.

Fundamental Market Analysis for July 26, 2024 EURUSDThe Euro-dollar pair is trading near 1.08600 during the Asian session on Friday, continuing to rise after rebounding from the two-week low of 1.08250 recorded on Wednesday. The rise in EUR/USD is attributed to a weaker US Dollar (USD) ahead of the release of the US Personal Consumption Expenditure (PCE) price index for June.
However, the US Dollar may limit its decline as stronger US economic data has reduced some expectations of a rate cut in September. On Thursday, US gross domestic product (GDP) for the second quarter (Q2) came in stronger than expected. This followed the US PMI data released on Wednesday, which pointed to an acceleration in private sector activity in July, indicating that growth in the US is resilient despite higher interest rates.
US GDP rose 2.8% on a seasonally adjusted and inflation-adjusted annualized basis from the previous reading of 1.4% and beat forecasts of 2%. In addition, the composite PMI rose to 55.0 from a previous reading of 54.8, the highest reading since April 2022 and indicative of steady growth over the past 18 months.
The Euro struggled as the European Central Bank's (ECB) near-term outlook remains uncertain due to strong expectations of additional rate cuts. The ECB is expected to cut interest rates two more times this year as price pressures are expected to remain at current levels for a year and only return to the bank's target level in 2025.
Trading recommendation: Trade predominantly with Buy orders from the current price level.

Market Overview Part 31 Me Going Over How I Trade With My Robin Trap Strategy In Deep Detail With How I use Market Structure And Multiple Timeframes!

Buy EUR/JPY Head & Shoulder PatternThe EUR/JPY pair on the M30 timeframe presents a potential Buying opportunity due to formation Head & Shoulder pattern. This suggests a shift in momentum towards the Upside in the coming Hours.
Key Points:
Buy Entry: Consider entering a Long position around the current price of 167.12. This offers an entry point near the perceived shift in momentum.
Target Levels:
1st Support – 169.38
2nd Support – 171.10
Stop-Loss: To manage risk, place a stop-loss order below 164.60. This helps limit potential losses if the price unexpectedly reverses and breaks back upwards.
Your likes and comments are incredibly motivating and will encourage me to share more analysis with you.
Best Regards, KABHI FOREX TRADING
Thank you.

Collecting Rollover while the TRY RangesThe CBRT has raised rates from 8.5% in June 2023 to currently standing at 50%. There was a recent CBRT meeting where rates where held at 50%. There has been a roll coaster for inflation YoY which was below 20% in 2020, rose as high as 36% in 2021, pushed up to 85.50% in 2022, dropped in 2023 to around 38% at its lowest, then pushed higher to standing at 69.8% currently. It is projected that inflation will push above the 70% lvl this year and eventually cap out and start pushing lower. The Lira is being hit hard and has lost over 80% of its value over five years due to the unorthodox method the President implemented.
But with this said, there are things going for the TRY, which is a nice carry trade (I'm in it to win it...corny (yeah I know)), with around an 18%-27% annualized gain (fluctuates), this could be some serious gains (and price has been ranging, so that is good). With the FED potentially go to lower rates in September and with the CBRT having rates at 50%, this could cause the TRY to either keep ranging or eventually push lower. But the CBRT might have to raise rates higher in order to fight inflation that is almost 20% higher than its interest rate. This makes the 30 lvl seem that much more plausible to be hit. Additionally, price is trading towards the 32 lvl and has attempted to trade below the 30 lvl a couple of times. So another hit to the 30 lvl support could potentially push it to my price target of around 27 (mean while I'll be able to collect some rollover). A standard lot holding this pair could bring in around $49 a day (depending on the rate for that day) which is a decent amount. The margin requirement for this pair, at least with my broker is 1:4, which means this pair is highly volatile and risky.
This pair can move thousands of pips in a matter of seconds and the spreads are sometimes outrageous. But, around a 1.2 micro lot would be less than $375 in margin, each pip would be a $0.01 move, and rollover per day earned would be around $0.56 a day.
The is a good chance that price will stay were it is at and push lower. The 33-35 lvl is the cap, but for price to push as high as 35, there would have to some strong catalysts to make that happen. I think this is all a self-fulling prophecy with all waiting to see when the FED will make its move. For now, the plan is to keep building in this pair, collect rollover, and wait until at least the 30 lvl is hit to make another decision on whether I want to see it play through to the 27 lvl.

Fundamental Market Analysis for July 25, 2024 USDJPYThe Japanese yen (JPY) continues its uptrend against the US dollar (USD) for the fourth consecutive session, staying near the 12-week high of 152.640 set on Thursday. The yen's strengthening is likely due to traders unwinding asset trades ahead of next week's Bank of Japan (BoJ) meeting.
The BoJ is expected to raise interest rates at its upcoming meeting next week, which will force short sellers to cover their positions and strengthen the yen. In addition, the BOJ is expected to outline plans to reduce its bond purchases to scale back its massive monetary stimulus.
On Wednesday, Japan's Finance Minister Shunichi Suzuki and chief currency diplomat Masato Kanda avoided commenting on currency issues, causing the USD/JPY pair to fall to its lowest level in two months, according to Reuters.
The U.S. dollar may strengthen as the latest U.S. PMI data showed an acceleration in private sector activity growth in July, underscoring the resilience of U.S. growth despite higher interest rates. The data gives the Federal Reserve (Fed) more leeway to maintain restrictive policy if inflation shows no signs of easing.
Investors are expected to keep a close eye on U.S. gross domestic product (GDP) annualized (Q2) data on Thursday and personal consumption expenditure (PCE) inflation on Friday. These reports are expected to provide new insights into the US economic situation.
Trading recommendation: Trade predominantly with Sell orders from the current price level.

xauusdmoring session was beautiful, as did it on live as weel risking 15 pip against target 100 pips,
thank you for following me. as we all can see the numbers and the price tag on the 15 min chart.
any comment would be nice .

Insider Knowledge: Exploiting the House Money EffectIntroduction
In trading and investing, psychological biases significantly influence decision-making. One such bias is the "House Money Effect." Understanding this effect can help traders avoid common pitfalls and take advantage of this phenomenon.
What is the House Money Effect?
The House Money Effect is a psychological phenomenon where individuals are more likely to take risks with money they have won rather than their initial capital. In trading, this means traders become more risk-tolerant after experiencing gains, treating profits as "house money" and taking on higher risks than they would with their own capital.
Why Does It Happen?
The House Money Effect occurs due to several psychological factors:
Mental Accounting : People tend to treat money differently based on its source. Profits are often seen as less valuable than initial capital.
Overconfidence : After a winning streak, traders may become overconfident in their abilities, leading to riskier trades.
Loss Aversion : Gains are perceived as a buffer, reducing the fear of losses and encouraging riskier behavior.
Example of the House Money Effect on Crypto
In the 2021 Crypto Bull Market, we saw Bitcoin soar to all time highs. This subsequently caused many altcoins to rally really hard resulting in some 100-500x and numerous 2-3x tokens. If you observed at what point in the timeline this happened, this happened towards the end of the bull run, when everyone already knew about crypto and everybody was seemingly getting rich by buying cryptocurrencies. This was the peak of retail activity, which includes newcomers as well as those who got rich from holding tokens earlier.
This is a perfect example of the phenomenon with several key characteristics
Was after a period of extreme gains
Was causing risk assets to outperform, suggesting a higher risk tolerance in the market
Immediately after the markets tanked, clearly indicating this was a massive retail loss
By understanding and spotting the House Money Effect, traders can better manage their emotions and make more rational trading decisions. Recognizing this bias is the first step toward mitigating its impact and maintaining a disciplined trading strategy. We hope you enjoyed reading this idea.

Fundamental Market Analysis for July 24, 2024 USDJPYThe Japanese Yen (JPY) continues to rise for the third consecutive session on Wednesday, likely due to the return of risk-off-oriented flows. The Bank of Japan (BoJ) is expected to raise interest rates at next week's policy meeting, prompting short sellers to exit their positions and lending support to the Japanese Yen.
A senior ruling party official, Toshimitsu Motegi, called on the Bank of Japan (BoJ) to more clearly outline its plan to normalize monetary policy by gradually raising interest rates, according to Reuters. Prime Minister Fumio Kishida added that normalizing the central bank's monetary policy will facilitate Japan's transition to a growth-oriented economy.
The U.S. dollar (USD) is facing challenges due to rising expectations for a Federal Reserve (Fed) rate cut in September, putting pressure on the USD/JPY pair. According to CME Group's FedWatch Tool, the probability of a 25 basis point rate cut at the Fed's September meeting is 93.6%, up from 88.5% a day earlier.
Traders await the release of U.S. purchasing managers' index (PMI) data on Wednesday and annualized gross domestic product (GDP) (Q2) on Thursday. The data is expected to provide new insights into the US economic situation.
Trading recommendation: Trade predominantly with Sell orders from the current price level.

Fundamental Market Analysis for July 23, 2024 EURUSDEUR/USD fluctuated just below 1.09000 on Monday as the new trading week started on a rather weak note. There will be little meaningful data in the first half of the trading week, so traders will have to be on the lookout for key Purchasing Managers' Index (PMI) data on Wednesday in both the EU and the US.
Things will remain roughly flat on Monday and Tuesday, with markets looking ahead to the start of the week's calendar of meaningful economic data on Wednesday. Tuesday will see the release of average US existing home sales data for June. EUR/USD traders will focus on Wednesday's double block of purchasing managers' index (PMI) data. The EU Manufacturing and Services PMI for July is expected to rise slightly, while the Services PMI for the month is expected to come in at 53.0, up from 52.8 in the previous month.
On Wednesday, the US will release its own PMI data. Forecast models predict that the July US Services PMI will fall to 54.4 from the previous reading of 55.3. Thursday will continue the trend of important data releases from the U.S., particularly the second quarter 2024 annualized gross domestic product (GDP). The trading week will end on Friday with the release of the Personal Consumption Expenditures (PCE) price index, which will provide key US inflation data.
Trading recommendation: Watch the level of 1.09000. If consolidate above it, take Buy positions, on the rebound take Sell positions.

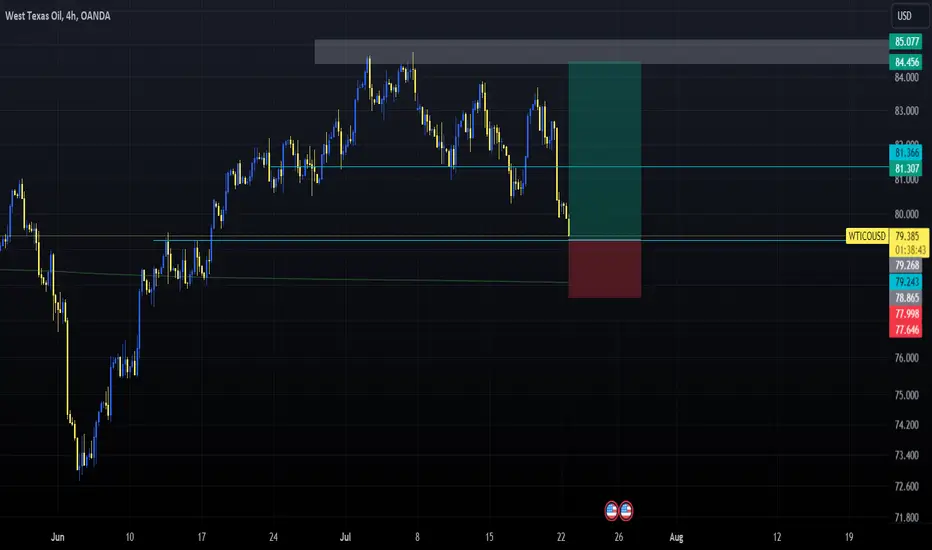
Summary of Bullish Outlook for (WTI) OilSeveral factors are contributing to a bullish outlook for West Texas Intermediate (WTI) oil prices in the near future:
1. **Rising Global Demand**: As major economies recover from the COVID-19 pandemic, industrial and transportation activities are increasing, particularly in Asia with significant contributions from China and India.
2. **Production Cuts**: OPEC and its allies (OPEC+) continue to implement production cuts to stabilize and boost oil prices, preventing significant declines.
3. **Declining Oil Inventories**: Recent reports show a notable decrease in oil inventories in the United States and other countries, indicating higher consumption and demand in the market.
4. **Geopolitical Tensions**: Instability in oil-producing regions such as the Middle East and North Africa can lead to supply concerns and price increases.
5. **Investment in Alternative Energies**: While the long-term shift to renewable energy sources may reduce oil demand, short-term transitions and policy changes can cause price volatility and increases.
### Conclusion
Given these factors, the outlook for WTI oil prices is bullish. Investors and analysts should closely monitor these dynamics to make informed decisions in the oil market.
Fundamental Market Analysis for July 22, 2024 USDJPYThe Japanese yen (JPY) remains weak on Monday, extending its losing streak to a third straight session. Traders are preparing for next week's Bank of Japan (BoJ) meeting, which may consider an interest rate hike to support the yen. Japanese Prime Minister Fumio Kishida said normalizing the central bank's monetary policy will help Japan's transition to a growth-oriented economy, according to Nikkei Asia.
Speculative short yen positions, which had risen to their second-highest level, began to shrink after Japan's anticipated yen buying intervention this month surprised the market. According to the U.S. Commodity Futures Trading Commission, yen short positions held by market participants such as hedge funds totaled 151,072 contracts as of Tuesday. This represents a decline of 30,961 contracts from the previous week and is the biggest decline since May 7, when short positions declined by 33,466 contracts, according to another report from Nikkei Asia.
The USD/JPY pair may limit its gains as the U.S. dollar (USD) faces challenges from rising bets on a Federal Reserve (Fed) rate cut in September and lingering concerns about the volatility of the U.S. labor market. According to CME Group's FedWatch Tool, the probability of a 25 basis point rate cut at the Fed's September meeting is 91.7%, up from 90.3% a week earlier.
Trading Recommendation: Watch the level of 157.500, and on the rebound we take Sell positions.

GBP / USD SELL LIMIT Hi traders, GBP / USD is looking like we are in for a reversal from supply area, my weekly fundamentals are lining up nicely.
Entry 1.30726
Sl 1.31762
Tp 1.23691
This chart material is for educational purposes only / Demo account should be traded only.
Feel free to like comment and follow

Gold Spot / US DollarHey traders on GOLD we can see that we are approaching supply area, my weekly fundamentals are telling me that we could potentially have a reversal from this area.
Entry 2,414.000
SL 2,458.232
TP 2,175.000
This chart material is for educational purposes only / Demo account should be traded only

Sei Network, $SEI Daily Chart of Sei/TetherUS*Chart shown above is Sei's historical price chart and past events embedded, including max ROI and distance from ATH.
#1 – Sei Network, TSXV:SEI - Weekly Chart of Near Protocol/TetherUS
❔ Overview
*Sei is a general-purpose, open-source Layer 1 blockchain specialized for the exchange of digital assets. Sei is one of the fastest blockchains in the industry, leveraging a novel consensus and technical breakthroughs.
Rank: #76
MarketCap: $1.25B
Sector: DEX, Layer 1, NFT
Network Compatibility: Cosmos and Sei
Top Markets - Binance and WhiteBIT
Year Founded: 2022
❓ ICO Details
•First ICO conducted last August 31, 2020, raising $45M
•Seed Sale price of 1 SEI = 0.005 USD
•Returns since first ICO: 79x
•Average ATH of $1.14 with max ROI of 228x, currently 66% from the ATH
Competitor: EURONEXT:ALGO at $1.30B
Major Competitor: CRYPTOCAP:ETH at $421B
Check them out!
Website - www.sei.io
Linktree - linktr.ee
(Nothing is FA and post is purely informational.)
Sharing this post is highly appreciated. 🫡
Safe trades! 👌
📮 July 21, 2024

xauusdall time high once again created 2484, but market crashed and closed below our previous high, and continue fall yesterday. we got strong demand on 2478/2480, look at that area as shown on chart, market can bounce up to retest to supply zone. i am looking for a long from the area.
let me know what you all think. leave a comment.

Sell EUR/CAD Channel BreakoutThe EUR/CAD pair on the M30 timeframe presents a potential selling opportunity due to a recent downward breakout from a well-defined Channel pattern. This suggests a shift in momentum towards the downside in the coming Hours.
Key Points:
Sell Entry: Consider entering a short position around the current price of 1.4932, positioned close to the breakout level. This offers an entry point near the perceived shift in momentum.
Target Levels:
1st Support – 1.4880
2nd Support – 1.4853
Stop-Loss: To manage risk, place a stop-loss order above 1.4965. This helps limit potential losses if the price unexpectedly reverses and breaks back upwards.
Thank you

AUDCAD Bearish MomentumAUDCAD just broke the trendline now in a phase where possibilities are retest of trendline. High Probability that the uptrend will change in to Down trend.

$CNGDPQQ -China's GDP (QoQ)ECONOMICS:CNGDPQQ (Q2/2024)
- The Chinese economy expanded 4.7% yoy in Q2 2024, missing market forecasts of 5.1% and slowing from a 5.3% growth in Q1.
It was the weakest advance since Q1 2023, amid a persistent property downturn, weak domestic demand, falling yuan, and trade frictions with the West.
In June, retail sales rose the least in near 1-1/2 years while industrial output growth was at a 3-month low.

SGX: CY6U Capitaland India Trust AnalysisDisclosure: As of 07/12/2024 I have no open position in SGX: CY6U
Capitaland India Trust is a REIT (Real Estate Investment Trust) that invests in commercial real estate across India.
They invest in office, data center, and logistics properties. Their portfolio is diversified across 5 major cities in India. In order of exposure: Hyderabad, Bangalor, Chennai, Pune, and Mumbai.
One risk to be aware of is the currency fluctuations of INR to SGD as well as the currency in you home country may affect returns. The company is highly profitable and looks to have manageable debt positions. Their debt is based in both SGD and INR.
The largest tenant of CY6U is Tata Consultancy Services, making up a total of 12% of base rents. The next largest are Infosys and Amazon at 6% and 4% respectively.
The company has a strong record of performance both in terms of profitability and return on investment. Debt levels appear to be manageable and management very competent.
***Please Note: Debt to equity shown in the chart is out of date. Check most recent reports on CY6U investor relations for current debt levels***
The company is currently trading below book value and has a P/E of less than 10. With a dividend yield of 6% you have an earnings and dividend return of 15%. This is not including any potential growth the company may experience in its earnings or asset value.
Summary: Capitaland India Trust seems to be a quality company that is likely undervalued. Potentially due to the fact it is listed in Singapore as opposed to in India. Considering the growth in India buying this high quality assets below book value looks very appealing. I will update with further research and if I open a position.

usdjpydaily frame technical prediction.
after creating equal high strong bearish movment but as we see in the chart demand zone and the trend line been respected, as i draw clear line on the chart for shrting position i belive we must wait for a pull back to previous high 163.440, 164.100, 165.500 levels.
let me know what you all thinking leave a comment below share if you like the idea.

Fundamental Market Analysis for July 12, 2024 GBPUSDThe Pound-Dollar pair fluctuated between weak gains and minor losses around the 1.29000 mark during the Asian session on Friday and remains within striking distance of the yearly peak reached the previous day. The US Dollar (USD) is attracting some buyers on the back of a good rise in US Treasury yields and is moving away from the near three-month low reached the day before, which in turn acts as a headwind for GBP/USD. Meanwhile, weaker US consumer inflation data released on Thursday raised market bets on the imminent start of the Federal Reserve's (Fed) rate cut cycle in September. This could curb a significant rise in U.S. bond yields. In addition, the prevailing risk-on bias may deter traders from aggressively bullish bets on the safe-haven Dollar.
The British Pound (GBP), on the other hand, continues to receive support from data released on Thursday that the UK economy grew at a faster-than-expected 0.4% in May. This comes on the back of recent comments from Bank of England (BoE) policymakers that dashed hopes of a rate cut in August. On Wednesday, Bank of England MPC member Catherine Mann said that until there is a slowdown in service price growth, she would not advocate an interest rate cut. To add to this, Hugh Pill, the Bank of England's chief economist, noted that there is still some work to be done before the domestic permanent component of inflation disappears.
The aforementioned fundamental backdrop seems to be leaning in favor of the bulls and suggests that the path of least resistance for the GBP/USD pair lies to the upside. Thus, any significant corrective decline could still be seen as a buying opportunity and is likely to remain limited. Nevertheless, spot prices remain on track to end a third consecutive week in the green. Traders now await the release of the US Producer Price Index (PPI) and the University of Michigan Consumer Sentiment Survey due later in the North American session, looking for short-term opportunities on the last day of the week.
Trading recommendation: Trade predominantly with Buy orders from the current price level.
