GOLD Under RadarIts testing some zone of interest , we wait for the retracement and we take the long position as soon as the bearish candlsticks finish their , momve,ent
Fundamental Analysis
LINK/USDT - SHORT/LONGI expect the movement to be implemented in about a month.
(Not an investment recommendation).

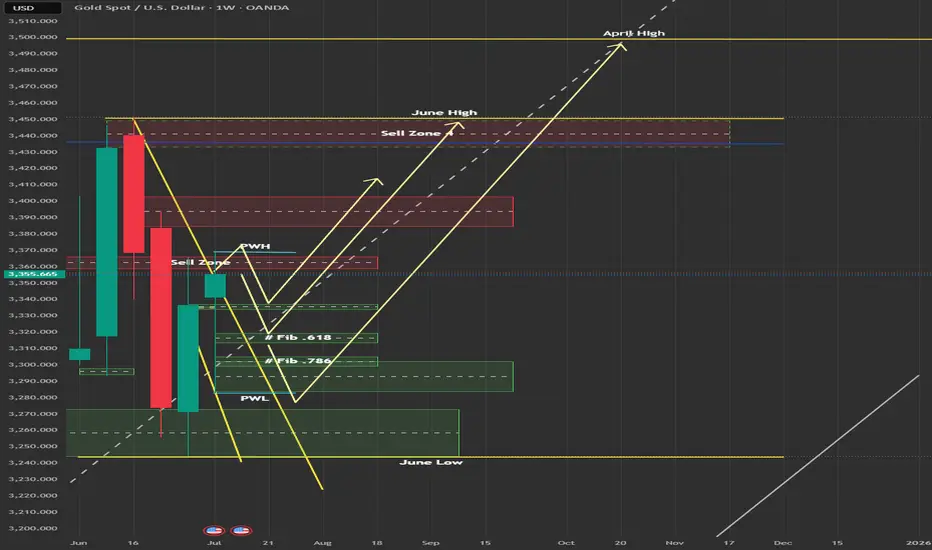
Gold Weekly Outlook -14-19th July🟡 Gold Weekly Outlook – Bullish Momentum Tested at Key Support
Welcome to a new trading week! Gold remains in a broader uptrend, though recent price action is testing a critical support zone that could define the next directional move.
🔹 Key Zone in Focus: $3,308
Gold is currently testing the $3,308 level, a major support area from previous consolidation. How price reacts here will shape the near-term outlook.
🔼 Upside Scenario (Rebound from $3,308):
$3,387 – Initial resistance and breakout target
$3,400 – Key psychological and structural level
$3,435 – Long-term resistance zone from weekly charts
🔽 Downside Scenario (Break below $3,308):
$3,290 – Minor support
$3,268 – Stronger demand zone with historical buying interest
Outlook: The bullish bias remains valid as long as Gold holds above $3,308. A daily close below would shift momentum to the downside, opening up lower support levels.
📉 Weekly Chart (High Timeframe Outlook)
Bias: Bullish, but signs of exhaustion are emerging
Current Candle: Bearish rejection forming after last week’s lower high
Trend: Still upward, but stalling inside a distribution-like pattern
Weekly Structure:
Major CHoCH in early 2023 triggered the ongoing uptrend
Price made a Higher High near $3,500, but it appears weak
Now consolidating inside a premium range, rejecting upper levels
🔑 Weekly Confluence Zones:
Type Price Zone Confluence Factors
🔼 Resistance $3,490–$3,500 Weak high + RSI divergence + FVG
🔼 Supply $3,450–$3,470 Imbalance fill + overextended EMA5
🔽 Support $3,355–$3,320 Weekly order block + FVG zone
🔽 Deep Demand $3,200–$3,170 Last strong demand + BOS origin
Fibonacci: 50% retracement sits near $3,250
Weekly RSI: Rolling over from overbought – potential early trend cracks
EMAs (5/21/50): Still bullish but flattening – short-term caution
🔍 Key Weekly Watchpoints:
Close above $3,470 → possible sweep into $3,500 resistance
Failure to hold $3,355–$3,320 → deeper drop toward $3,200
Watch for lower high formation inside premium = bearish shift
A bounce from $3,320 must be supported by volume and FVG reaction
📊 Daily Chart (D1) – Compression Near Supply
Bias: Neutral with rising bearish pressure
Trend: Still bullish overall, but compressing between supply and mid-range zones
Current Position:
Price capped below $3,395
Bearish CHoCH formed, but no daily BOS yet
EMAs are narrowing; RSI is flat → signs of indecision
🔑 Daily Zones to Watch:
Type Price Range Highlights
🔼 Supply $3,448–$3,465 Daily OB + EMA divergence + trap zone
🔼 LH OB $3,385–$3,395 Internal supply + EMA21 rejection
🔽 Mid FVG $3,328–$3,310 Fib midpoint + previous reaction zone
🔽 Strong OB $3,260–$3,245 Unmitigated OB + 61.8% fib retracement
Fibonacci: Pullback to $3,310 = mid-point of the last bullish impulse
EMAs (5/21/50): Bearish crossover, but no strong divergence
RSI: Neutral – awaiting price action confirmation
📌 Trade Scenarios:
Bearish: Rejection at $3,385–$3,395 → fall toward $3,310, then $3,245
Bullish: Clean break + retest above $3,395 → short squeeze into $3,460 liquidity
⏱️ 4H Chart – Intraday Bias: Bearish (Below $3,420)
Bias: Bearish unless price reclaims and holds above $3,420
Structure: Lower high formation likely; recent CHoCH may be inducement
Context: Filled FVGs + untested OBs in premium → caution warranted
RSI: Near exhaustion
🔼 Zones Above Price:
$3,445–$3,465 – Weak high + unfilled FVG = likely bull trap
$3,405–$3,420 – Lower high resistance zone; likely turning point
$3,360–$3,385 – Core supply from CHoCH + EMA21 dynamic resistance
🔽 Zones Below Price:
$3,340–$3,355 – Minor support; could break easily
$3,300–$3,280 – Key demand zone at 50% fib retracement
$3,240–$3,210 – Major support; origin of the last HL
$3,185–$3,160 – Final liquidity zone; break here would invalidate June rally
🎯 Intraday Trade Setups:
🔻 Bearish Setup (Preferred):
Rejection from $3,405–$3,420
Forms a lower high → clean drop toward $3,300
Confirmation: bearish engulfing or wick rejection on M30–H1
🔺 Bullish Breakout (Less Likely):
Strong break + hold above $3,420
Upside extension into $3,445–$3,465 zone
Must be supported by dovish macro events (e.g., soft CPI or FOMC tone)
Note: That zone remains weak liquidity, so not ideal for holding longs
📌 Final Word
Gold’s bullish trend is intact while price holds above $3,308, but momentum is slowing.
The battle between bulls and bears is happening in the $3,300–$3,395 range. A break outside this zone will likely define the trend for the week ahead.
Stay disciplined, watch for key confirmations, and manage risk carefully.
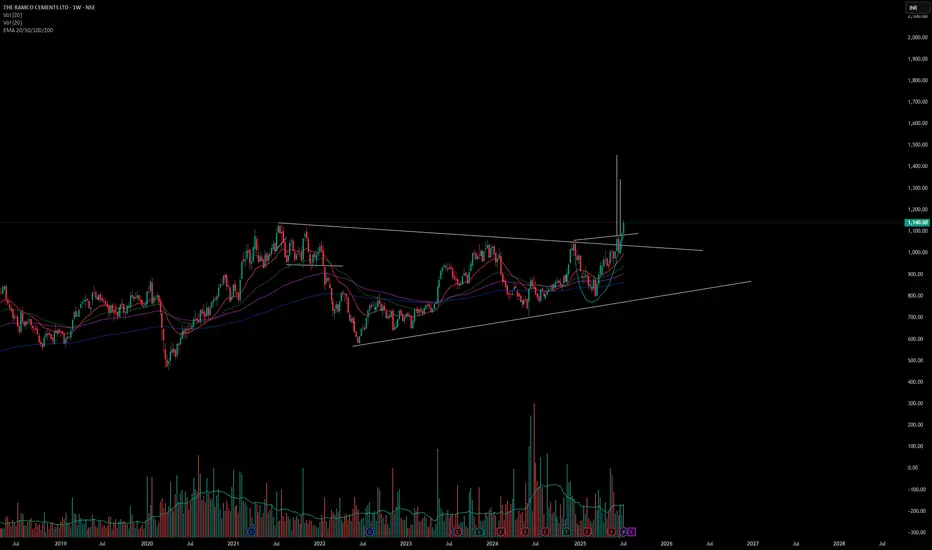
Long The Ramco Cements LTD . On 9/07/2025 I have shared this stock with all of you but very few people have seen this publish idea but today on 13/07/2025 I am sharing this stock with all of guys with weekely analysis of this stock. Its new target is 1450.
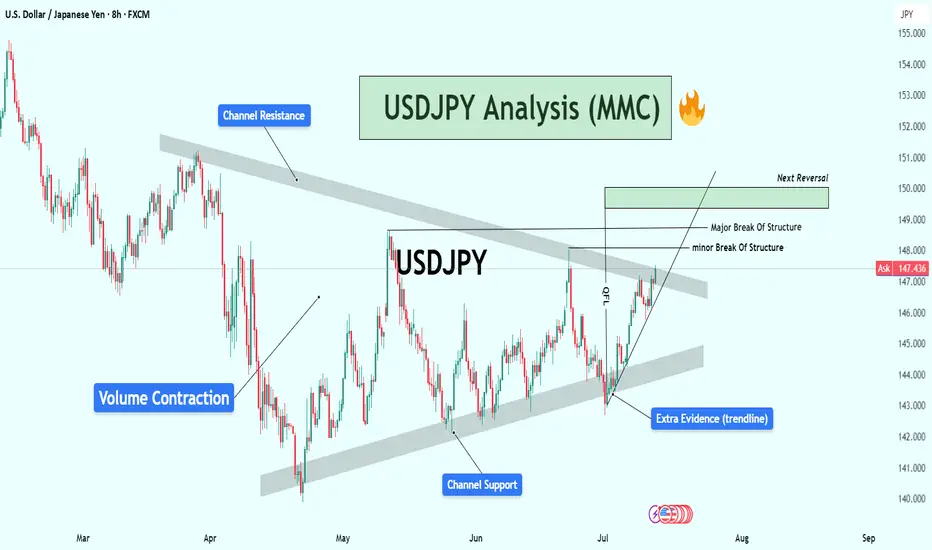
USDJPY Analysis : Major Move Loading Towards Target Zone🕵️♂️ Overview
The USDJPY pair is approaching a critical turning point within a well-established descending channel structure. After several months of corrective movement and internal structure shifts, the market is now displaying multiple layers of confluence pointing toward an impending major reaction or reversal. Let’s break down this chart step by step.
🧱 Market Structure Analysis
🔹 Descending Channel:
The entire chart is governed by a broad descending channel, with price making lower highs and lower lows since early March.
Each touch of the channel support has led to a bounce, and the price is now once again near channel resistance, creating a possible reaction zone.
🔹 Volume Contraction Phase:
In the mid-section of the chart, we observe volume contraction, indicating liquidity drying up and buyers/sellers entering a phase of uncertainty.
This contraction is typical in accumulation or re-accumulation phases, which often precede strong impulsive moves — exactly what followed here.
🧩 Structural Breaks and Trendline Clarity
🔸 Minor Break of Structure:
A recent high was taken out in early July, marking a minor break of structure (BOS), showing the first signs of bulls taking short-term control.
🔸 Major Break of Structure:
A more significant high (marked on the chart) has also been broken, confirming a major BOS — this implies institutional positioning or a shift in market sentiment.
🔸 Trendline Break – Extra Confirmation:
The bullish push came after breaking a clean internal trendline, which acted as diagonal resistance.
Once this trendline broke, price aggressively accelerated upward — this is a classic market maker cycle (MMC) Phase 2 (expansion) move.
📍 Confluence at Next Reversal Zone (149.00 – 150.00)
The green highlighted zone is the next potential area for bearish pressure to return, based on:
Key Supply Zone: Historical area where sellers previously dominated.
Channel Resistance Confluence: Top of the descending channel aligns with this zone.
Psychological Level: 150.00 is a major psychological round number — often attracts profit-taking and institutional activity.
Fibonacci (if plotted): Likely 78.6% – 88.6% retracement from last swing high.
Overextended Rally: Price has rallied strongly since early July with very little correction — it’s approaching exhaustion.
🔄 Market Maker Cycle (MMC) Alignment
This move perfectly reflects the Market Maker Cycle:
Accumulation: During volume contraction phase.
Manipulation: Fakeouts near channel support to trap shorts.
Expansion: Break of structure + trendline, aggressive rally.
Distribution (Next): Likely to occur at the 149–150 zone with a sharp rejection.
🧠 Trader’s Plan – What to Look For
📈 If Bullish:
Targets: 148.80 to 149.80 zone
Hold until rejection signs (bearish candles, volume spikes, divergences)
SL: Below recent swing low/trendline (~146.00)
📉 If Bearish (After Rejection):
Watch for:
Strong bearish engulfing candle or shooting star
RSI/MACD divergence (not shown but suggested)
Break of short-term ascending trendline
Targets: Back toward 145.50 or mid-channel (dynamic)
🔖 Summary
USDJPY is showing clear signs of bullish exhaustion near the upper channel resistance and major structure levels. If price respects this zone (149–150), expect a healthy corrective leg or full reversal. Multiple layers of technical evidence, including structure breaks, trendline breach, and MMC phases, are aligning for a high-probability play.
This is a textbook setup for experienced traders watching key zones with proper confirmations.
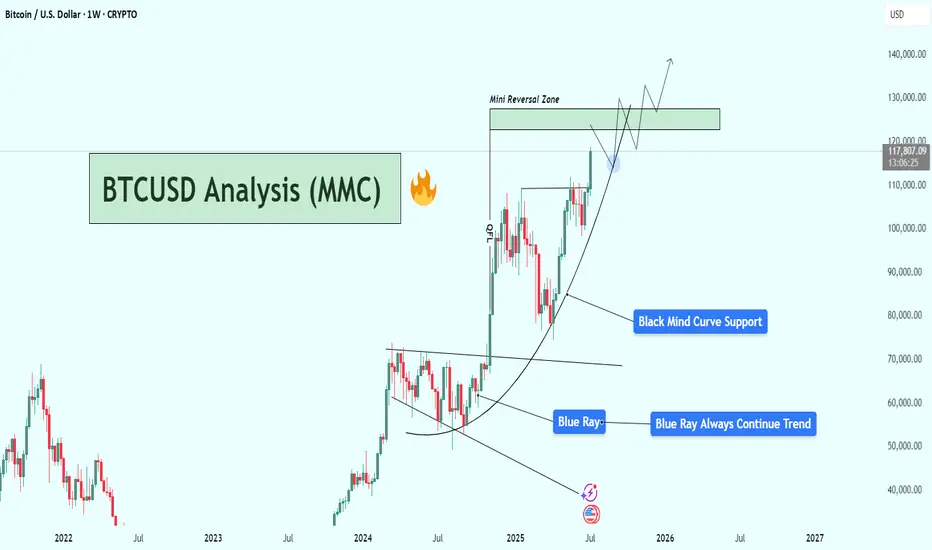
BTCUSD Weekly Analysis : Testing $130K Resistance + Next Target📌 1. Big Picture – Bitcoin is in a Parabolic Uptrend
This chart clearly shows that Bitcoin has shifted from a consolidation phase into a full-blown parabolic rally. That’s not just random growth — it’s an aggressive, momentum-driven market move that usually only happens during major bull cycles.
The curve shown in black — labeled “Black Mind Curve Support” — is your guide here. It's not a simple trendline. It shows how Bitcoin is accelerating upward, and this curve acts as a dynamic support. Every time price dips to it, buyers jump in fast — which shows strong bullish pressure and market confidence.
🔍 2. Blue Ray Broken = Trend Change Confirmed
Earlier, BTC was stuck under the Blue Ray, a long-term resistance trendline. As marked:
“Blue Ray Always Continue Trend”
That means, as long as price stays under it, the market is bearish. But guess what?
BTC broke above it — strongly.
That break confirmed a reversal in long-term structure, and it triggered this massive upward move. This breakout also aligned with a pattern of higher highs and higher lows, further confirming that bulls are now in full control.
🧠 3. Current Situation – Heading Into Mini Reversal Zone
Now BTC is trading around $117,820, and it's approaching the green box labeled Mini Reversal Zone — between $125,000 and $135,000.
Why is this area important?
It’s a psychological zone (big round numbers).
It lines up with historical resistance and previous supply zones.
It’s where smart money might take some profit, so we could see rejection or a short-term pullback here.
🎯 4. Two Scenarios to Watch
✅ Scenario A: Mini Pullback & Retest
BTC hits the Mini Reversal Zone → stalls → pulls back → retests the Black Mind Curve → bounces again.
That’s bullish and normal in a healthy uptrend. If you missed earlier entries, this pullback could be your golden opportunity.
🚀 Scenario B: Breakout of Reversal Zone
If Bitcoin breaks above $135K with strong momentum and closes the weekly candle high, we may see another parabolic rally toward $140K+.
This would mean even stronger buyer interest, possibly driven by FOMO, ETFs, or macro news.
📉 What Could Invalidate the Bullish Move?
Only if BTC:
Breaks below the Black Mind Curve, and
Starts closing weekly candles under $105K–$100K
That would mean the curve is broken, momentum is lost, and we might go into a consolidation or deeper correction.
But for now? No signs of weakness. Trend is strong, volume is rising, and price action is clean.
🧩 Summary of Key Levels
Type Level Notes
Curve Support Dynamic ($105K–$110K) Critical for trend continuation
Mini Reversal Zone $125K – $135K Watch for rejection or breakout
Bullish Target $140K+ If breakout holds above reversal zone
Trend Indicator Black Mind Curve As long as price rides this, bulls are in control
📌 Final Thoughts
This BTC chart isn’t just a random uptrend — it’s a well-structured parabola, powered by strong technical support and clean breakouts. Everything is lining up for a potential monster move, but don’t chase price blindly.
Watch the Mini Reversal Zone closely. If we see rejection, be ready to buy the dip. If we break through with volume — it’s 🚀 time again.
EURUSD Daily: More trouble ahead or ready to recover?The last Friday NY bearish closed sited at Fibo(38.2) and still showing a strong bullish move since last March we may see a bit more downward move to test the Fibo(50) at 1.16388 before start another bullish leg up again. While the price stays above the 1.5956 level I will look for any price action towards 1.18298 but with all chaos caused by this tariff war we need to be careful.
As a technical reference, Resistance at 1.182998, Support at 1.14522 and RSI(14) at 58 that seems to be heading to test the 50 level.

melt facesthis will melt faces. This is an OG meme from I believe 2010 internet culture, the community is super active and it's one of the better cat coins on Solana. I have good Chuvashov fork signals and cloud analysis checks out. please share your thoughts with me.

BTAF Token Update. Is a 1000% move coming? BTAF has completed a strong 100% breakout and is now consolidating above its support level. A retest of the breakout zone may offer a solid entry opportunity before the next leg up.
Next 90 Days Outlook:
Bullish structure remains intact.
Expect a potential upside of 200%–300% if momentum continues.
Increased demand from Whisper Drop utility and growing adoption support the case.
Long-Term View (6–9 Months):
Forecasting up to +1,000% growth from the original breakout base.
The BTAF Algorithm is expected to repeat. See the chart.
Ecosystem expansion and increased use cases are key drivers of growth.
Strategy:
Hold or accumulate on dips.
Watch for updates via Whisper Drop and TradingView.
Let the trend work for you.

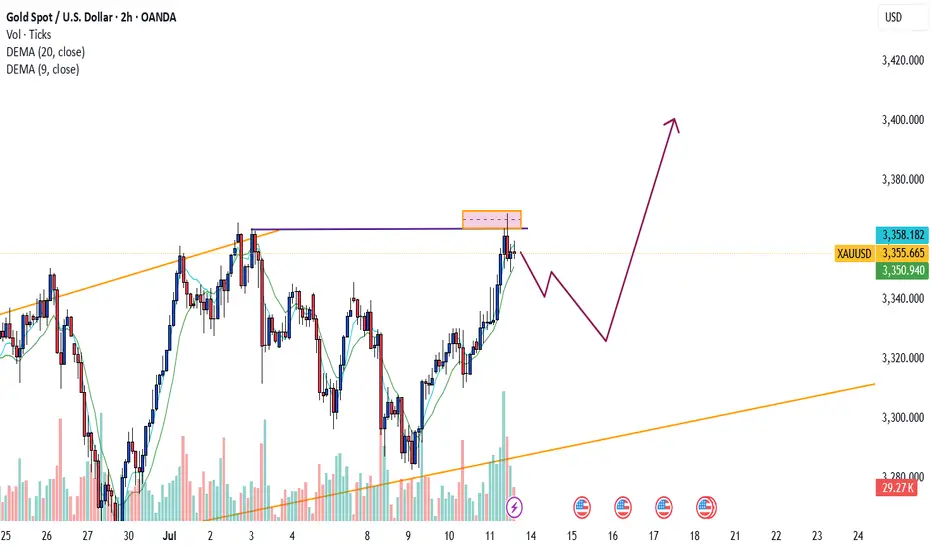
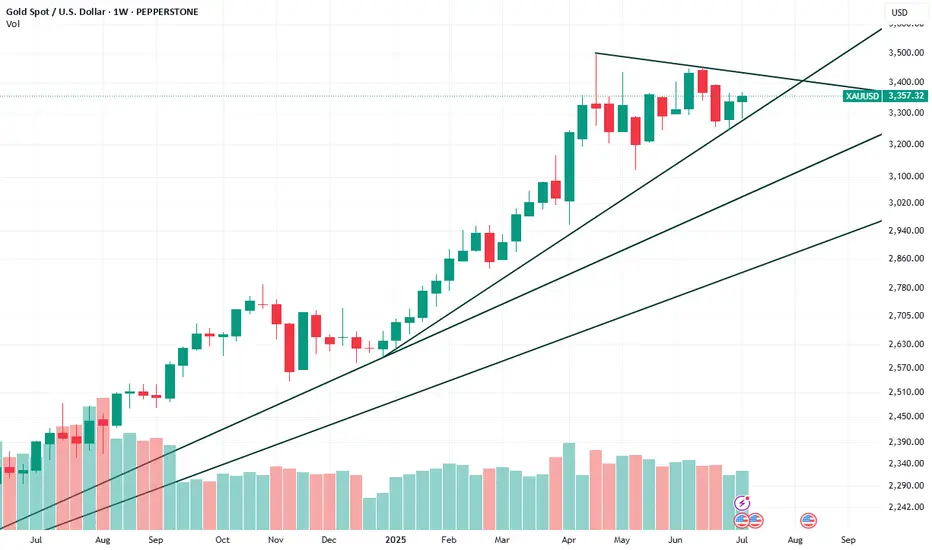
Will Gold Go to $3,420?Gold continues to attract demand as a safe-haven asset amid ongoing global political tensions. Institutional traders have increased their net long positions by approximately 1,000 contracts, signaling growing confidence in the bullish outlook.
On Friday, Gold printed a new Higher High, surpassing last week's peak — a technical sign of continued upward momentum. This price action, combined with increased institutional interest, suggests that a move toward the $3,420 level is within reach.
That said, I remain cautiously optimistic. There's still a risk of a short-term pullback, especially to fill the nearby gap left behind during last week’s price acceleration. Any retracement may offer another opportunity to buy at a discount.
Chart Breakdown (Weekly – XAU/USD)
Symmetrical Triangle Forming:
Gold is consolidating within a tight triangle, with higher lows and lower highs converging.
A breakout above the upper trendline (~$3,420 zone) could trigger a new leg upward.
Volume Analysis:
Volume remains steady but not explosive — indicating consolidation, not reversal.
Watch for a volume spike on breakout to confirm the move.
Trendline Support Holding:
Price is respecting the rising trendline from December 2023.
As long as this line holds (~$3,300), the bullish structure remains intact.
Upside Targets:
Breakout above $3,420 could open room toward $3,500+.
A failure to break may lead to a retest of the support near $3,280–$3,300.
Bearish Scenario:
If the triangle breaks to the downside, price may revisit $3,100–$3,180 to fill the gap.
Buy this stock if you want to get burnedThis isn't going to be a V shaped recovery y'all. Another leg down is on the way.

Next target for the legendary Bitcoin: $143,000🚀 Keep buying the dips all the way to the top.
📈 Algo traders: lock your EAs on LONG.
Need one? Check the link in my bio 😉
#Bitcoin #CryptoTrading #BTC143K #BuyTheDip #AlgoTrading #EAs

BTC Forecast: CPI Trap or Liquidity Sweep?Powered by Advanced Time-Price Analysis | Dr.Gemy | Digital Gann Strategy
Using Time Cycles, IPDA logic, and Digital Gann structure, the upcoming week for Bitcoin is setting up for a high-probability liquidity event, especially with high-impact macro data scheduled.
📍In the next 18 hours, we expect a short-term correction toward the 115,911 USD zone.
---
⏰ CPI (Tuesday) & PPI (Wednesday) = catalysts for smart money traps.
I expect a textbook liquidity hunt around the inflation data window.
Time is more important than price.
🔮 Two Critical Scenarios Unfolding:
✅ Scenario 1 – CPI Trap Setup (Tuesday News Play)
🕒 If BTC continues correcting into Tuesday (July 15), targeting 113,724 USD, this will align perfectly with the release of U.S. CPI (Inflation) data at 3:30 PM GMT+3.
📈 A fake bullish breakout above 118,098 USD could follow, luring retail traders with an inflation-driven spike, only to be reversed sharply to collect liquidity around 111,537 USD.
🧠 CPI y/y forecast is 2.6% vs 2.4% prior – higher inflation could spark temporary bullish reaction, but the underlying setup suggests it's a trap.
---
🎭 Scenario 2 – Smart Money Pump and Dump
📈 BTC might front-run expectations with an early week rally to retest 118,098 USD, only to reverse midweek (around Wednesday's PPI release) as the market reacts to deeper macro data and shifting dollar strength.
💣 Downside continuation could sweep below 113,724 USD, ultimately reaching the key demand base at 111,537 USD, which marks the beginning of the last major impulsive move.
---
🧠 Strategic Concepts Used:
Time Fractals (9H Cycle Lines)
Gann Reversal Timing & Breaker Blocks (H4)
Smart Money Traps around News
IPDA Voids & Liquidity Pools
CPI/PPI/Macro Liquidity Zones
#CryptoForecast #BTCUSD #CPIWeek #GannTiming #SmartMoney #LiquiditySweep #IPDA #ForexStyleCrypto #DigitalGann #DrGemy

GIS to $100 by 2030?Looking at the previous chart patterns and RSI indicator, I am going to be looking for a reversal around the $55.00 level.
This could be a great opportunity to get into a long term position with huge upside potential.
The RSI looks very similar now, to how it did in December of 2018 when it went into an uptrend.
TP1 $60
TP2 $70
TP3 $90
I am mostly posting this so I can look back on my theories and see how I can improve on my trading strategies. Please leave your feedback below, thank you.

🐋 Deep Dive Part II: Whale Behavior & Market Mastery! 🌊📚Hey Crypto Enthusiasts! 🚀
In a recent analysis, I not only nailed Bitcoin's (BTC) movement but also illuminated the subsequent altcoin surge, driven by insightful whale behavior observations. Let's merge these insights with a focus on ADA (Cardano), OP (Optimism), SOL (Solana), and BTC. 📊
Cardano's (ADA) Meteoric Rise 🌟
ADA's journey began with a break above a pivotal support-resistance level. My entry point at 0.256 turned into a remarkable rally, hitting 52 cents. This movement was a classic case of altcoin buoyancy following Bitcoin's pause.
Optimism (OP) and the Altcoin Breakouts 🌈
In the shadow of Bitcoin's stagnation, altcoins like OP exhibited significant breakouts, showcasing the shifting focus of market whales from Bitcoin to promising altcoins.
Bitcoin (BTC) and Whale Dynamics 📉
Bitcoin's behavior provided a crystal ball into the whale activities. As BTC approached a major resistance level, it signaled a strategic move by whales to divert funds towards altcoins, catalyzing their surge.
Solana (SOL) and Market Trends ☀️
Solana's chart also mirrored this trend, highlighting the broader market dynamics influenced by these significant players.
🔍 Insight on Whale Behavior:
My analysis delved deep into the whale behavior, highlighting how Bitcoin's rally and subsequent pause was a precursor to altcoin dominance. This strategic pause in Bitcoin's ascent was a clear signal for the whales to redistribute their focus and capital, sparking a remarkable rise in altcoins like ADA, OP, and SOL. 🔄
The Bigger Picture - Understanding Market Shifts: What this trend teaches us is the importance of reading between the lines. Whale movements often precede major market shifts, and by understanding these patterns, we position ourselves to make informed decisions. 🧠
Future Outlook: As we continue to monitor these market dynamics, it's crucial to stay vigilant. The crypto market is known for its volatility, and while the current trend favors altcoins, it's essential to be prepared for any shifts that may arise. Always keep an eye on key resistance and support levels, market sentiment, and global economic factors that could influence the next big move. 🌐
Together, let's stay ahead of the curve in this fascinating and ever-evolving world of cryptocurrency. Your insights and engagement are what make this journey exciting and rewarding!
One Love,
The FXPROFESSOR 💙
part 1:

AVAX is Back: Subnets, Upgrades, and Institutional Momentum🚀🧠 AVAX: Subnets, Upgrades, and Institutional Momentum 🔧🏛️
Avalanche (AVAX ) is starting to shape up again — not just on the chart, but at the infrastructure and institutional level too.
As part of the Altcoin Series, I continue to trade these setups while preparing for a time when I’ll divorce alts emotionally and treat them for what they are — assets to be traded, not worshipped.
But right now? This one looks strong.
📊 Chart Breakdown
Left side: Macro chart (8H)
✅ We've just completed a successful third touch of structural support — you can see the 1–2–3 test boxed below the $18.64 level
📍 That’s usually where conviction builds, and reversals are born
🚀 A massive breakout confirmation comes if we close above $22.97 — the level to watch
🧱 Above that, the path opens toward higher fib levels: $27.65 → $35.13 → $43.63 and beyond
Right side: Micro structure (30-min chart)
🔍 A descending wedge or coil forming — typical of consolidation before breakout
This price action is tightening into a decision point, right around $20.80–$21
I expect a breakout soon, with a push toward the macro trigger at $22.97
🧩 What’s New with AVAX?
Avalanche 9000 Upgrade is Live
Major performance overhaul: cheaper subnets, faster deployment
Subnets now act more like sovereign L1s, enhancing utility across the board
Developer cost dropped by over 99%, inviting serious builders
DeFi, Real-World Assets & Ecosystem Growth
TVL > $5B
VanEck’s $100M Treasury Fund now tokenized on Avalanche
Over 515M transactions per month
Real-world integrations with Alipay, California DMV, and more
Enterprise Expansion
FIFA subnet launch (NFTs, tickets, collectibles)
Institutional panels at Avalanche Summit London
Avalanche’s vision: a custom chain for every institution
Retro9000 Grant Program
$40M set aside to fuel L1 growth via subnets
Analysts expect 300% subnet growth by Q4 2025
🧠 The Mindset: Trade, Not Worship
AVAX is a great example of why I'm preparing to divorce altcoins at the cycle top.
It’s gone from hype to silence... and now to real infrastructure momentum.
So yes — I’m bullish.
But I’m not here for belief — I’m here for the structure.
✅ Buy over support
✅ Breakout over $22.97
🛑 Stop-loss if structure fails
🎯 Targets: $27.65 → $35.13 → $43.63+
🏁 Final Word
Avalanche is rebuilding — on-chain, in the real world, and on the chart.
It has subnets, speed, and now institutional backing.
Let’s trade it smart.
Let’s trade it without emotions, do your risk management and don't listen to me.
One Love,
The FXPROFESSOR 💙
Disclosure: I am happy to be part of the Trade Nation's Influencer program and receive a monthly fee for using their TradingView charts in my analysis. Awesome broker, where the trader really comes first! 🌟🤝📈

Major Breakout– Ethereum Broke Free from 'Clashing Resistances'🚀💥 Major Breakout – Ethereum Broke Free from the Clashing Resistances 🔓🟣
ETH has finally done it.
After months of battling overlapping resistances — the Clashing Stones, as we called them — Ethereum has broken out, and $2,912 is now acting as support, not resistance.
This breakout isn't just technical, it’s structural.
The previous 1-2-3 rejection setup has now been invalidated.
🔎 Chart Summary:
✅ $2,912 = confirmed breakout zone
🎯 Destination 1: $4,881 (if Vitalik’s asleep 😴)
🚀 Destination 2: $6,443 (if he wakes up 💡)
🔭 Scroll up for Destination 3
This is the real ETH breakout we’ve waited for — not hopium, not chop. This is clear structure.
If BTC stabilizes near 114,921+, ETH could enter outperformance mode and gain serious traction on the ETH/BTC chart.
📢 Keep your eyes on narrative catalysts:
ETH ETF, L2 growth, and Vitalik waking up...
We are officially off the resistance — and heading to where few have charted before.
One Love,
The FXPROFESSOR 💙
📌 Long — as long as $2,912 holds. If it fails, you already know what to do.
Disclosure: I am happy to be part of the Trade Nation's Influencer program and receive a monthly fee for using their TradingView charts in my analysis. Awesome broker, where the trader really comes first! 🌟🤝📈

TON – Just a Trade, Probably Out at $6.30📈💼 TON – Just a Trade, Probably Out at $6.30 🎯📊
Welcome back to the Altcoin Series, this time with a closer look at Toncoin (TON) — and yes, it’s just a trade.
Later in the cycle I’ll be divorcing altcoins, but not yet. I’m still bullish. I see setups, I take them. I don’t marry charts — I extract from them.
🔍 What’s the Setup?
TON is at a retest of long-term trendline support, with multiple prior accumulation zones marked on the chart. We’ve just bounced from $2.81, right above the golden pocket area, and we have a clear map higher — but it’s a trade, not a love letter.
🔑 Key Levels
🔹 Entry zone: $2.81–$2.95 (golden pocket & trendline bounce)
🔹 Next levels to watch:
$3.74
$5.52
Likely exit zone: $6.35
🔺 Fib extension shows potential up to $8.49+, but I’m keeping it tight
🛑 Invalidation: Close below $2.81 = back to cash
🧠 The Trader’s Mindset
TON is moving with the narrative — it’s been strong, it’s caught attention, and it’s holding key levels. But I’m not here to believe in the story.
✅ It’s a structural bounce
✅ The risk is clear
✅ The target is clean
🚫 No emotion, no narrative, just levels
This isn’t marriage. It’s business.
🧩 What’s New in Tron?
Tron is picking up momentum, driven by multiple on-chain and institutional signals:
📈 Whale accumulation & on-chain strength — large holders have been accumulating, while withdrawals suggest long-term conviction
🤝 Strategic partnership with Binance Alpha — a roadmap to DeFi expansion and increased liquidity
🧩 Growing stablecoin & DeFi footprint — over $80B USDT on Tron, 6B+ transactions and $15B TVL
🏛️ Coming U.S. debut via a Nasdaq reverse merger — enhanced credibility and U.S. exposure, paused SEC probe, Trump-linked momentum
The Verge
Tron is evolving—from a memecoin playground to a player ready for institutional-level infrastructure.
One Love,
The FXPROFESSOR 💙
Disclosure: I am happy to be part of the Trade Nation's Influencer program and receive a monthly fee for using their TradingView charts in my analysis. Awesome broker, where the trader really comes first! 🌟🤝📈

Bitcoin price increaseAfter the tensions between traders in the United States and the strong price fluctuations in the dollar and other stocks, and after the 3-month increase in gold, this time it will be the turn of digital currencies to increase again and there are signs of their increase in the market. For Bitcoin, two increase targets can be considered: $110,000 - $120,000.
Sasha Charkhchian

TRX Grinding Higher – Are These the Next Targets?📈🔥 TRX Grinding Higher – Are These the Next Targets? 🧱🚀
Continuing the Altcoin Series, let’s take a look at TRX (Tron) — quietly grinding higher while the crowd stays distracted elsewhere.
As I’ve said before: I’m preparing to divorce altcoins at the top of this cycle. But until then, I’m a trader — and TRX is a chart that deserves our attention right now.
🔍 Two Perspectives, One Message
The 1H intraday chart shows clear structure within an ascending channel, holding its higher lows beautifully.
Meanwhile, the 2D macro chart reveals a long-term channel breakout, now pressing up into key resistance.
📊 Levels That Matter
Short-Term Support (1H):
🔹 $0.29926
🔹 Mid-channel trendline
Macro Zones (2D):
🔸 Current Price: $0.30991
🔸 Next key levels:
$0.38540
$0.46122
Structure to Watch:
Price remains well-supported by the orange trendline — a multi-year diagonal that’s been acting as dynamic support. As long as that holds, TRX remains on the offense.
⚠️ Narrative-Free Trading
Let’s be real — Tron isn’t the sexiest narrative play.
But the chart doesn't lie: structure is intact, trend is up, and targets are in sight.
This is the kind of setup where emotion gets left at the door — we trade the level, not the label.
Buy over support
Exit near resistance
Control risk — always
TRX may not trend forever — but for now, it’s trending just fine.
One Love,
The FXPROFESSOR 💙
Disclosure: I am happy to be part of the Trade Nation's Influencer program and receive a monthly fee for using their TradingView charts in my analysis. Awesome broker, where the trader really comes first! 🌟🤝📈

The 1.414 Fib – Smart Money’s Darkpool Fib📐💸 The 1.414 Fib – Smart Money’s Darkpool Fib 🔍🧠
Let’s talk about the 1.414 Fibonacci extension — also known as √2 — a subtle but deadly precise level that smart money uses to trap retail.
We saw this play out perfectly on Solana.
That ~$295 zone (close to 300$ but 'no cigar') ?
That was the 1.414 Fib , and it nailed the top before a brutal reversal — a textbook darkpool distribution move.
But Solana wasn’t alone.
🔁 This Isn't Just About SOL
The 1.414 (√2) level has repeated across the crypto market , quietly acting as a marker for institutional exit zones:
📉 It showed up on multiple altcoins in December 2024, just before the entire altcoin rejection
🟠 It’s even been visible recently on Bitcoin itself — yes, even the king of crypto respects this level
So no — this isn’t random. This level has a story to tell.
🤖 Why 1.414 Matters
Most retail traders fixate on the golden ratio: 1.618.
But the 1.414 (√2) is just as important — and arguably more manipulative.
It allows institutions to:
- Front-run major Fibs
- Exit quietly
- Trap late bulls
It’s less obvious, less crowded, and often more effective.
That’s why I call it the "Darkpool Fib."
💔 Why I’m Divorcing Altcoins — But Not Yet
Solana’s chart — and its story — are symbolic of a deeper shift in me as a trader.
I’ve made the decision: at the end of this cycle , I’ll be divorcing altcoins.
Not out of hate — but out of clarity. I won’t “believe” in them anymore. I’ll just trade them.
But let’s be clear:
That moment isn’t now.
Right now, I’m still bullish. I still see opportunity. I’m here to ride the structure — while it’s still giving, or at least going to give something back.
📍Take Solana...
🔹 It was built on Rust, a language praised for speed and performance — perfect for high-throughput, data-heavy blockchain architecture
🔹 It could have been the chain that led us into the future
🔹 Instead, it’s become a memecoin playground , with repeated outages and centralized concerns
I don’t hate it. I just don’t believe in it the way I used to.
Narratives die. Structure doesn’t.
So yes — I’m trading SOL. I respect its levels. But I’ve let go of the idea that it will “change the game.”
I’ll trade the rally. I won’t marry the story.
📊 The Technical Setup
[📍 Support Zone: $153.48 $140.44
Below that, deeper support at $130.17 and $112.12
📍 Current Price: ~$158
📍 Upside Targets:
Minor: $196.80
Mid-channel: $221.53
Structural resistance: $234.97
Upper red trendline: $271.07
Final Extension: ~$325–$362
Potential: 271$, 362$, 490$(close but no cigar of the 500$ mark), 593$ technically is the ultimate resistance.
If Solana reclaims its momentum, this setup gives plenty of upside. But let’s be surgical. We are traders first.
⚠️ Final Thought
We’re in the phase of the cycle where hope is expensive.
Structure is free — if you choose to follow it.
Buy over support
Exit near resistance
Trade the level — not the label
One Love,
The FXPROFESSOR 💙
Disclosure: I am happy to be part of the Trade Nation's Influencer program and receive a monthly fee for using their TradingView charts in my analysis. Awesome broker, where the trader really comes first! 🌟🤝📈


Gold breaks through. Will it continue?After breaking through the position predicted by Quaid on Friday, gold rose strongly and finally maintained the fluctuation range of 3345-3360 that I predicted. Gold bulls are now strong. If there is no major change in the news over the weekend, the price will likely continue to rise after a slight decline at the beginning of next week. I think we can still follow the strategy of Dutou.
The 1-hour moving average of gold continues to diverge with a golden cross and upward bullish arrangement, and the bullish momentum of gold is still there. The current strong support level of gold has also moved up to around 3330. After gold broke through 3330 over the weekend, the price fell back to 3330 and stabilized and rose twice. In the short term, this position has formed a strong support.
There is a high probability that the price will have a small correction at the beginning of next week. We can continue the bullish strategy after the price falls back.
Market transactions should abandon personal preferences. Preconceived subjective consciousness will eventually be taught a lesson by the market. The market is always right. We should follow the fluctuations of the market. Instead of having a head full of random thoughts. There are always traces of market changes, and you need to have the ability to discover them or follow those who have the ability. The market changes rapidly, so pay attention to more timely changes.
